The widespread adoption of digital transactions has revolutionized the movement of money, enhancing its efficiency, convenience and accessibility. However, this advancement has also resulted in a concerning rise in credit card fraud, affecting both lenders and consumers alike. In addition to eroding consumer confidence and imposing extra costs on financial institutions, credit card fraud can result in significant financial losses. Conventional fraud detection techniques, including manual inspections and rule-based systems, find it challenging to manage the intricacy and magnitude of fraudulent operations in the contemporary digital landscape. Credit card identity theft is one of the most significant challenges faced by financial companies today. With the rise of e-commerce and banking services offered online along with other electronic payment systems, the frequency and complexity of fraud have also changed. Besides, the direct financial losses caused by credit card thefts, significantly erode customer trust, increase operational costs and pose a serious risk to the reputation of financial institutions.
The dynamic nature of credit card fraud detection is a much more challenging task. Inherently unpredictable, fraudsters continuously adapt their tactics to exploit vulnerabilities in payment systems. Rule-based systems are not effective in adapting to change, as they rely on established patterns that can quickly become outdated. Consequently, there is a greater necessity for more effective and diverse technology to precisely identify fraudulent transactions in real-time. Moreover, every unauthorized transaction that goes undiscovered can damage an institution's reputation by raising doubts in the minds of clients about its ability to protect their money, in addition to causing financial loss.
To address this issue, we implemented a methodology that overcame the class-imbalanced issue. In the credit card fraud detection dataset, the class imbalance problem is resolved using a sampling technique. We applied undersampling of the initial larger class (Normal transactions) and oversampling of the minority class (fraudulent transactions) to adjust the dataset’s distribution. Although these techniques help balance the data, each has its drawbacks: undersampling risks losing valuable information from legitimate transactions, while oversampling may lead to overfitting. Instead of duplicating the minority classes we used the SMOTE technique which generates the synthetic samples and overcomes the issue of overfitting. In our results, an artificially created dataset using SMOTE has 99.82% accuracy, with merely 0.17% classified as fraudulent.
The Hierarchy/Flow of Research
This study investigates a combination strategy of employing SMOTE to oversample the minority class and under-sampling the majority class. The process includes:
• Gathering and preparing data.
• Using Class Balancing techniques (under-sampling and oversampling).
• Random Forest Decision Tree, K-Nearest Neighbors and Naïve Bayes are used for training the models.
• Performance metrics (accuracy, precision, recall and F1-score) are used for evaluating and comparing the models.
Novelty of Study
This study's originality is attributed to numerous critical elements. This study tackles class imbalance in credit card fraud detection with a novel integration of under-sampling and SMOTE resampling techniques, in conjunction with ensemble models like Random Forest, Decision Tree, K-Nearest Neighbors, Support Vector Machine and Naïve Bayes. The paper does a comprehensive comparative analysis of SMOTE and under-sampling to assess their respective and collective impacts on model performance. It further improves model efficacy on unbalanced datasets via cost-sensitive learning, which penalizes fraudulent transactions (false negatives) and incorporates this methodology into the model training process. Ultimately, the emphasis is on creating models proficient in the real-time identification of fraudulent transactions, responding to the urgent demand for rapid detection in fluctuating contexts.
Literature Review
Class imbalance presents considerable difficulties in credit card fraud detection, leading to the formulation and examination of various machine-learning approaches. Despite the efficacy of classic classifiers like Logistic Regression and Logistic Regression, they frequently fail to achieve optimal outcomes owing to the imbalanced distribution of fraud detection datasets. Recently advancements in machine learning, particularly in the ensemble method like the Random Forest, have indicated that the efficiency of the fraud detection system can be improved. These models are advantageous as they combine the best features of several algorithms, which improves the general forecast level. Nevertheless, these models frequently exhibit a bias towards the predominant class, rendering the issue of class imbalance an unresolved challenge.
The research proposed a deep learning method that uses sequential transaction data to find temporal patterns in the transaction sequences, which in turn significantly improves the detection rate. Their research successfully highlighted the need to address class imbalance to avoid bias in models [1]. Researchers examined ensemble learning techniques and found that these methods enhance accuracy and model generalization for fraud detection when combined with SMOTE [2]. Regarding the class imbalance issue, a researcher suggested an adaptive cost-sensitive learning method in which the cost of misclassifying the minority class varies with time. Based on the analysis presented in this paper, it was demonstrated that it is possible to enhance the identification of fraudulent transactions without substantial degradation of the model’s performance on the majority class transactions [3]. A researcher in their comparative study of class balancing methods identified that the highest level of accuracy, recall and precision was achieved from the methods that combine both algorithmic balancing and oversampling [4].
The literature has also focused on under-sampling techniques. Patel and Singh proposed a cluster-based under-sampling method that removes instances of the majority class based on their proximity to the minority class. This method assists in equalizing the data and preserving valuable information that aids the model in achieving high accuracy [5]. A researcher proposed the use of under-sampling and dynamic data reduction techniques to preserve the diversity of valid transactions while balancing the dataset [6]. Numerous academics have focused on improving the stability of machine learning models by methods beyond these approaches. To eliminate noisy and borderline samples from the dataset, a researcher introduced SMOTE-ENN, which combines SMOTE with Edited Nearest Neighbors. As demonstrated, applying this strategy will decrease overfitting and increase the model’s ability to generalize, especially in fraud detection cases [7]. A latest research showed that it is viable to oversample artificial fraudulent transactions using GANs and increase the detection rates through generative adversarial networks [8].
A recent study indicates that the integration of under-sampling and oversampling techniques has emerged as a significant research domain. Researcher in their research examined a hybrid methodology that employed SMOTE to augment the minority class following an enhanced under-sampling technique that eliminated duplicate legitimate transactions. They asserted that the integrated approach was superior to the individual methods due to its enhanced accuracy, improved recall and reduced bias compared to the other two models [9].
Researchers presented an ensemble model where different under-sampling and oversampling methods are integrated into one model. By implementing the strengths of both methods, their approach was able to develop a strong fraud detection system that is capable of handling various types of transaction data [10]. The study focuses on the potential of concurrently employing many methodologies and addresses the problem of class imbalance in fraud detection. Therefore, in this study, a mixed approach of under-sampling and SMOTE has been suggested with different machine learning algorithms for the better identification of the target class.
Machine Learning Models
Decision Tree
Decision Trees categorize transactions by employing data attributes as the foundation for decision-making procedures. Decision Trees divide data according to feature values at each node, beginning at the root node as shown in Figure 1 [11]. Every leaf denotes a categorization (fraud or legal) and every internal node reflects a feature-based conclusion [12]. To lessen class uncertainty, the Decision Tree algorithm chooses splits depending on measures such as entropy or Gini impurity. To avoid overfitting, trees continue to grow until a halting condition (such as the maximum depth) is reached. To classify a new transaction, follow the path from the root to a leaf to prevent overfitting, decision trees may require adjustments, such as pruning, to effectively capture complex patterns in the data [13][14].
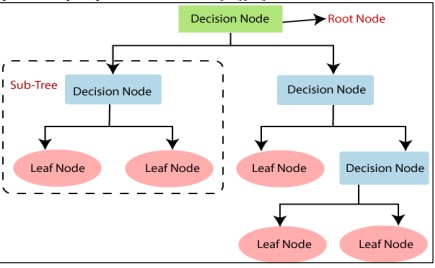
Figure 1. Decision Tree Classifier [15]
Naïve Bayes
The Naive Bayes classifier employs stringent independence requirements among features to implement Bayes' theorem as shown in Figure 2 [16].
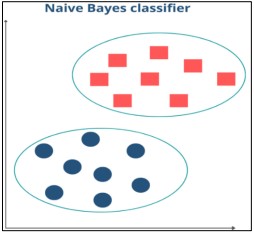
Figure 2. Understanding of Naive Bayes Classifier [16]
Naïve bayes algorithm uses the following formula to determine the likelihood that a transaction, given its characteristics, falls into a specific class (fraudulent or legitimate):
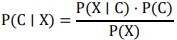
Assumes that each feature contributes to the classification independently, which makes computations easier but it may not accurately reflect real-world situations. For every transaction, the class with the highest posterior probability is assigned. Naive Bayes is effective with large datasets and proficient in managing high-dimensional data, although its performance may deteriorate if the independence condition is significantly violated [17].
Logistic Regression
Logistic regression is a popular statistical technique used for binary classification problems, such as credit card fraud detection. Unlike linear regression, which produces continuous outcomes, logistic regression utilizes the logistic function, or sigmoid function, to estimate the probability of a binary event. This logistic function can transform any real number into a value between zero and one as shown in Figure 3 [18].
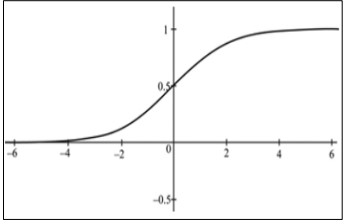
Figure 3. Logistic Regression [18]
The Logistic model is the same as putting linear regression as input to a sigmoid function as given below.
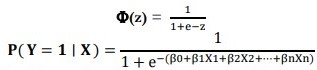
Where X1, X2 , Xn are the variables used as predictors and β0, β1,…,βn are the coefficients derived from the data and P(Y=1/X) is the possibility that the dependent variable Y is 1 (for example, a fraudulent transaction).
K-Nearest Neighbors (KNN)
Transactions are categorized by KNN according to the feature space's majority class of their closest neighbors. KNN is easy to use and efficient for small datasets; however, for large datasets, it can be computationally costly and dependent on the feature scaling[19][20].
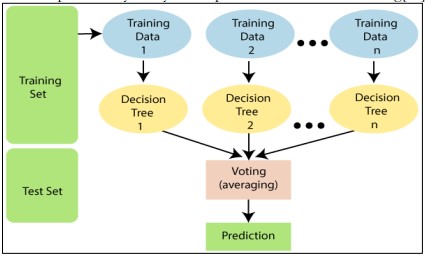
Figure 4. Random forest Classifier [21]
Random Forest
Several Decision Trees are combined in a Random Forest, an ensemble learning technique, to increase accuracy and decrease overfitting. Several Decision Trees are built using an ensemble of trees, each of which is trained using a distinct bootstrap sample of the data.
Figure 4. Illustrates a Random Forest Classifier that consists of several Decision Trees [21]. Each tree makes its prediction by using a random subset of the training data. After aggregating the votes from all trees, the final classification is determined.
Methodology
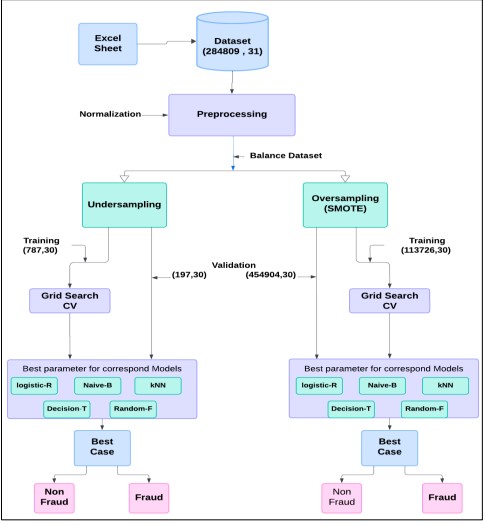
Figure 5. Proposed Methodology
Figure 5 depicted the entire fraud detection process, starting from input data without labels, which contained 284,809 transactions and 31 features. This data was utilized in preprocessing, where features were normalized and encodings applied. The data was split into 80% for training and 20% for testing. Two data balancing techniques were applied to the training data: under-sampling, which reduced the samples of the majority class (non-fraudulent transactions), and SMOTE (Synthetic Minority Over-sampling Technique), where new instances were synthesized for the minority class (fraudulent transactions). For each balanced dataset, a Grid Search with Cross-Validation (CV) was conducted to tune the hyperparameters for five different models: Logistic Regression, Naive Bayes, k-Nearest Neighbors (KNN), Decision Tree, and Random Forest. The optimal hyperparameters were identified for each model, and the best-performing model was then used for classifying fraud in the test data.
Dataset
The first feature was Time and the second was amount which was analysed. The dataset was imbalanced, with each transaction classified as either legitimate or fraudulent. Its realistic attributes and significant class imbalance made it extensively utilized in credit card fraud detection studies, making it ideal for testing machine learning algorithms designed for fraud detection.
Data Challenges
The dataset exhibited a class imbalance, containing 284,315 samples from class 0 (Legitimate) and 492 samples from class 1 (Fraudulent), as illustrated in Figure 6. This implied that many crimes could remain undetected, as models might achieve high accuracy with the minority class while demonstrating poor overall accuracy. This reality emphasized the need for more effective fraud detection tools to reduce this gap.
Consumers, geographic regions, and time of day all contributed to unpredictable transaction patterns, further complicating matters. These discrepancies hindered models from generalizing their findings from training data to unseen transactions, and the dataset contained a limited number of fraudulent transactions.
Furthermore, the size of the dataset and the complexity of its features could lead to overfitting, meaning the model might show high error rates when tested on data outside the training set. This was particularly problematic in fraud detection, where the objective was to correctly classify fraud in real-time, often in a live environment. Figure 7 displayed the line plot of transaction values over time, revealing a sharp spike before the 47-hour mark, indicating that a transaction in that period exceeded 25,000 units.
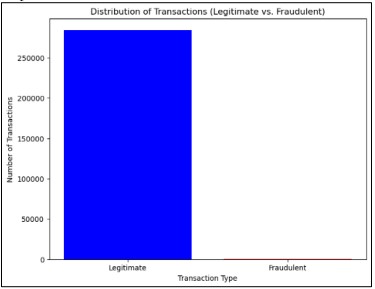
Figure 6. Distribution of Transaction
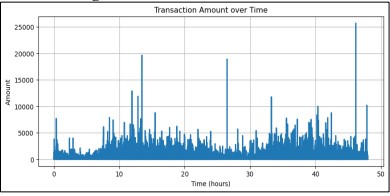
Figure 7. Transaction Amount over Time
Data Preprocessing
The dataset consisted of features V1 to V28, which had small range values, whereas the Time and Amount features had significantly larger ranges. To address this disparity, standardization was applied to ensure that all features were on the same measurement scale. The dataset was divided into training and test sets, with 80% allocated for training and 20% for testing. The objective was to facilitate the assessment of unknown data and ensure that the models had sufficient data for training.
Exploratory Data Analysis (EDA)
The feature vectors V1 to V28 were PCA-transformed features, which distorted traditional feature correlation. However, the correlation of these features with the fraud class (Class 1) was explored. The high heat map values indicated correlation coefficients, with data ranging between -1 and +1. The Time feature, shown in Figure 8, exhibited a very high correlation coefficient, close to 1, suggesting that the time factor played an important role in fraud detection. V3 displayed a highly negative correlation, while V2, V17, V18, and V19 showed moderately positive correlations with Class 1 (fraud). The correlation coefficient between transaction amount and being flagged as fraudulent was 0.15, indicating a weak positive relationship. This implied that higher transaction amounts slightly biased the data towards fraudulent transactions, though not strongly enough to warrant automatic conclusions or predictions based on this factor alone.
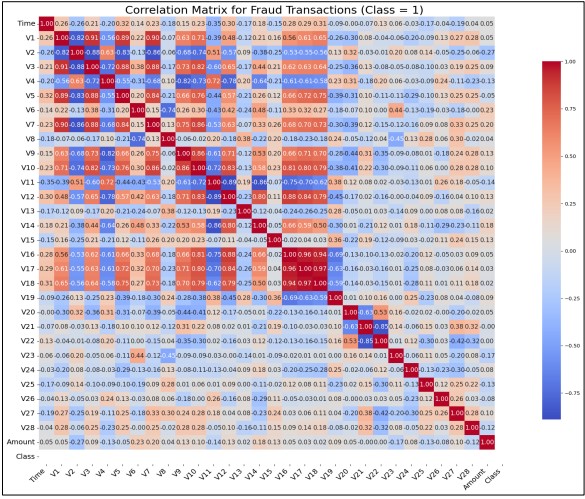
Figure 8. Correlation Matrix for Fraudulent Transactions
Under Sampling and Over Sampling Techniques
Under-sampling, which involved reducing the total number of instances of the majority class to equal that of the minority class, was a viable solution to the problem of class imbalance, as illustrated in Figure 8. While this helped maintain data balance, it could lead to the loss of important details since legitimate transactions tended to be more varied and frequent than fraudulent ones. This reduction could result in underfitting, where the model failed to adequately capture the remaining data characteristics after the dataset was reduced.
In contrast, over-sampling increased the minority class’s percentage to match that of the majority class, as shown in Figure 9. One popular over-sampling method was the Synthetic Minority Oversampling Technique (SMOTE), which generated synthetic instances by combining existing examples of the minority class. SMOTE reduced the risk of overfitting by avoiding the mere duplication of minority class samples, thus diversifying the dataset. However, poorly managed over-sampling could lead to overfitting if the synthetic data closely resembled the actual data, thereby limiting the model's ability to generalize to unseen data.
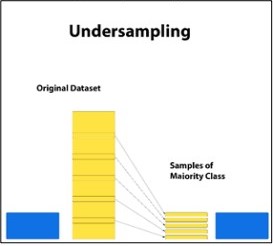
Figure 9. Under Sampling
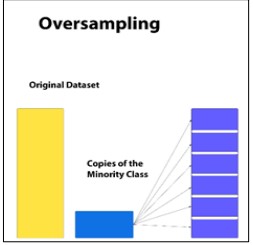
Figure 10. Over Sampling
Figure 9 depicts under-sampling where the majority class (yellow) is the threshold to the size of the minority class (blue). This process is useful to make the dataset balanced while it is quite disadvantageous in the sense that some necessary data will be left out.
Figure 10. illustrates oversampling in which the minority class (blue) is ‘‘grown’’ through duplications or construction of new samples to be similar to the majority class (yellow). This results in overfitting where the model becomes too much inclined to some instances which are repetitions of another instance.
Model Evaluation Metrics
The models were evaluated based on the following performance metrics:
Precision
Precision is the ratio of correctly predicted positives or frauds divided by the total number of positives or frauds that were predicted.
Precision = "True Positives (TP)" /"True Positives (TP)+False Positives (FP)"
High precision also means that the number of instances where the model sends alerts on genuine transactions being fraud is small. While it is good to avoid wrong alarms (most of which can be irritating to customers and disruptive in banking systems by erroneously flagging the transactions as frauds) relying solely on precision can lead to overlooking actual frauds (high false negatives). This is why there is always a need to restore precision in preparation for recalling the data from the storage area.
Recall
Recall (which also goes by sensitivity or True Positive Rate) is presented as all the accurate positive observations to all the overall real positive (+ve Milchgemeinheiten) cases in question here being fraudulent transactions.
Recall = "True Positives (TP)" /"True Positives (TP)+False Positives (FP)
F1-Score
The F1-score is the calculation of the harmonic mean of both precision and recall and offers one single value of each. It is most useful when you want equal weight for Precision and Recall, which is quite often the need in fraud detection.
F1 = (2×Precision×Recall)⁄(Precision+Recall)
In fraud detection, the high level of precision is difficult to attain together with the high level of recall given the nature of the data set as imbalanced. The computation of the F1-score makes it easier to come up with a single value that is useful since it is the harmonic mean of both precision and recall. Recall that the F1-score which ranges between 0 and 1 is used to measure the ability of a model to accurately select the positives, the more the F1-score the better and this is because the curve shows that at a low false alarm rate, the model can pick fraudulent transactions efficiently.
Results and Discussion
Experiment Setup
Python and machine learning libraries, such as Scikit-learn and Imbalanced-learn were used to conduct the tests. On the unbalanced datasets, under-sampled and SMOTE-oversampled, the effectiveness of each model was assessed. The effects of each resampling method on the models' capacity to identify fraudulent transactions were ascertained by analyzing the data.
Model Training with Under Sampling
Table 1. Grid Search Parameters
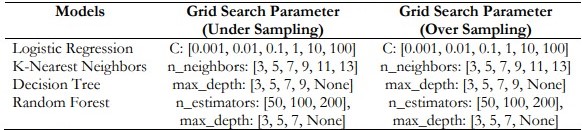
Table 1. shows the Grid Search Parameters for Under sampling and Oversampling across Various Models.
Table 2. Grid Search Best Parameters for Models
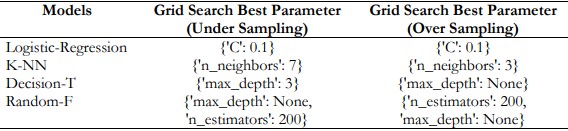
Table 2. Shows the Grid Search best parameters for undersampling and oversampling across various models. As shown in Table 3 through Table 7 below, under-sampling techniques are used in training different models with the best parameters obtained from the grid-search technique.
Logistic Regression
The logistic regression model provided a specificity of about 90.86% in the detection of fraud, with both the precision and the recall also at 90.82%. Nevertheless, this method cannot be deemed the most efficient one for use in real-time fraud detection applications.
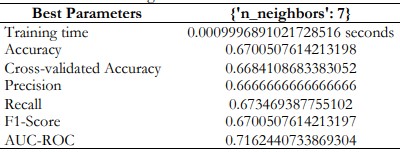
K-Nearest Neighbors
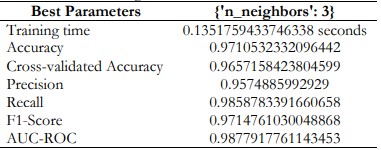
K-Nearest Neighbors only have 67.01% accuracy. This model may not be efficient in its real-world application due to dependence on feature scaling and the high computation required to calculate distances with a new data point.
Table 3. Logistic Regression Performance and Best Parameters
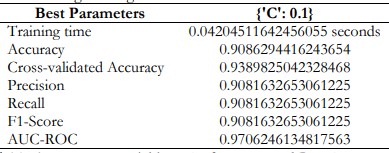
Table 4. K-Nearest Neighbors Performance and Best Parameters
Naïve Bayes
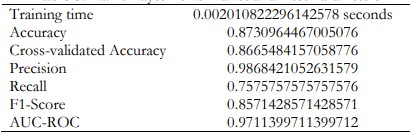
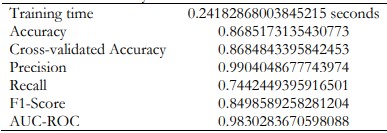
When using Naïve Bayes model, the accuracy is 87.31%. The recall was at a slightly lower 75.76% indicating that it failed to register some of the actual positives. Though this model achieved good precision, the high false negative rate hampers the use of this model for practical use.
Table 5. Naïve Bayes Performance and Best Parameters
Decision Tree
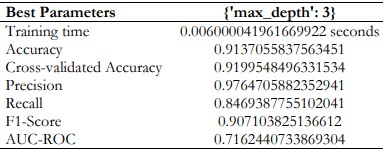
The Decision Tree model has also learned and generated outstanding performance with 97.65% precision on the identification of fraudulent transactions. However, the recall of 84.69% means that not all the fraud cases are detected because sometimes it misdiagnosed, in other words, some kind of fraud could be overlooked. The trade-off between precision and recall means that if deployed, a high degree of precision inherently poses a high rate of false negatives.
Table 6. Decision Tree Performance and Best Parameters
Random Forest
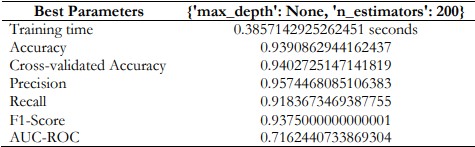
Random Forest produced a high level of accurate fraud detection with an average accuracy of 93.91%. It got an impressive accuracy of 95.74% meaning most of the fraud transactions detected were genuine frauds with a limited number of false alarms. The model effectively recognized more than ninety percent of fraudulent transactions through its recall of 91.84%. This combination allows solving the problem of real-world usage to capture fraud while reducing false positives, which are legitimate transactions. The model achieved an optimal balance between precision and recall that encourages its use in real-world fraud monitoring.
Table 7. Random Forest Performance and Best Parameters
Model Training with Over Sampling
For several models, SMOTE technique was applied to oversample the minority classes in the training data set. First, the model hyperparameters were adjusted using the grid search method to set the right parameters for the models. The models were then trained on the data which was SMOTE oversampled with these tuned hyperparameters. The models developed using this approach are described in Tables 8 – 12.
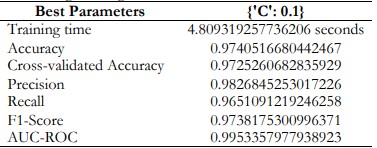
Logistic Regression
Hence logistic regression tries to achieve the minimum false positive and false negative rate. Such a balance is ideal for the model due to the simultaneous identification of fraud cases along with the reduction of wrong fraud cases and fraud cases.
Table 8. Logistic Regression Performance and Best Parameters
K-Nearest Neighbors
With a score of 0.988 for AUC-ROC the KNN model successfully identified the fraudulent transactions versus the non-fraudulent ones.
Table 9. K-Nearest Neighbors Performance and Best Parameters
Naïve Bayes
Naive Bayes models are characterized by higher precision but lower recall. This means they can give fewer false positives, but more false negatives. Therefore, despite the simplicity and relative speed of implementation, Naive Bayes classifiers are not useful where missing true positive outputs is prohibitively expensive.
Table 10. Naïve Bayes Performance and Best Parameters
Decision Tree
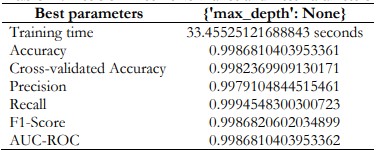
The AUC-ROC score of the proposed decision tree model for fraud detection is 0.999. This high score leads to the conclusion that such a model is quite effective in revealing fraud incidences as well as non-fraud incidences. Such outstanding discrimination ability indicates that the decision tree is capable of supporting fraud detection.
Table 11. Decision Tree Performance and Best Parameters
Random Forest
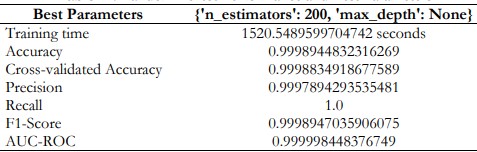
The Random Forest model showed good predictive analysis on this dataset with overall accuracy of 99.99 %, overall recall of 100%, precision of 99.98%, AUC-ROC of 0.9999. These high scores suggest that the model can identify almost all true positives with fewer or no false positives, which thus makes the model genuine in predicting these data.
Table 12. Random Forest Performance and Best Parameters
Discussion
The results of this study highlight how crucial it is to address class disparities in credit card fraud detection. The findings show that while SMOTE and under-sampling both enhance model performance, the hybrid technique provides the most sensible and efficient fix. By adding these methods to their current systems, financial institutions can greatly improve their ability to detect fraud.
Prioritizing ensemble techniques like Random Forest is a good idea because of their proven ability to handle imbalanced datasets. These models are well-suited for real-world fraud detection applications where both sensitivity and specificity are critical since they not only achieved high accuracy but also maintained excellent recall and precision.
Comparison of Cross-Validation Accuracy
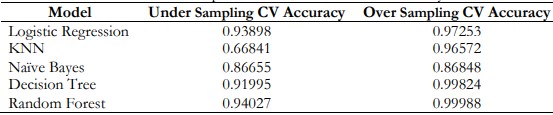
Figure 11 and Table 13 shows the comparison of Cross-Validation Accuracy between under-sampling CV Accuracy and Oversampling CV Accuracy. Random Forest got the highest CV Accuracy in the Oversampling method in comparison to sampling.
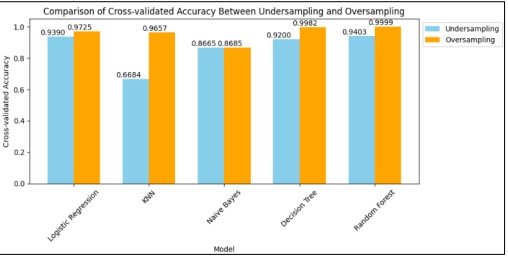
Figure 11. Comparison of Cross-Validated Accuracy
Table 13. Comparison of Cross-Validation Accuracy
Comparison of ROC-AUC
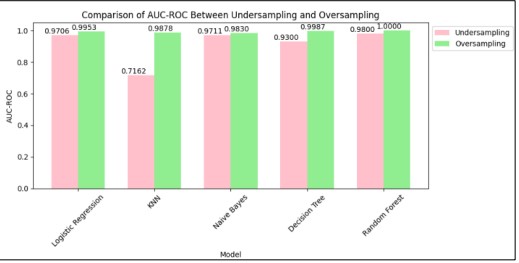
Figure 12. Comparison of AUC-ROC
Table 14. Comparison of ROC-AUC
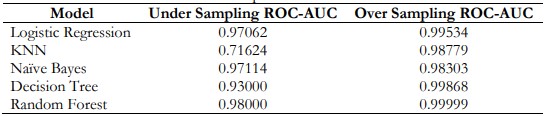
Figure 12 and Table 14. Represents the Comparison of ROC-AUC of under-sampling and oversampling in which several models are applied. Random Forest performs the best ROC-AUC. Logistics is also performs the best ROC-AUC in the Oversampling method.
Comparison of Precision
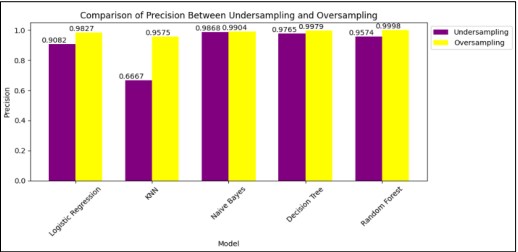
Figure 13. Comparison of Precision
Table 15. Comparison of Precision
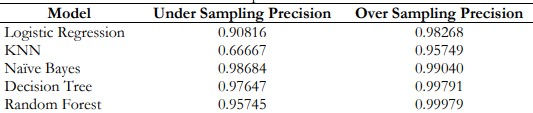
Figure 13 and Table 15. shows 0.99979 Precision of Random Forest which is greater than other models.
Comparison of Recall
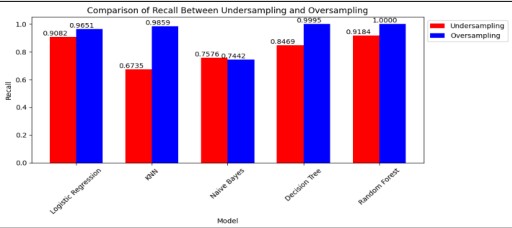
Figure 14. Comparison of Recall
Table 16. Comparison of Recall
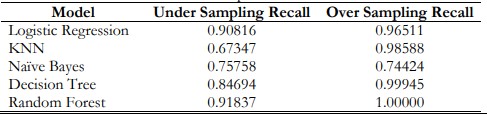
Figure 14 and Table 16. shows that among all, Random Forest performs better in the oversampling Method than under the sampling method.
Comparison of F1-Score
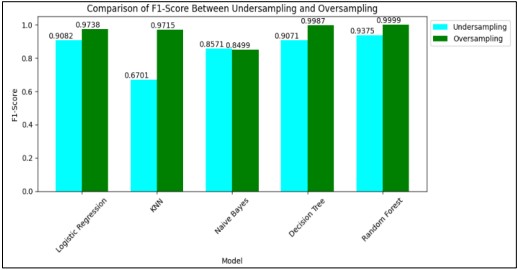
Figure 15. Comparison of F1-Score
Table 17. Comparison of F1-Score
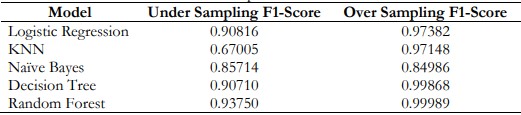
Figure 15 and Table 17. represents the comparison of the F1-Score of different models in which Random Forest got the highest F1-Score and performed the best in the Oversampling Method. In the field of finance, when developers make their predictions, they still have a choice between accuracy where it’s the actual correct predictions made out of total predictions made and recall where it is the proportion out of total potential correct predictions made.
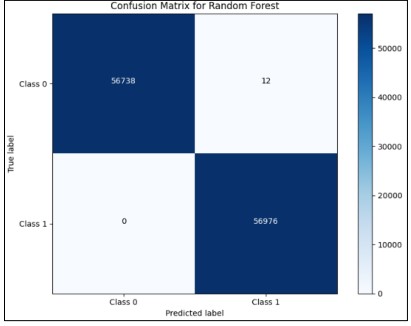
Figure 16. Confusion Matrix for Random Forest
These metrics need to be controlled to their organization’s risk tolerance – while more cutting-edge firms may accept some more false positives to capture more opportunities—the more conservative firms use higher recall but at the same time lose more mistakes. The optimal precision and recall values that the financial institutions should use should correspond to one’s business model and risk appetite. According to our results, the Random Forest model has provided 99.99 AUC-ROC. It provides the best Precision, Recall and F1-Score as compared to all models shown in Figure 16. This makes the model a good fit for operational use in fraud detection where it is more expensive to miss actual frauds than it is to generate false positives.
Conclusion
This work has successfully addressed the issue of class imbalance in credit card fraud detection and improved the performance of machine learning models significantly. In credit card fraud detection, recall is essential for practical applications where false negatives—fraudulent transactions that are incorrectly classified as non-fraudulent—can cause significant financial losses. The Random Forest model yielded nearly flawless classification results, with very few false positives and zero false negatives, according to the confusion matrix. In the future, we will use the original balance dataset for credit card fraud detection.
Acknowledgement
I would like to thank the faculty of the Computer Science Department Muhammad Nawaz Shareef University of Engineering and Technology Multan for providing the necessary resources.
Author’s Contribution
Each author has made an equal contribution to this study.
Conflict of Interest: In publishing this work in IJIST, the authors state that they have no competing interests.
Project Details
Nil.
Reference
[1] J. Zhou, Y., Li, H., Sun, “Sequential transaction analysis for fraud detection using deep learning,” IEEE Trans. Knowl. Data Eng., vol. 33, no. 4, pp. 1024–1035, 2021.
[2] D. Nguyen, T., Tran, P., Pham, “Ensemble learning for credit card fraud detection: A comparative study,” J. Financ. Data Sci., vol. 6, no. 2, pp. 89–101, 2022.
[3] Z. Khan, I., Ali, M., Rehman, “Addressing class imbalance in credit card fraud detection with adaptive cost-sensitive learning,” J. Artif. Intell. Res., vol. 74, pp. 354–367, 2022.
[4] F. Wang, X., Liu, Y., Zhang, “Comparative analysis of class balancing techniques in credit card fraud detection,” Data Sci. Anal., vol. 9, no. 3, pp. 221–235, 2023.
[5] R. Patel, V., Singh, “Cluster-based undersampling for enhanced credit card fraud detection,” Int. J. Mach. Learn. Cybern., vol. 12, no. 9, pp. 2467–2480, 2021.
[6] R. Liu, X., Chen, Q., Wong, “Dynamic data reduction in imbalanced datasets for fraud detection,” IEEE Access, vol. 11, pp. 101456–101469, 2023.
[7] Y. Chen, L., Zhang, “SMOTE-ENN: A novel hybrid oversampling method for credit card fraud detection,” Expert Syst. Appl., vol. 193, 2022.
[8] W. Gao, Y., Huang, S., Ma, “GAN-based oversampling for imbalanced credit card fraud detection,” J. Mach. Learn. Res., vol. 24, no. 1, pp. 567–586, 2023.
[9] L. Yang, Z., He, C., Wang, “Hybrid sampling strategies for credit card fraud detection using machine learning,” Comput. Secur., vol. 114, 2022.
[10] J. Kim, S., Lee, “An ensemble approach to credit card fraud detection using hybrid sampling methods,” J. Financ. Technol., vol. 13, no. 1, pp. 56–69, 2024.
[11] “https://www.google.com/url?sa=i&url=https%3A%2F%2Fwww.javatpoint.com.” Accessed: Oct. 07, 2024. [Online]. Available: https://www.google.com/search?q=%5B14%5D+https%3A%2F%2Fwww.google.com
[12] Y. Zhang, X., Chen, J., Ye, “An optimized decision tree-based credit card fraud detection system,” J. Financ. Risk Manag., vol. 15, no. 2, pp. 85–99, 2022.
[13] A. Nguyen, H. T., Seifoddini, “Improving credit card fraud detection with decision trees,” Int. J. Data Sci., vol. 6, no. 3, pp. 122–136, 2023.
[14] Z. Chen, R., Yin, “Comparative analysis of Naive Bayes models for credit card fraud detection,” J. Mach. Learn. Res., vol. 24, no. 4, pp. 1012–1030, 2023.
[15] “https://www.google.com/url?sa=i&url=https%3A%2F%2Fwww.javatpoint.com%2Fmachine-learning-decision-tree-classification-algorithm&psig=AOvVaw3kbxqoVivWNf5ktMh_8gTn&ust=1727499888557000&source=images&cd=vfe&opi=89978449&ved=0CBQQjRxqFwoTCLD66-Ws4ogDFQAAAAAdAAAAABAE - Google Search.”
[16] “PAB-1024x1024.png (1024×1024).”
[17] V. N. Nguyen, T. H., Huynh, “Application of logistic regression in credit card fraud detection,” J. Financ. Anal., vol. 12, no. 3, pp. 120–135, 2021.
[18] “Logistic regression - Wikipedia.”
[19] N. V. Chawla, K. W. Bowyer, L. O. Hall and W. P. Kegelmeyer, “SMOTE: Synthetic Minority Over-sampling Technique,” J. Artif. Intell. Res., vol. 16, pp. 321–357, Jun. 2002, doi: 10.1613/JAIR.953.
[20] H. He and Y. Ma, “Imbalanced learning : foundations, algorithms and applications,” 2013.
[21] “https://www.google.com/url?sa=i&url=https%3A%2F%2Fwww.javatpoint.com%2Fmachine-learning-random-forest-algorithm&psig=AOvVaw07NdYlnM7ufWG_W83NAQAC&ust=1727692885341000&source=images&cd=vfe&opi=89978449&ved=0CBQQjRxqFwoTCKinmtf754gDFQAAAAAdAAAAABAE - Google.”
