Modeling student actions is an emerging research field that aims to understand the "how" and "why" behind behaviors, reflecting a human-centered approach to knowledge acquisition [1]. Assessment is a crucial component in every educational approach, as it measures the extent of students' comprehension related to their learning outcomes [2]. However, student dishonesty during exams remains a widespread issue, transcending various levels of societal development. Although there isn't a universally accepted definition of exam dishonesty, certain behaviors are widely recognized as indicators of academic misconduct, all of which have ethical implications aimed at enhancing perceived academic success [3]. Traditional methods of exam supervision in educational institutions typically involve invigilators physically present in the examination hall, overseeing the process to detect any unethical behavior among students.
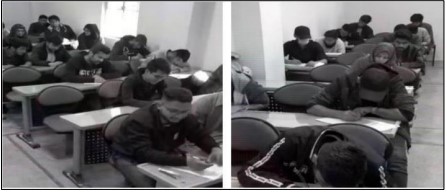
Figure 1. Exam Scenario [4]
Figure 1 shows examination scenarios from the CUI Dataset used for detecting cheating behavior. Invigilators monitor students as they move around the exam room, seeking out any indications of dishonesty. Manual observation and tracking of student behavior during written exams are challenging tasks, leading to numerous cases of academic misconduct being identified each year [5]. Deception during exams refers to violations of test policies through various covert actions such as hiding notes, using body gestures to convey messages, watching nearby students' work, passing notes discreetly, and illicitly using technological devices like cell phones and digital watches [6][7]. Various theories explain the root causes of cheating, often attributed to social and psychological factors [8][9]. Psychological challenges include time pressure and test anxiety, which may be compounded by social pressures, such as family expectations and feelings of inadequacy [10]. Cheating during exams not only undermines academic integrity but can also have far-reaching consequences, such as fostering dishonest behavior in professional life, distorting competence assessments, and damaging the reputation of educational institutions [11][12][13][14].
In Pakistan, a student's future educational and career opportunities are heavily impacted by national exams, particularly the annual intermediate and matriculation tests. Given the significant influence these tests have on the socioeconomic status of the candidates, they are a matter of national concern. The country observes a decrease in usual activities throughout the testing period to guarantee the seamless operation of the tests. Given the great stakes involved, it is imperative to guarantee the fairness and integrity of these tests, hence the court decided to punish cheating severely. Those caught guilty of cheating or helping others to cheat on these tests risk penalties and jail. Examining another examinee's paper, trading signals or materials, using forbidden technological devices, and getting help from invigilators are among the cheating activities undermining the fairness of tests. Although required, traditional proctoring systems using on-site invigilators have several restrictions. The Pakistani government's education officials use dual proctoring techniques to handle these difficulties. Using face recognition technology, on-site invigilators confirm examiners' identities and search for illegal objects with metal detectors. Video monitoring also lets institutional staff keep an eye on the whole examination room, therefore lowering the possibility of coordinated cheating between invigilators and test candidates. But over lengthy stretches of time, human attention can fade, particularly when watching large amounts of video footage, and might result in missing details. This study seeks to maximize the use of the current infrastructure as much as feasible thus improving the detection of cheating capacity. Artificial intelligence (AI) is used to spot questionable activity; human staff reviews these AI-flagged events to guarantee accuracy and equity.
In our proposed work, we introduced an innovative method for offline exam activity recognition (EAR) that utilizes deep learning techniques for the automatic classification of student behaviors during examinations. Our method is based on a finetuned ResNet50 architecture, which has been adapted to recognize six distinct behaviors indicative of potential cheating: back watching, front watching, normal, showing gestures, side watching, and suspicious Watching. To address the problem statement, we used ResNet50 as our base model pre-trained on the ImageNet dataset with the first 100 layers’ weights unfrozen, and additional customized layer classes introduced accordingly. This approach helped to identify delicate patterns of student behaviors while preserving the stability of the pre-trained model. For this, the model was trained on an expanded data set obtained by applying additional data preprocessing and normalization and using techniques such as dropout to eliminate overfitting. The proposed method outlines strategies to reduce the burden on human invigilators while efficiently monitoring and detecting adverse student conduct during examinations.
These features were then fed into a deep learning-based classifier for examining the students’ activities during exams. A major issue observed during the conduct of this particular research was the prepared dataset’s considerably small size. In order to avoid this, the current work suggests the use of fine-tuning a pre-trained deep learning model. Utilizing the ResNet50 model pre-trained on ImageNet, the curated dataset substantially enhanced the algorithm's ability to identify students' actions. The above-mentioned steps were taken to enhance the strength of our proposed model, However, during training, k-fold cross-validation was used to minimize bias and avoid overfitting on the data set. Comprehensive experiments were run, and the structural design and different parameters were adjusted aiming at defining the best model. The maximum training accuracy attained was 96.57% using the pre-trained SSL ResNet50, followed by adding extra dense and drop-out layers. The major contributions of this work are as follows:
Fine-Tuning of a Pre-Trained Res Net 50 Model
Instead of constructing a fresh CNN model from scratch, a pre-trained ResNet50 is utilized and refined on the examination dataset. This approach efficiently utilizes transfer learning and offers a solid foundation for activity recognition-based Feature subset selection approach is adapted for dimensionality reduction of the feature space.
Utilization of a Custom-Prepared
Dataset (CUI- EXAM)
The dataset is specifically prepared to evaluate the performance of the fine-tuned ResNet50 model in the context of exam proctoring and cheating detection.
Extensive Experiments with Various Model Configurations
Numerous configurations were tested, including the addition of dense and dropout layers, to enhance model accuracy and generalization. The best results demonstrated the model's effectiveness with an accuracy of 96.57%.
Comparison with Baseline Models
The proposed method’s performance was benchmarked against various classifiers, demonstrating superior accuracy, which supports the viability of the framework for automatic exam proctoring. The organization of this manuscript is as follows: The introduction section presents basic terminologies and the description of the proposed domain. Existing studies are reviewed in the literature review. The third section details the proposed approach and its steps. The results are presented and discussed in the fourth section. Finally, the manuscript is concluded in section five, followed by references.
Literature Review
Proctoring is one of the most effective methods for addressing academic misconduct. Dendir et al. [15] investigated the prevalence of academic dishonesty among students enrolled in online courses. They integrated online proctoring into the examination while maintaining other materials unchanged, employing statistical tools to analyze the differences in test scores before and after its implementation. According to the final findings, exhibited previous cheating behaviors; thus, online proctoring could significantly mitigate academic misconduct. Farmer et al. [16] conducted research on how the number of invigilators affected examinees' behavior. There were five groups formed from the examinees: In the first, the last group had an equal number of invigilators and examiners; the other groups had varying numbers; the group had no invigilators. of witnesses. The findings of the above-mentioned study revealed that the group without invigilators did worse than other groups, the number of invigilators had no effect whatsoever. The findings of all the investigations confirm that proctoring can help to somewhat lower cheating rates and produce excellent results.
Rosen and Carr [17] created a desktop robot for online learning or proctoring using a Webcam and a suite of directional sound sensors for real-time monitoring. But this approach is only applicable to the analysis of one examinee; so, it is not feasible to call attention to a lot of examinees by voice. Zhang et al. [18] developed a system suitable for online proctoring that utilizes facial recognition for the login process and analyzes the atypical movements and expressions of the examinees. This approach has quite great accuracy, but it is practically difficult to utilize a camera to recognize the faces of dozens of persons in the offline examination room. Atoum et al. [19] suggested a proctoring online system. That is more complicated and improves the accuracy of identifying malpractices in a classroom. The software comprised identity authentication, input detection, and voice recognition, among other features. Thus, assessing comprehensive characteristics may assist in ascertaining whether the examinee engaged in dishonest practices. This approach combines the ideas of the last two and has more accuracy and hence more computational re-requirement. It is still unfit for high-density offline analysis houses. Asep and Bandung [20] suggested a fresh approach for visual confirmation of difficulties in online tests that would be more suited to some unusual positions and changing illumination.
This study pertains to a single individual, similar to other investigations. In summary, the prior research does not encompass offline multi-person assessments. Li et al. [21] suggested a method using a background-difference technique to locate the examinees' positions. They also incorporated a face recognition module into the system to identify candidates before the test begins. Finally, they employed Alpha Pose, a real-time multi-person posture estimation system created by Fang et al. [22], to monitor physical behavior and determine if examinees were cheating. However, their approach has several shortcomings. The background-difference approach is particularly vulnerable to noise and interference, including variations in lighting Tsai et al. [23]. The method is imprecise because environmental factors like weather cause frequent variations in lighting conditions within exam rooms. Although face recognition may function effectively in an optimal setting with a limited number of individuals, it is almost impractical in a real examination environment with numerous candidates. Numerous candidates may be positioned too distantly from surveillance cameras for dependable facial recognition. The processing requirements of Alpha Pose are very high; even when replaced with the more efficient Light Weight Open Pose Osokin [24], it can only attain 26 fps on an Intel Core i7-6850K. For a school with more than thirty examination rooms, each hosting forty examinees, the computational load makes this approach impractical for concurrent use.
In our research, we have developed a novel approach that enhances existing methodologies to effectively address the complexities of offline exam proctoring in challenging environments, such as those found in Pakistan. Utilizing a finetuned ResNet50 model, our approach achieved high accuracy in detecting six distinct behaviors indicative of cheating: back watching, front watching, normal behavior, showing gestures, side watching, and suspicious behavior. While this model is based on a robust and efficient architecture, it has been optimized to manage the demands of large-scale deployment across multiple exam rooms simultaneously. Furthermore, the model is designed to accurately capture and classify subtle behaviors, even when examinees are small or partially obscured within the frame. This tailored approach provides a more practical and scalable solution for offline exam proctoring in environments with varying conditions and large candidate numbers.
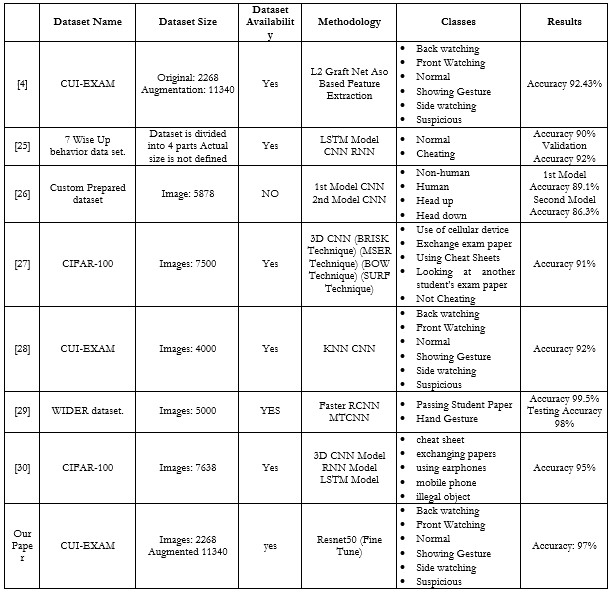
Table 1. Overview of datasets, methods, classes, and outcomes for cheating identification in the exam proctoring systems.
Poppe et al. [31] explored the application of Convolutional Neural Networks (CNNs) for image representation and action classification, discussing the associated limitations. The study highlighted that action classification techniques can be divided based on whether or not a temporal axis is utilized. The author concluded that human action recognition could be framed as a classification problem under specific conditions. Building on this foundation, Yao et al. [32] investigated CNN-based methods for action recognition in video sequences Identifying the challenge of integrating two different information dimensions spatial and temporal using CNNs.
In contrast to earlier approaches, our research leverages the fine-tuned ResNet50 model, which focuses on image-based action recognition without explicitly incorporating temporal information. This approach allows for efficient classification of distinct actions by extracting and analyzing spatial features from images. Unlike Masoud et al. [33], who proposed projecting video data into a lower dimension for action recognition, our method employs the powerful feature extraction capabilities of ResNet50 to handle high-dimensional image data directly, ensuring that no critical spatial information is lost during processing.
Additionally, Sharma et al. [34] extended 2D CNNs to 3D and proposed unsupervised learning models for sequence learning, utilizing Recurrent Neural Networks (RNNs) to classify . While these methods are effective for sequence-based data, our approach is designed for scenarios where temporal information is either unavailable or unnecessary, focusing instead on accurately classifying actions based on spatial features in static images. Researchers [4] introduced a novel 3D CNN model for action recognition that integrated temporal and spatial information. However, this research demonstrates that a well-optimized ResNet50 model can achieve high accuracy in recognizing actions by concentrating solely on spatial information, making it particularly suitable for offline exam proctoring, where the primary concern is identifying specific behaviors in still images rather than video sequences.
Overall, this study illustrates that the handling of high-dimensional spatial data, without the need for dimensionality reduction or temporal integration, can be highly effective for action recognition in specialized contexts such as offline exam monitoring.
Dataset
In the context of offline cheating detection, the CUI dataset was obtained from COMSATS University Islamabad after contacting them through email. It was adapted and restructured into six specific classes: back watching, front watching, normal, showing gestures, side watching, and suspicious watching. This categorization was essential to capture various behaviors related to potential cheating scenarios. The dataset was already augmented to enhance the model's performance and ensure a robust evaluation of student activities during exams.
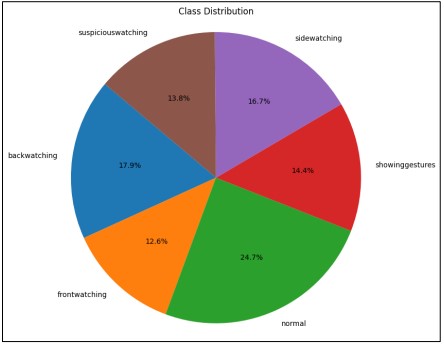
Figure 2. Distribution of the classes in the dataset
We have an imbalanced dataset, as shown in Figure 2, which depicts the class distribution across the six categories. This imbalance highlights the need for careful consideration in the analysis and detection of cheating behavior.
A pie chart was then produced in order to ascertain the distribution of images to classes as shown below in Figure 2. The images were also resized to fit a uniform size of 224 by 224 pixels, which is a normal procedure in deep learning models. 80% of the data was assigned to the training set and the reminder 20% was used as the validation set. This split was done using Tensor Flow’s image dataset from the directory function that not only loads the images but also labels the images based on their directory names.
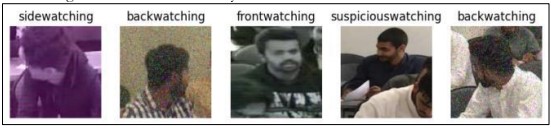
Figure 3. Some of the images in a sample dataset demonstrate student activities [4]
A selection of photos from the collection, together with their respective classes, is illustrated in Figure 3. This visualization helps in understanding the nature of the images and the diversity within each class. It comprises 2,268 snapshots capturing student activities during offline examinations, recorded via surveillance cameras. The dataset (Figure 4) is annotated from 50 video streams, with each snapshot featuring bounding boxes around individual students. These bounding boxes are manually cropped and categorized into six distinct classes: (a) looking backward, (b) facing forward, (c) performing normally, (d) exchanging gestures with others, (e) observing towards the left or right, and (f) exhibiting other suspicious behaviors. Due to the challenging nature of the dataset, which includes images with significant blurring and distant perspectives, dataset augmentation was employed to enhance its size. Table 2 presents the dimensions of the dataset prior to and subsequent to augmentation.
Table 2. CUI-EXAM dataset distribution of images per class.
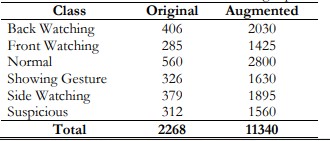
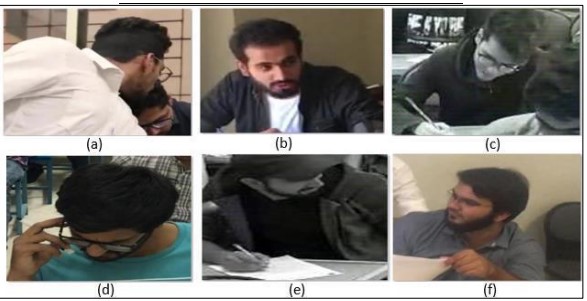
Figure 4. Different cheating situations were recorded for the offline cheating detection system [4]
Dataset Augmentation
Deep learning models require extensive datasets to perform effectively during the training phase. The quality and diversity of the data are crucial for the model to generalize well to new, unseen scenarios. However, acquiring such large and varied datasets can be challenging, particularly in specialized domains. To address this, data augmentation is employed as a strategy to artificially expand the dataset. By applying various transformations to the existing data, augmentation helps simulate a wider range of conditions and scenarios without the need for additional real-world data collection.
In this context, four different types of augmentations were selected to enhance the dataset: Among these, the transformations used for image processing included mirroring, Gaussian noise, Salt and Pepper noise, and color space shifting. This process aims to double the amount of data by mirroring, which involves flipping the images horizontally. It is necessary to define the kind of noise considered, Gaussian noise may be explained as a small deviation from the real values of the pixels which can denote different illuminations or slight imperfections that occur in real life. They include salt and pepper noise which occurs at random and changes the image to either black or white noise like other types of image destruction. Finally, color shifting changes the color spectrum and contrast of such images so that the model receives examples of the same scene under different illumination. These augmentations do not only add more data points for the model to learn from but it also brings new representations of the data to improve the performance of the model as well as the preparedness of the model for data wagon. Therefore, the size of the dataset increases to four times the original size of the dataset, and in general the deep learning model is trained with a much bigger and more complex data set. It needs other related instance data to be fed to the model so as to enhance new data training of the model. Figure 5 clearly illustrates how each of the aforementioned procedures has enhanced or altered the primary image [4].

Figure 5. Augmented Dataset
Table 3. Dataset Augmentation Techniques
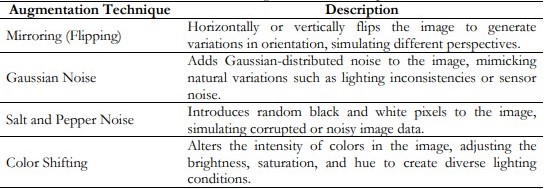
In Table 3, all the listed augmentation techniques are applied to enhance the dataset diversity. These techniques include mirroring to simulate different orientations, Gaussian noise, and salt and pepper noise to introduce realistic noise and variability, and color shifting to account for changes in lighting and color balance. Together, these augmentations help improve the model’s ability to generalize and perform more robustly in real-world scenarios.
Data Resize
In the methodology used in this study, we cropped the input images to the same dimension of 224 x 224 pixels to ensure they fit into the ResNet50 architecture. The resizing process was essential, as the photos required modification to conform to the model's input dimensions. This guaranteed that the training model could accommodate all the photos; otherwise, a size discrepancy would occur. Conversely, down sampling these photos mitigated the computational complexity of the training step and reduced the space they occupied. Further, the resizing causes no distortion to the key features of the images, which was information required for accurate classification. This step together with other such preprocessing techniques enhanced the efficiency of our model.
Methodology
In the currently proposed approaches, we used a number of deep learning models to predict student activity during exams. In particular, we deployed Res Net 50, from scratch, Mobile Net, fine-tuned VGG16, and fine-tuned ResNet50 as our base model. Specifically, each model was selected for the optimum performance it offered in analyzing the student behaviors during examinations.
Dataset Preprocessing
During the preprocessing phase, we cleaned our data to ensure that our models could effectively learn from the obtained dataset. Therefore, there were basic image manipulations such as flipping the images, random noise addition, and slight image shift. Finally, flipping offered the models to identify activities in either direction and noise enabled the models to be more resilient to small errors such as blur or grainy images. Swapping the images around allowed the models to still detect activities even if the student wasn’t in the image’s center. They helped in the generation of an even more realistic image data set that will help the models being built.
ResNet50 from Scratch
In this model, training was done by loading the ResNet50 model from scratch and with no transfer learning allowed. However, despite ResNet50's intricate design and its ability to learn complicated features, the inadequate performance in this experiment stemmed from training the network from the ground up on the dataset. The model got an accuracy of 53.81% and the validation accuracy was 58.02% for the same. Similarly, this indicates that during the training phase, the model was able to effectively extract features from the provided dataset. However, it did not utilize prior information from a feature database as extensive as ImageNet to minimize the risk of overfitting and improve generalization to new data.
VGG16 with Fine-Tuning
The VGG16 model is another convolutional neural network architecture frequently used for image classification purposes today. Our approach involves re-training the VGG16 model by rendering certain layers 'unfrozen' for our training dataset. Nevertheless, the identified model failed to cope with the great difficulty of the student activity classification. The VGG16 scored an accuracy of 24.49% and a validation accuracy of 24.16% showing it could not learn the many subtleties in our dataset, primarily due to its relative simplicity in comparison with other contemporary structures.
VGG19 with Fine-Tuning
We fine-tuned a pre-trained VGG19 model for six-class image classification by removing the top classification layer and adding a global average pooling layer, dropout layers for regularization, a fully connected layer with 256 units, and a SoftMax layer for classification. The last 10 layers of the VGG19 base model were trainable, while the earlier layers were frozen to retain features learned from ImageNet. The model was compiled using the Adam optimizer and sparse categorical cross-entropy loss. Despite training for 10 epochs, both the training and validation accuracy remained stagnant at around 24%, with minimal improvement in a loss. This suggests that the model was not learning effectively from the data, indicating potential issues such as insufficient data, overfitting, or the need for better tuning of the model’s architecture and hyperparameters to enhance performance.
Mobile Net with Fine Tuning
It has a relatively low model size, which makes it suitable for work that doesn’t require a lot of calculation power. The Mobile Net was modified and adjusted to the dataset of students’ activities during examinations. The authors reported that, in the case of the proposed model, the accuracy within the training set was up to 86.93%, and the accuracy within the test, or the validation accuracy was up to 66.31% compared to the VGG16 model. While Mobile Net had better performance than deeper architectures such as ResNet50, it did not display a great generalization; it is well suited to real-time or low-memory use.
ResNet50 with Fine Tuning
Res Net 50 with Fine-tuning was the most successful model in our study. Therefore, by using the pre-trained weights from the ImageNet dataset and using only the last stage and selected layers it is easier to make use of this powerful architecture for our dataset. In general, due to the deep layers and skip connections of Res Net50 it was possible to identify some patterns concerning students and their interactions. This model resulted in an accuracy of 98.26% and validation accuracy of 91.71% therefore making it the best-performing model of the whole study. Furthermore, to validate the efficacy of this proposed model, the corresponding k-fold cross-validation was carried out with different partitions of the same dataset. Compared to the original ResNet50 model, this fine-tuned ResNet50 model has an accuracy rate of 98% which fulfills our task of classification of student activities very effectively and hence is more suitable for our model. ResNet50 based classification chart is shown in Figure 6.
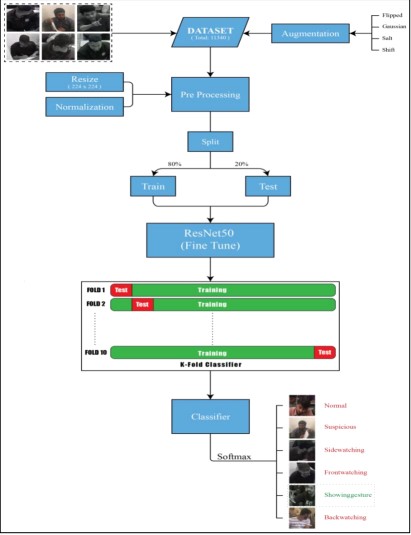
Figure 6. ResNet50-based image classification flowchart.
Evaluation Metrics
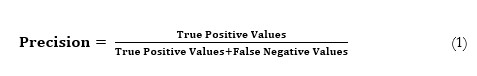
Precision, recall, and accuracy are given as equation 1 to equation 3 [30][35][36].


Results and Discussion
Experiment Setup
The experiments were conducted on a high-performance setup with the following specifications:
• CPU
AMD RYZEN 9 5900X
• GPU
NVIDIA GEFORCE RTX 4080 SUPER 16G
• VENTUS
3X OC
• Memory
32 GB RAM
Res Net 50 with Scratch
To implement our proposed strategy, ResNet50 was trained from scratch without utilizing any pre-trained weights. This indicates that the model was created without prior familiarity with the dataset, necessitating that it acquires all information during the training process. We specified weights=None when creating the ResNet50 architecture to enable the model to learn features intrinsic to the dataset utilized in the current experiment. We Utilized the base model ResNet50 the GlobalAveragePooling2D layer was added to reduce the dimension of the feature vector, and two Dropout layers with a dropout rate of 0.5 to reduce overfitting. A fully connected layer with 256 neurons in the middle and ReLU non-linearity was used before a Dense layer with the final classification layer in the form of a SoftMax layer for multi-class output. In particular, the values of alpha = 0.01 and a momentum of 0.9 enable the convergence rates to be reached without overfitting the model.
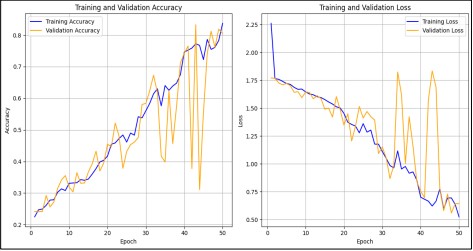
Figure 7. Training and validation accuracy and loss over 50 epochs
In this study, we presented the training and validation performance of the ResNet50 model that was trained from scratch. Figure 7 gives the training and validation loss of the model focusing on epoch 50, which shows big improvements in the training but not in the validation. This indicated that the validation accuracy was not a straight line, reflecting that the model experienced fluctuations in training and generalization, particularly when implementing deep learning from scratch. Specifically, the training loss plot showed a decreasing trend, further corroborating that the model learned effectively during the training phase. However, the validation accuracy exhibited some inconsistencies, suggesting that the model may have been overfitted or that its generalization process was unstable. However, figure 7 indicated that the model improved with an increased number of epochs. Nevertheless, there may be a need for modifications or the addition of regularization layers to reduce the fluctuations in the validation curves.
Res Net 50 with Fine Tuning
The final and most preferred approach according to the proposed methodology in this project is the Res Net 50 with fine-tuning. It applies Res Net 50; it is trained in ImageNet and then fine-tuned on the six-class demands found within this classification system. It also helps us benefit from the pre-trained ResNet50 network and for the model to learn some specific paternities within the given data set.
For fine-tuning, the last layers of the pre-trained Res Net 50 model were pruned and the replacement of zeroing out (POW) was implemented in the Rwanto. Subsequently, we deducted the mean value of the feature map utilizing the 'GlobalAveragePooling2D' layer, followed by the use of two dropout layers to reduce interference After that, we included the output layer, which consisted of a Dense layer with 256 neurons and a ReLU activation function. The final classification layer was created with six output nodes which used the SoftMax activation to correspond to our particular task to facilitate the model training, the author unfroze the last 100 layers of the Res Net 50 base and enabled them to learn while the author froze all the other layers to retain the weights learned from ImageNet. Using the created dataset, the Adam optimizer was implemented, and then the model through several epochs. This fine-tuning approach enables us to utilize not only the more general feature representations that are learned by ImageNet but also the features arising from our dataset and not from other datasets.
Similar to the training loss, the validation loss illustrated by Figure 8, the red curve is also low and fluctuates across the epoch but jumps slightly in the 4th epoch and then reduces. Such behavior indicates that while the model may well generalize it is probably overfitting or there is a variance problem at work. However, since the training and validation loss had decreased, the model was well-fitting to the training data and effectively generalizing to the validation dataset.
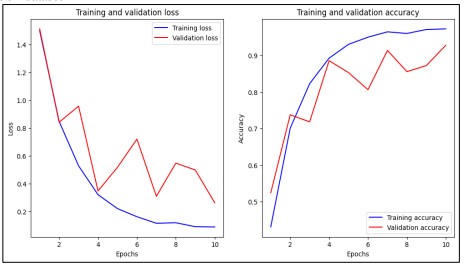
Figure 8. Training and validation accuracy and loss over 10 epochs
In addition, the accuracy curves represented on the right top corner confirm the work of the model with the highest value for the same iteration being 0.74. The fitting accuracy which is the accuracy obtained from the training data as demonstrated shown in Figure 8 blue curve commences from the lowest area in gaging to show that the classifier is slowly but gradually improving in the recognition of the training data set. In the 10 epoch the number one in the training accuracy is approximately one, indicating that it almost gets it right every time as observed by the low training loss. The validation accuracy, shown by the red curve, also increases over time but exhibits similar fluctuations as seen in the validation loss. These fluctuations, while not uncommon, suggest that the model might be slightly overfitting or that the validation data presents more challenging cases. Despite these fluctuations, the validation accuracy reaches a high level, indicating that the model generalizes well, although it does not surpass the training accuracy, which is typical and expected.
Confusion Matrix
The confusion matrix shows the model's classification across six behaviors (Figure 9): back watching, front watching, normal, showing gestures, side watching, and suspicious watching. The model performs well for back watching with 2,011 correct predictions and minor misclassifications, mainly into side watching (15). Front watching is also accurate with 1,384 correct predictions, though it occasionally confuses it with normal (11) and showing gestures (15). For normal behavior, 2,655 instances were correctly classified, but some were misclassified as back-watching (48) and side-watching (44). Showing gestures had 1,550 correct predictions, with some confusion about back-watching (23) and front-watching (14). Side watching had 1,806 correct predictions, with the most confusion in back watching (58). Suspicious watching was correctly predicted 1,488 times, though some cases were confused with normal (30) and side watching (15). Overall, the model performs well but struggles with similar behaviors like front watching and showing gestures or normal and side watching.
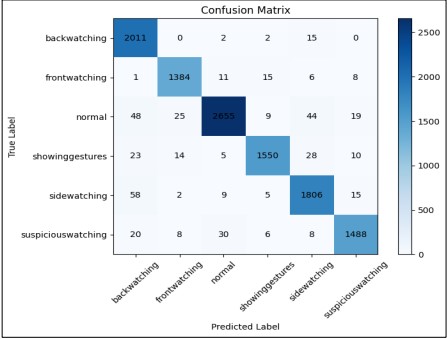
Figure 9. Confusion Matrix
The classification report shows that the model performs well across six behavior categories, with precision, recall, and F1-scores generally around 0.95 or higher. Back-watching has a precision of 0.93 and a recall of 0.99, leading to an F1 score of 0.96. Front watching, normal, showing gestures, side watching, and suspicious activity all show balanced precision and recall, with F1 scores ranging from 0.95 to 0.97./’nn 4. Overall, the model has a high accuracy of 96%, and both the macro and weighted averages for precision, recall, and F1-score are 0.96, indicating consistent performance across all categories with minimal misclassifications (Table 4).
Table 4. Evaluation Matrix
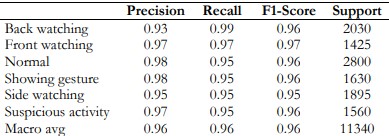
Regarding the assessment regarding the generalization of the performance of the model, this was done by saying that the scale of accuracy reached as high as 0.96 indicating that the model mainly concerns the possibility of classifying items in the data set with a probability of up to 96%. This high accuracy, combined with consistently high precision, recall, and F1 scores across all classes, reflects the model’s excellent performance in identifying different behaviors.
Discussion
Given the considerable size of the dataset, comprising 2,268 original images and 11,340 augmented images (Table 5 refers), we chose to employ deep learning techniques rather than traditional machine learning methods for the cheating detection system. Deep learning is particularly advantageous when working large volumes of data, as it can automatically learn hierarchical features from raw images. This capability is essential for accurately identifying complex patterns related to potential cheating behaviors. Traditional machine learning approaches often rely on manual feature extraction, a process that is not only time-consuming but may also overlook the intricate nuances inherent in visual data. In contrast, deep learning algorithms, especially convolutional neural networks (CNNs), can analyze images holistically, learning to recognize features at various levels of abstraction. This enhanced capability allows for improved accuracy and robustness in detecting diverse cheating scenarios, thereby contributing to a more reliable assessment of student activities during examinations.
Table 5. Summary of all models

Res Net (Scratch), Achieved moderate performance with 53.81% training accuracy and 58.02% validation accuracy, but relatively high loss values indicate room for improvement. Res Net (Fine Tune), Delivered excellent results with 98.26% training accuracy and 91.71% validation accuracy, benefiting greatly from fine-tuning with significantly lower loss values. VGG 16, Struggled with low training and validation accuracies of around 24%, and had the highest loss values, indicating poor performance on the task. VGG-19 struggled with training and validation accuracy, achieving only 24.38% on training accuracy and 24.16% on validation accuracy. This poor performance was coupled with the highest loss values among the tested models, indicating significant difficulties in learning from the data. The high loss values (1.768 for training loss and 1.7703 for validation loss) suggest that the model was not well-suited for this particular task, perhaps due to the complexity of the architecture or insufficient fine-tuning Mobile Net (finetune), Showed strong performance with 86.93% training accuracy and 66.31% validation accuracy, though it experienced some overfitting with higher validation loss.
We employed two variations of the ResNet50 model to evaluate the effectiveness of different training strategies. For the first variation, where ResNet50 was trained from scratch, we utilized a maximum of 50 epochs. This extensive training duration was necessary to ensure the model could effectively learn the complex patterns and features from the dataset, as it did not have any pre-learned weights. In contrast, for the second variation, where we fine-tuned a pre-trained ResNet50 model, we limited the training to 10 epochs. The lower number of epochs was sufficient to refine the pre-existing weights and adapt the model to our specific dataset, demonstrating the efficiency of the fine-tuning process in achieving a competitive performance with fewer epochs.
The (ROC) curve is a graphical representation that illustrates the trade-off between the true positive rate (sensitivity) and the false positive rate (1-specificity) across various threshold settings for each class in a multi-class classification problem. In our proposed fine-tuned ResNet50 model, the ROC curve is used to evaluate the wellness of the model can differentiate each class from all others. Figure 10 shows, that each colored line corresponds to a specific class in the dataset. These curves are clustered closely near the top-left corner of the graph, which is a strong indicator that the model maintains a high true positive rate while keeping the false positive rate very low for each class. If the ROC curves are close to the starting point (0, 0) it implies that in the process of using the model maximum percentage of instances will be classified correctly even if the model tends to classify the instances in the wrong class, it will not be too much off by classifying the other class.
Furthermore, the diagonal dashed line indicates the performance of the random classifier, where the true positive rate is equal to the false positive rate, which means a model or algorithm is simply choosing its predictions randomly. On the other hand, all the ROC curves concerning all the six classes are at a higher tier above this particular line highlighting the fact that our particular model is a better classifier compared to a random classifier. Thus, the values of both classes are 1.00, which describes the successful classification of the training data.
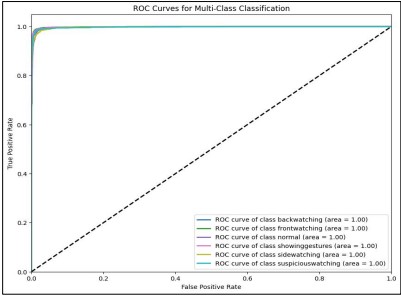
Figure 10. ROC Curve
The AUC scores (Figure 11) are quite high and ROC diagrams are drawn near to the point of (0 1) proving that the fine-tuned ResNet50 model is quite efficient for multi-class classification problems. This is rather spectacular and demonstrates how the given model can learn features within a dataset and make intelligent predictions in performance. The fact that each class is separable from all of the others by the model points to very high potential for real-world application where accuracy and precision are paramount, especially where categorizing behaviors or activities by groups of two or three actions may be as small as ‘back watching’ and ‘suspicious watching.’ Unknown Highly accurate fine-tuned model’s performance in all classes again proves that the choice of this model for complex classification tasks is appropriate. Furthermore, the AUC value displayed in the legend is 1.00 for each class which means it classifies perfectly. This is referred to as Area Under the receiver operating characteristics curve or simply, the AUC where the value of AUC will be 1.00 if the curve has smooth touching with y=1,000 axis suggesting that the model building has the capability to assign response for any test instance such that if the true positive values are plotted against true negative values. The second set of graphs provides the ROC (Receiver Operating Characteristic) curves to have a closer look at each class in multi-class classification models, which shows the performance of each class in detail. The six sub-plots represent the true positive rates of each class at different decision thresholds. These ROC curves are virtually binary and ideally situated at the top left of their own plots, suggesting that the model achieves a high true positive rate with the low false positive rate for every class.
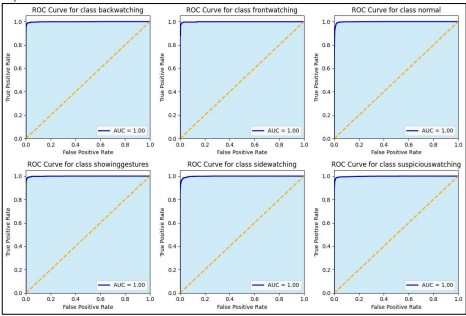
Figure 11. AUC Curve
The (AUC) value appearing in each subplot is also high, which is 1.00 for all classes. This AUC value equals 1, which means that the cross point of the graphs for the positive and the negative instances of the selected class variable can be made without any mistake by the model. That most of the points lie close to 1 for nearly 0, train and test models reveal that the ROC curves show high efficiency where most points are correctly categorized (high sensitivity or true positive rates) with few false positive points or wrongly categorized instances. The individual graphs provided herein, in sum, show that the model offers very high accuracy for each specific class of samples. The model holds great potential and performs consistently excellent AUC of 1.00 throughout the various classes which can be advantageous especially if the high accuracy of the class is of paramount importance.
AUC-ROC is also known as the Area under the receiver operating characteristics in the curve that is more widely used in measuring the performance of binary classification models. The ROC curve is also another kind of assessment tool it shows the TPR against FPR depending on thresholds. The AUC therefore gives an integrated measure of how well the model performs on the whole discriminant power continuum of an entire ROC curve. AUC is bounded to [0, 1] where the higher the AUC, the better the model, and the model has good discriminant space for the given positive and negative classes. An AUC of 0.5 despite having been rounded up to the nearest whole number means there is no capability for discriminating at all meaning that the model is as good as a random guess. This is particularly beneficial especially while assessing the model discrimination because the AUC is a threshold invariant measure, which therefore provides a better perspective about the performance of the model.
K-Ford Validation
In our case, we used K-fold cross-validation meaning the value of K is equal to 10. This indicates that the data was divided into ten parts each of which was of equal size as with the other part; the training and the validation were carried out for ten cycles. In each of the iterations, about nine folds were employed for training the model while one-fold was used in validating the model. This was done to ensure that every fold was used once as the validation set in the cross-validation process. Cross-validation of degree 10 was used to perform proper testing of the model on unseen data, separately for each of the ten folds and then averaging the results, which gives a good indication of how well a model is likely to do.
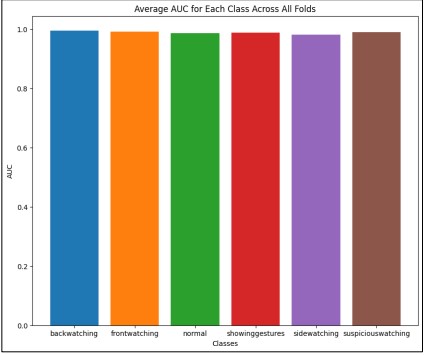
Figure 12. Average AUC for each class across all folds
Figure 12 indicates that the model performs exceptionally well in distinguishing between the different classes. An AUC of 1.0 represents perfect classification, meaning that the model can completely distinguish between the positive and negative instances of a class without any errors. The slight variations observed in some classes, with AUC values just under 1.0, suggest a minor decrease in the model's ability to perfectly classify those classes but still reflect very high performance.
The consistency across all classes suggests that the model is equally effective at identifying all types of student activities, making it a reliable tool for the classification task at hand. The high AUC values indicate that the model has a strong discriminative ability, making it highly effective for this multi-class classification problem.
Conclusion
This research work employs a pre-trained Convolutional Neural Network (CNN), ResNet50, which the work retrained for a six-class classification concerning the “Offline Cheating Detection System”. The model was trained on a modified CIFAR-100 dataset, which was divided into six custom classes: back watching; front watching; normal; showing gesture; side watching; and suspicious watching. On the data, some processing included resizing all images and then splitting the data set into training and validation. Concerning model structure, the layers that were employed are as follows the Global Average Pooling layer which is fully connected, three dropout layers in a bid to increase the rate of what is referred to as an over-fit situation, and lastly the SoftMax layer to predict the class. In aggregating the model, the chosen optimizer was Adam the loss used was sparse categorical cross entropy while the metric used was accuracy. This training was conducted in ten epochs The model was assessed using test accuracy and the confusion matrices. According to the given research, the model shows good results in categorizing the six intended behaviors of the CUI dataset. The outcomes derive and agree with the proposal of the transfer learning where the ResNet50 model is pre-trained for the classes in the “Offline Cheating Detection System” and fine-tuned for the classes that are in the method in identifying and recognizing different cheating actions. However, its improvement may be even further in the future with the help of other approaches, for example, data augmentation, or using another optimization algorithm instead of the Adam, let alone using another type of network architecture. Presumably, these improvements may further improve the accuracy and the generalization capability of the proposed model to actual scenarios for maximum usage in educational and exam monitoring systems.
Reference
[1] A. R. Baig and H. Jabeen, “Big Data Analytics for Behavior Monitoring of Students,” Procedia Comput. Sci., vol. 82, pp. 43–48, Jan. 2016, doi: 10.1016/J.PROCS.2016.04.007.
[2] F. Rodrigues and P. Oliveira, “A system for formative assessment and monitoring of students’ progress,” Comput. Educ., vol. 76, pp. 30–41, Jul. 2014, doi: 10.1016/J.COMPEDU.2014.03.001.
[3] J. Ramberg and B. Modin, “School effectiveness and student cheating: Do students’ grades and moral standards matter for this relationship?,” Soc. Psychol. Educ., vol. 22, no. 3, pp. 517–538, Jul. 2019, doi: 10.1007/S11218-019-09486-6/TABLES/3.
[4] T. Saba, A. Rehman, N. S. M. Jamail, S. L. Marie-Sainte, M. Raza, and M. Sharif, “Categorizing the Students’ Activities for Automated Exam Proctoring Using Proposed Deep L2-GraftNet CNN Network and ASO Based Feature Selection Approach,” IEEE Access, vol. 9, pp. 47639–47656, 2021, doi: 10.1109/ACCESS.2021.3068223.
[5] Z. A. von Jena, “The Cognitive Conditions Associated with Academic Dishonesty in University Students and Its Effect on Society,” UC Merced Undergrad. Res. J., vol. 12, no. 1, 2020, doi: 10.5070/M4121047260.
[6] M. Ghizlane, B. Hicham, and F. H. Reda, “A New Model of Automatic and Continuous Online Exam Monitoring,” Proc. - 2019 4th Int. Conf. Syst. Collab. Big Data, Internet Things Secur. SysCoBIoTS 2019, Dec. 2019, doi: 10.1109/SYSCOBIOTS48768.2019.9028027.
[7] I. Blau and Y. Eshet-Alkalai, “The ethical dissonance in digital and non-digital learning environments: Does technology promotes cheating among middle school students?,” Comput. Human Behav., vol. 73, pp. 629–637, Aug. 2017, doi: 10.1016/J.CHB.2017.03.074.
[8] A. Asrifan, A. Ghofur, and N. Azizah, “Cheating Behavior in EFL Classroom (A Case Study at Elementary School in Sidenreng Rappang Regency),” OKARA J. Bhs. dan Sastra, vol. 14, no. 2, pp. 279–297, Nov. 2020, doi: 10.19105/OJBS.V14I2.4009.
[9] P. M. Newton, “How Common Is Commercial Contract Cheating in Higher Education and Is It Increasing? A Systematic Review,” Front. Educ., vol. 3, p. 410255, Aug. 2018, doi: 10.3389/FEDUC.2018.00067/BIBTEX.
[10] “Bowers, W. J. (1964). Student Dishonesty and It’s Control in College. New York Columbia University Press. - References - Scientific Research Publishing.” Accessed: Oct. 12, 2024. [Online]. Available: https://www.scirp.org/reference/referencespapers?referenceid=1982497
[11] A. Bushway and W. R. Nash, “School Cheating Behavior,” Rev. Educ. Res., vol. 47, no. 4, pp. 623–632, Dec. 1977, doi: 10.3102/00346543047004623/ASSET/00346543047004623.FP.PNG_V03.
[12] D. F. Crown and M. S. Spiller, “Learning from the Literature on Collegiate Cheating: A Review of Empirical Research,” J. Bus. Ethics 1998 176, vol. 17, no. 6, pp. 683–700, 1998, doi: 10.1023/A:1017903001888.
[13] C. M. Ghanem and N. A. Mozahem, “A Study of Cheating Beliefs, Engagement, and Perception – The Case of Business and Engineering Students,” J. Acad. Ethics, vol. 17, no. 3, pp. 291–312, Sep. 2019, doi: 10.1007/S10805-019-9325-X/TABLES/7.
[14] S. W. Tabsh, H. A. El Kadi, and A. S. Abdelfatah, “Faculty perception of engineering student cheating and effective measures to curb it,” IEEE Glob. Eng. Educ. Conf. EDUCON, vol. April-2019, pp. 806–810, Apr. 2019, doi: 10.1109/EDUCON.2019.8725199.
[15] S. Dendir and R. S. Maxwell, “Cheating in online courses: Evidence from online proctoring,” Comput. Hum. Behav. Reports, vol. 2, p. 100033, Aug. 2020, doi: 10.1016/J.CHBR.2020.100033.
[16] J. Farmer, G. D. Lachter, J. J. Blaustein, and B. K. Cole, “THE ROLE OF PROCTORING IN PERSONAUZED INSTRUCTION1,” J. Appl. Behav. Anal., vol. 5, no. 4, pp. 401–404, Dec. 1972, doi: 10.1901/JABA.1972.5-401.
[17] W. A. Rosen and M. E. Carr, “An autonomous articulating desktop robot for proctoring remote online examinations,” Proc. - Front. Educ. Conf. FIE, pp. 1935–1939, 2013, doi: 10.1109/FIE.2013.6685172.
[18] Z. Zhang, M. Zhang, Y. Chang, S. K. Esche, and C. Chassapis, “A Virtual laboratory system with biometric authentication and remote proctoring based on facial recognition,” Comput. Educ. J., vol. 16, no. 4, pp. 74–84, 2016, doi: 10.18260/P.26481.
[19] Y. Atoum, L. Chen, A. X. Liu, S. D. H. Hsu, and X. Liu, “Automated Online Exam Proctoring,” IEEE Trans. Multimed., vol. 19, no. 7, pp. 1609–1624, Jul. 2017, doi: 10.1109/TMM.2017.2656064.
[20] H. S. G. Asep and Y. Bandung, “A Design of Continuous User Verification for Online Exam Proctoring on M-Learning,” Proc. Int. Conf. Electr. Eng. Informatics, vol. 2019-July, pp. 284–289, Jul. 2019, doi: 10.1109/ICEEI47359.2019.8988786.
[21] “Examination Cheating Behavior Detection Method and System Under Standard Examination Room Environment | Unified Patents.” Accessed: Oct. 12, 2024. [Online]. Available: https://portal.unifiedpatents.com/patents/patent/CN-112036299-A
[22] H. S. Fang, S. Xie, Y. W. Tai, and C. Lu, “RMPE: Regional Multi-person Pose Estimation,” Proc. IEEE Int. Conf. Comput. Vis., vol. 2017-October, pp. 2353–2362, Dec. 2017, doi: 10.1109/ICCV.2017.256.
[23] D. M. Tsai and S. C. Lai, “Independent component analysis-based background subtraction for indoor surveillance,” IEEE Trans. Image Process., vol. 18, no. 1, pp. 158–167, 2009, doi: 10.1109/TIP.2008.2007558.
[24] D. Osokin, “Real-time 2D Multi-Person Pose Estimation on CPU: Lightweight OpenPose,” Int. Conf. Pattern Recognit. Appl. Methods, vol. 1, pp. 744–748, 2019, doi: 10.5220/0007555407440748.
[25] W. Alsabhan, “Student Cheating Detection in Higher Education by Implementing Machine Learning and LSTM Techniques,” Sensors 2023, Vol. 23, Page 4149, vol. 23, no. 8, p. 4149, Apr. 2023, doi: 10.3390/S23084149.
[26] T. Liu, “AI proctoring for offline examinations with 2-Longitudinal-Stream Convolutional Neural Networks,” Comput. Educ. Artif. Intell., vol. 4, p. 100115, Jan. 2023, doi: 10.1016/J.CAEAI.2022.100115.
[27] F. Hussein, A. Al-Ahmad, S. El-Salhi, E. Alshdaifat, and M. Al-Hami, “Advances in Contextual Action Recognition: Automatic Cheating Detection Using Machine Learning Techniques,” Data 2022, Vol. 7, Page 122, vol. 7, no. 9, p. 122, Aug. 2022, doi: 10.3390/DATA7090122.
[28] M. D. Genemo, “Suspicious activity recognition for monitoring cheating in exams,” Proc. Indian Natl. Sci. Acad., vol. 88, no. 1, pp. 1–10, Mar. 2022, doi: 10.1007/S43538-022-00069-2/TABLES/3.
[29] F. Mahmood et al., “Implementation of an Intelligent Exam Supervision System Using Deep Learning Algorithms,” Sensors 2022, Vol. 22, Page 6389, vol. 22, no. 17, p. 6389, Aug. 2022, doi: 10.3390/S22176389.
[30] N. J. H. Catalin Voss, “Systems and methods for detection of behavior correlated with outside distractions in examinations”, [Online]. Available: https://patents.google.com/patent/US9892315B2/en
[31] R. Poppe, “A survey on vision-based human action recognition,” Image Vis. Comput., vol. 28, no. 6, pp. 976–990, Jun. 2010, doi: 10.1016/J.IMAVIS.2009.11.014.
[32] G. Yao, T. Lei, and J. Zhong, “A review of Convolutional-Neural-Network-based action recognition,” Pattern Recognit. Lett., vol. 118, pp. 14–22, Feb. 2019, doi: 10.1016/J.PATREC.2018.05.018.
[33] O. Masoud and N. Papanikolopoulos, “A method for human action recognition,” Image Vis. Comput., vol. 21, no. 8, pp. 729–743, Aug. 2003, doi: 10.1016/S0262-8856(03)00068-4.
[34] S. Sharma, R. Kiros, and R. Salakhutdinov, “Action Recognition using Visual Attention,” Nov. 2015, Accessed: Oct. 12, 2024. [Online]. Available: https://arxiv.org/abs/1511.04119v3
[35] N. van Halem, C. van Klaveren, and I. Cornelisz, “The effects of implementation barriers in virtually proctored examination: A randomised field experiment in Dutch higher education,” High. Educ. Q., vol. 75, no. 2, pp. 333–347, Apr. 2021, doi: 10.1111/HEQU.12275.
[36] “Behavioral detection of cheating in online examination.” Accessed: Oct. 12, 2024. [Online]. Available: https://pdfcoffee.com/cheating-in-online-exam-pdf-free.html
