Prevalent unhealthy eating habits and sedentary lifestyles have substantially detrimental effects on public health in contemporary culture. Low levels of physical activity combined with diets heavy in fats, sweets, and processed foods can lead to a variety of gastrointestinal illnesses. One notable consequence of these contemporary lifestyles is the rise in gastroesophageal reflux disease (GERD), a condition in which stomach acid commonly backs up into the esophagus. Barrett's esophagus, an abnormal change in the esophageal lining's cells, may eventually arise from GERD-induced chronic inflammation of the esophageal lining [1].
Barrett’s Esophagus is characterized by intestinal metaplasia, where normal esophageal epithelial cells are replaced by cells resembling those found in the intestines. This illness raises the possibility of esophageal cancer, a type of cancer with a very dismal prognosis. In Figure 1 [2], the expected global incidence of esophageal cancer in 2020, 2030, and 2040 is presented in (a), as well as the expected esophageal cancer mortality in 2020, 2030, and 2040 presented in (b). The data also points to the growing incidence of esophageal cancer that is expected to be witnessed in the future decades. Chest pain, involuntary weight loss, and dysphagia on a regular basis are suggestive of esophageal cancer. Esophageal cancer is often diagnosed at an advanced and incurable stage, primarily because it tends to be asymptomatic in its early phases.
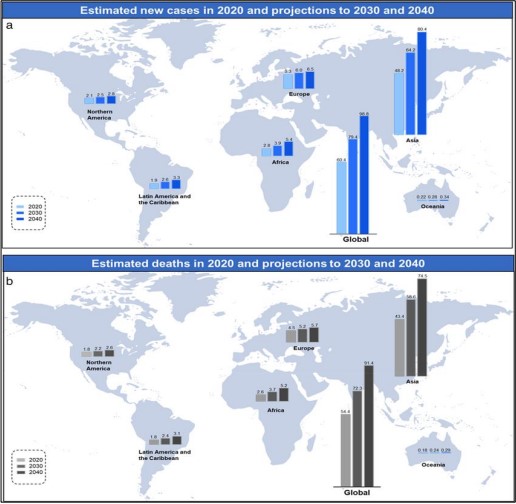
Figure 1. Estimated new cases (a) and deaths (b) of esophageal cancer worldwide in 2020, with projections for 2030 and 2040.
The prevalence of Barrett's esophagus and GERD is rising, which has led to a consistent rise in the incidence of esophageal cancer. Despite advancements in medical care and diagnostic methods, a significant challenge remains early detection. Current diagnostic methods, such as endoscopy, are invasive and largely depend on subjective image interpretation, which can result in inconsistent outcomes and the potential overlooking of cases that could have been detected earlier.
Our proposed methodology utilizes deep learning to address these issues. By automating the classification of endoscopic pictures into four unique categories—squamous, intestinal, gastric metaplasia, and dysplasia—the goal is to improve the accuracy and efficacy of esophageal cancer detection. This strategy aims to reduce the mortality rate from esophageal cancer by rectifying the deficiencies of traditional diagnostic methods and improving early detection. Images obtained are classic macroscopic images. Cell Vizio was used to get a more accurate view, at a microscopic level as shown in Figure 2 [3].
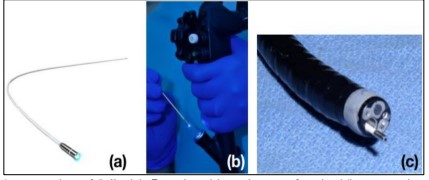
Figure 2. Integration of Cell Vizio® Probe with Endoscope for Live Tissue Imaging. (a) Cell Vizio® probe. (b) Insertion of the probe into the endoscope’s channel. (c) Probe positioned for imaging live tissue.
Recalling vital clinical information during a screening procedure can be difficult due to the rapid alteration of Cell Vizio pictures and the simultaneous management of extensive data by physicians. Developing an image classifier to help doctors detect and diagnose esophageal cancer is the aim of this project. Such a technology would greatly enhance patient care and well-being. The following classes are suggested to be recognized: - Dysplasia/Cancer - Intestinal Metaplasia - Gastric Metaplasia - Squamous Epithelium. In general, the manuscript is arranged as follows:
The introduction section provides an overview of the problem statement, literature review, and recent advancements. The dataset that provides the mapping and data statistics is found in Section II followed by the overall methodology. Section III outlines the results and discussion, including performance metrics and model comparisons, along with an analysis of training convergence and ROC curves. The manuscript concludes with a comprehensive discussion in the final section, summarizing the findings and implications, followed by the references.
Objective
In this research, the main goal is to build and test a deep learning model that may assist in early cancer detection through the classification of esophageal tissue types from Cell Vizio images. The work presented here supersedes other approaches by making use of high-speed imaging combined with actual classification in real-time. This approach overcomes the flaws of conventional diagnosis techniques, including image interpretation processes, which might be subjective, as well as the already delayed detection of diseases.
Literature Review
In previous studies focused on esophageal cancer classification, Kentaro Nakagawa et al. [4] described the development and outcomes of an artificial intelligence (AI) system designed to predict the invasion depth of superficial esophageal squamous cell carcinoma (SCC). The system employed a deep learning framework known as Single Shot Multi-Box Detector, which enables efficient object detection and classification in medical images. This approach aimed to improve accuracy in assessing the cancer’s progression, contributing to earlier and more precise diagnosis. The system trained and validated on 914 endoscopic images of 155 patients, using the dataset of 8660 non-magnified and 5678 magnified endoscopic images of 804 patients. The AI system exhibited a sensitivity of 90.1%, specificity of 95.8%, and accuracy of 91.0% in differentiating SM1 stage mucosal/submucosal micro-invasive cancer from SM2/3 deep invasive malignancies. The AI achieved a performance level nearly equivalent to that of 16 seasoned endoscopists, thus potentially aiding in the evaluation of esophageal SCC invasion depth. Gaoshuang Liu et al. [5] applied CNN classification of esophageal cancer (EC) and differentiated it from premalignant lesions.
Table 1. Summary of datasets, methodologies, and evaluation metrics in assistive technology research
.jpg)
The model was trained using a dataset of 1,272 images and demonstrated a strong performance, achieving an accuracy of 85.83%, a sensitivity of 94.23%, and a specificity of 94.67%. It outperformed traditional methods like LBP + SVM and HOG + SVM, showing potential to assist endoscopists in identifying esophageal lesions more effectively. Esophageal Lesion Network (EL Net) was introduced by Zhan Wu et al. [6] that automatically classifies and segments esophageal lesions using DCNN–a type of neural network. EL Net integrates both local and global lesion information for classification and pixel-level segmentation tasks. Utilizing a large-scale database of 1,051 white-light endoscopic images and applying ten-fold cross-validation, EL Net achieved a classification accuracy of 96.28%, with a sensitivity of 90.34% and a specificity of 97.18%. With 80.18% sensitivity and 96.55% specificity, it proved to be 94.62% accurate in segmenting data. According to these findings, EL Net can diagnose esophageal lesions in clinical settings with efficiency, accuracy, and reliability. Wenju Du et al. [7] introduced a novel deep learning architecture called the Efficient Channel Attention Deep Dense Convolutional Neural Network. This model classifies endoscopic esophageal videos into four primary categories: normal esophagus, precancerous esophageal conditions, early esophageal cancer (EEC), and advanced esophageal cancer, further subdividing these into a total of seven distinct sub-categories. Proposing a classification that reached 90.63% with an AUC of approximately 0.9877 on a model that employed 20,965 images from 4077 patients, the model was able to outperform all the contemporary methods. The ECA-DDCNN performs significantly better when it comes to determining diseases that have similar mucosal features which bodes well for increasing the number of available diagnostic shots of varying esophageal diseases. Chempak Kumar et al. [8] explored the use of deep convolutional neural networks (DCNNs) for early-stage esophageal cancer classification, with a particular focus on esophagitis and Barrett's esophagus (BE), which can develop into esophageal adenocarcinoma (EAC). Through the incorporation of transfer learning, the performance of the ResNet50 model was significantly improved for the classification task. Achieving an accuracy of 94.46% and an AUC of 96.20%, the use of transfer learning and fine-tuning demonstrated superior results, highlighting its potential for early detection of esophageal cancer. Wenhua Huang et al. [9] classified tissues and cell lines of esophageal squamous cell carcinoma (ESCC) by combining machine learning and Raman spectroscopy. Using models including PCA-XGB and a stacked combination of PCA-LDA, XGB, and SVM, Wenhua Huang et al. were able to distinguish between different ESCC tissue types with up to 90.3% accuracy. This work highlights the potential of Raman spectroscopy as a noninvasive technique for early ESCC diagnosis, providing crucial molecular insights that could improve patient outcomes. Table 1 shows the comparison of the proposed methodology with existing literature.
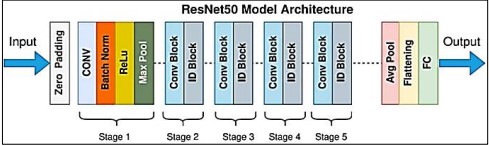
Figure 3. Res Net Architecture [10]
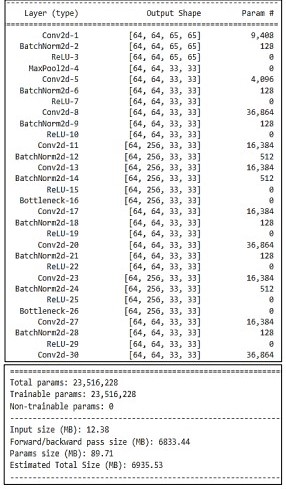
Resnet layer architecture used in the proposed methodology is given in Table 2.
Table 2. The detail with layers configurations of Res net50
Res Net Architecture
The vanishing gradient issue addressed by Res Net, or Residual Networks shown in Figure 3 [10], uses residual connections to improve gradient flow during training. Res Net's architecture made it possible to learn complicated features efficiently, which enhanced the accuracy and resilience of the model.
CNN Model Architecture
The torch. nn. Module in Py Torch was used to build the CNN model, which has the following layers:
• Convolutional Layers
Employing CNNs, several convolutional layers were applied to the medical images to capture their spatial content. These layers were created to capture the minute features required to discern between malignant and non-malignant tissues.
• Normalization
To speed up and stabilize the training process, batchNorm2d layers were added to normalize the activations of the convolutional layers.
• Dropout
To avoid overfitting, some input units are arbitrarily set to zero during training. We call this method "dropout layering."
• Fully Connected Layers
The last convolutional layer's output was flattened and then routed to fully connected (Linear) layers for classification. The last layer produced a probability distribution over the cancer classes.
• Activation Functions
BatchNorm2d layers were added to normalize the activations of the convolutional layers and speed up and stabilize the training process.
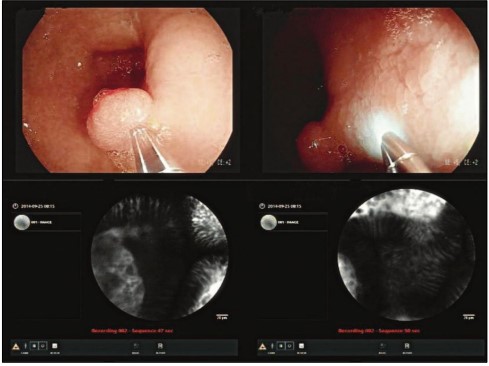
Figure 4. Once the Cell Vizio probe is in place, physicians can see both the macroscopic images (above), where the Cell Vizio probe appears, and the microscopic images (below).
Dataset
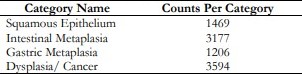
This is a challenging dataset based on Mauna Kea Technologies [2]. During an endoscopy, a camera is inserted into the patient's esophagus. The Cell Vizio probe enters the endoscope's operating channel and travels to the esophagus-stomach junction. The real-time microscopic images can help doctors make critical treatment decisions shown in Figure 4. The dataset consists of 11,161 microscopic images from 61 patients. Among these images, 1,469 belong to class 0 ("Squamous Epithelium"), 3,177 belong to class 1 ("Intestinal Metaplasia"), 1,206 belong to class 2 ("Gastric Metaplasia"), and 3,594 belong to class 3 ("Dysplasia").
The following are the suggested classes that should be acknowledged shown in Figure 5. are:
• Squamous Epithelium
• Intestinal Metaplasia
• Gastric Metaplasia
• Cancer/DYSPLASIA
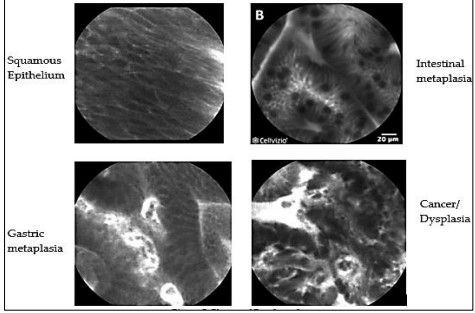
Figure 5. Classes of Esophageal Cancer
Each image is labeled with one of the classes:
• 0: “Squamous_Epithelium”
• 1: “Intestinal_metaplasia”
• 1: “Intestinal_metaplasia”
• 3: “Dysplasia/Cancer”
Distribution of data across classes is shown in Figure 6.
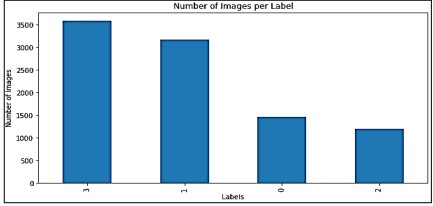
Figure 6. Number of Images per Class
Table 3 also shows the Total number of images of each class.
Table 3. Number of images per category
The two test sets and the training set are split 80%-10%-10% shown in Figure 7.
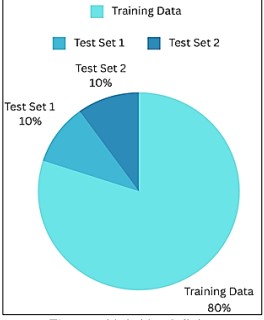
Figure 7. Train Test Splitting
Table 4 shows the total number of images based on the training set and test set with respect to the patient.
Table 4. Number of images and patients per training and testing sets
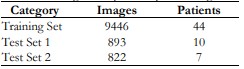
Proposed Methodology
This section outlines our proposed methodology for classifying esophageal cancer using deep learning-based CNN Architectures as shown in Figure 8.
Pre-Processing
The pixel intensity values in medical images may be different from each other due to differences in scanners, scanning methods, or light used when obtaining the image. The following inconsistencies are solved through normalization in an attempt to balance the intensity distributions of these images: This enables better alignment in regard to the esophagus images and there is an ability to compare them well across different datasets. While, to overcome the overfitting problem we performed data augmentation.
• Normalization: Each channel's pictures were calibrated to have a 0 mean and 1 standard deviation. Standardization guarantees that the data is on the same scale, which is necessary for effective model training.
• To ensure all images fit the required ResNet50 input size we resized all images to 224 pixels by 224 pixels.
• Data Augmentation: Techniques like random rotations, flips (horizontal and vertical), and cropping are used to increase the dataset's diversity and avoid overfitting.
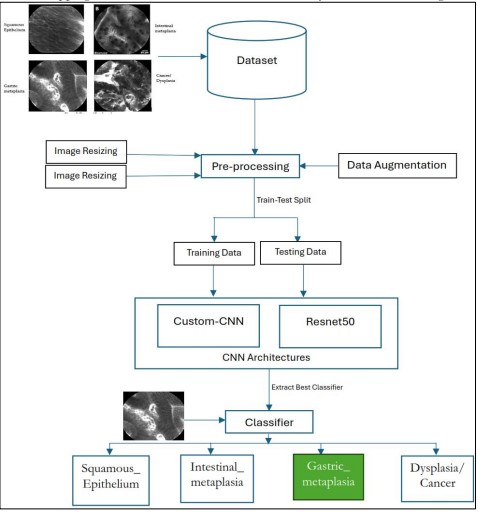
Figure 8. Proposed Methodology
Evaluation Metrics
After training, the model was evaluated on a separate validation set. The evaluation was conducted using the following performance metrics:
• Accuracy
The accuracy of the model is calculated as the ratio of correctly classified images out of the total number of images in the validation set.
• Confusion Matrix
A confusion matrix was created to assess the performance of the model across different classes of esophageal cancer, providing insights into which classes were most often misclassified.
Precision, Recall & F1-Score provide a balanced view of the performance of the model, especially the class imbalance that occurs in most of the medical image classification tasks.
• Precision
Refers to the ratio of true positives to the sum of the instances that are classified as positive by the model [11].
Precision = TP / (TP + FP)
• Recall
A performance statistic that compares all actual positive occurrences to the percentage of true positive instances that the model correctly predicts in binary classification [11].
Recall = TP / (TP + FN)
• F1-Score
A performance metric that gives a balanced assessment of the performance of a binary classification model by combining precision with recall [11].
F1-Score = 2 * (precision * recall) / (precision + recall)
Result and Discussion
The study optimized the use of Google Colab Pro, a cloud computing platform that supports GPU acceleration to hasten deep learning model training. Small-scale local experimentation and analysis were conducted on the authors’ own personal laptop with an 8th generation i5 CPU, 8 GB RAM, and 256 GB SSD storage. Primarily, approaches in machine learning were Convolutional Neural Networks (CNNs) and transfer learning through ResNet50. To make full use of time, training was conducted using multiple Colab Pro sessions throughout the project. We set epochs to 100 and employed an early-stopping approach. Early stopping strategy stopped the model training on 50 epochs when training started to be degraded on the validation set. While Batch size 64 was suitable for Resnet50 to speed up the training process
CNN Training Convergence
The Custom Convolutional Neural Network model’s training accuracy, validation accuracy, and loss when training for depicted in Figure 9. Here is a breakdown:
Cross Entropy Loss
The blue line (Train Loss) and green line (Val Loss) represent the loss during training and validation, respectively. Both lines decrease sharply initially and then plateau, indicating that the model is learning, and the error is reducing over time.
Accuracy
The orange dots (Train Accuracy) and purple dots (Val Accuracy) show the accuracy during training and validation. Both sets of dots increase and then level off, showing that the model’s predictions are becoming more accurate as training progresses.
Figure 9. Graph of Custom CNN Training Convergence
Training Iterations
The x-axis shows the number of training iterations, ranging from 0 to 50. As the iterations increase, both loss decreases and accuracy increases, which is typical in training machine learning models.
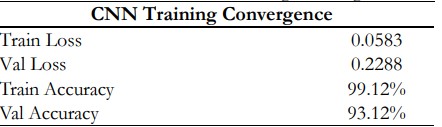
Table 5. displays the CNN's training and validation performance data. The training loss of 0.0583 indicates the model effectively minimizes error on the training data, while the validation loss of 0.2288 suggests the model generalizes well, with only a small gap between the two losses. The model's performance on the training set is remarkably good, as evidenced by the training accuracy of 99.12%, and the validation accuracy of 93.12% shows good predictive ability on unobserved data. Given the circumstances, the CNN attains high accuracy and low loss, demonstrating efficient learning with little overfitting.
Table 5. Custom CNN Training Convergence
Res Net 50 Training Convergence
The Figure 10. illustrates the training process of a Resnet50 model. Here’s a detailed explanation:
Cross Entropy Loss
The green line (Train Loss) and dark blue line (Val Loss) represent the loss during training and validation, respectively. Both lines decrease sharply initially and then plateau, indicating that the model is learning and the error is reducing over time.
Accuracy
The orange line (Train Accuracy) and blue line (Val Accuracy) show the accuracy during training and validation. Both lines increase and then level off, showing that the model’s predictions are becoming more accurate as training progresses.
Training Iterations
The x-axis shows the number of training iterations, ranging from 0 to approximately 40. As the iterations increase, both loss decreases and accuracy increases, which is typical in training machine learning models.
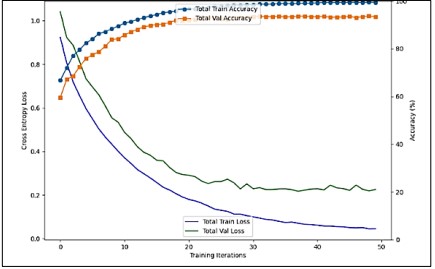
Figure 10. Graph of Performance Metrics of Custom CNN
Comparison of Confusion Matrix of Custom CNN and Res Net 50:
A confusion matrix of CNN and Resnet50 is shown in Figure 11 and Figure 12.
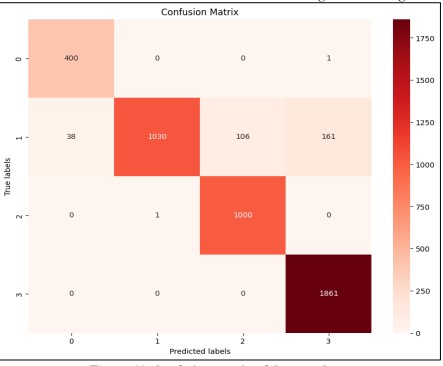
Figure 11. Confusion Matrix of Custom-CNN
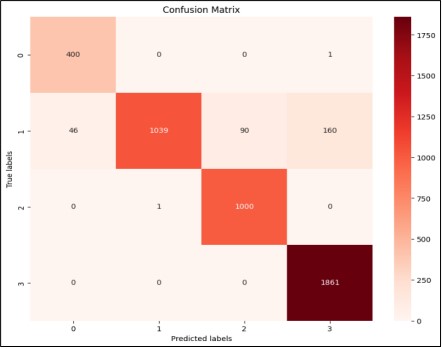
Figure 12. Confusion Matrix of Custom-CNN
The Table 6. displays the Resnet50 training and validation performance data. The performance metrics of the ResNet50 model reflect its effectiveness in classifying esophageal cancer images. A validation loss of 0.2252 suggests the model maintains a low error rate when predicting unseen data, indicating strong generalization. With a precision score of 0.9405, the model has few false positives, as evidenced by the 94.05% accuracy rate of the positive predictions it made. With a recall of 0.9352, the model successfully detected 93.52% of all positive events, indicating a low proportion of false negatives. The F1-score of 0.9326, balancing precision with recall, further strengthens the robustness of the model with regard to both precision and recall. When taken as a whole, these metrics show how dependable and accurate ResNet50 is in identifying the distinct types of esophageal cancer.
Table 6. Res Net 50 Performance Metrics
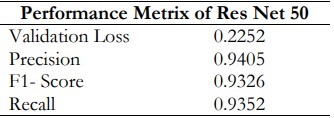
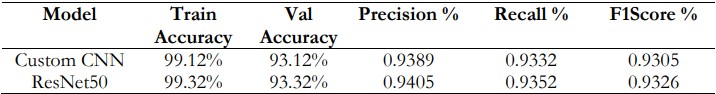
Table 7 compares the performance of Custom CNN and ResNet50 across key metrics. Both models showed high training accuracy (Custom CNN: 99.12%, ResNet50: 99.32%) and validation accuracy (Custom CNN: 93.12%, ResNet50: 93.32%), with ResNet50 performing slightly better. ResNet50 also had higher precision (0.9405 vs. 0.9389), indicating fewer false positives, and better recall (0.9352 vs. 0.9332), meaning it identified more true positives. The F1-score, which balances precision and recall, was superior for ResNet50 (0.9326 vs. 0.9305), indicating its enhanced overall classification performance compared to Custom CNN.
Table 7. Evaluation Metrics for Custom CNN and ResNet50
AUC-ROC Curve of all 4 Classes with Res Net 50
Better model performance is indicated by higher AUC values (closer to 1). In this case, Class 0, Class 2, and Class 3 have an AUC of 1.00, and Class 1 has an AUC of 0.99, indicating excellent performance. Figure 13 helps to visualize the performance of the classification model across different classes and thresholds.
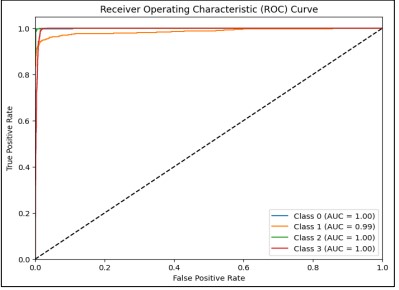
Figure 13. AUC-ROC Curve of all 4 Classes with ResNet50
The model shows exceptional performance in classifying all four classes, with minimal misclassification across the board. The ROC curve and AUC values provide strong evidence that the model generalizes well, indicating its reliability in distinguishing between the different esophageal cancer classes. The AUC-ROC Curve of each Class with ResNet50 is shown in Figure 14.

Figure 14. AUC-ROC Curve of each class with ResNet50 a) Class 0 ‘Squamous Epithelium’ b) Class 1 ‘Intestinal Metaplasia c) Class 2 ‘Gastric Metaplasia d) Class 3 ‘Dysplasia/ Cancer
Resnet and CNN architecture are outperformed in medical imaging. ResNet50 is a very deep model that needs residual connections to learn fine or complex details with images. On the other hand, the design of custom convolutional neural network models is optimized according to the provided data and the problem that must be solved. Moreover, due to the computational power limitation, we used only CNN and Resnet50, while in the future we will apply different CNN architectures to the Mauna Kea Technologies Challenge dataset. The experimental results obtained from the application of Convolutional Neural Networks (CNN) and ResNet50 for classifying esophageal cancer using Cell Vizio images provided significant insights into the effectiveness and potential of deep learning in medical diagnostics. The analysis demonstrated that both models achieved high-performance metrics, reflecting their capabilities in distinguishing between different classes of esophageal cancer. Both the custom CNN and ResNet50 models exhibited excellent performance, with validation accuracies of 93.12% and 93.32%, respectively. These results indicate that the models are adept at generalizing from the training data to unseen validation data. The marginal difference in performance between the models suggests that both approaches are viable, but the ResNet50 model, with its deeper architecture and residual connections, demonstrated superior capability in capturing complex patterns within the data.
Conclusion
With precision at 93.89%, recall at 93.32%, and an F1 score of 93.05%, the customized CNN model yielded an accuracy of 93.45%. Furthermore, the ResNet50 model demonstrated a 93.26% F1 score, a 94.05% precision, a 93.52% recall, and a 99.32% training accuracy and 93.32% validation accuracy. These findings demonstrate how deep learning methods can be used to improve patient outcomes and enhance early esophagus cancer detection. ResNet50 appears to be the better model based on its marginally higher F1 score, recall, and precision, all of which indicate a better balance in categorizing both true positives and negatives. Nonetheless, the near measures indicate that while both models perform admirably, ResNet50 performs a little better overall. To improve the resilience and applicability of the model, future studies ought to focus on expanding the dataset, examining different CNN architectures, and including additional clinical data.
Acknowledgement
We would like to express our sincere gratitude to our university. We would like to thank the Computer Science Department for providing the necessary resources and facilities for this research. We are indebted to Mauna Kea Technologies for providing the valuable challenged dataset used in this study.
Conflict of Interest: The authors declare no conflict of interest regarding the publication of this manuscript in IJIST.
Reference
[1] M. Khieu and S. Mukherjee, “Barrett Esophagus,” StatPearls, Sep. 2024, Accessed: Oct. 12, 2024. [Online]. Available: https://www.ncbi.nlm.nih.gov/books/NBK430979/
[2] C. Q. Liu et al., “Epidemiology of esophageal cancer in 2020 and projections to 2030 and 2040,” Thorac. Cancer, vol. 14, no. 1, pp. 3–11, Jan. 2023, doi: 10.1111/1759-7714.14745.
[3] “Cellvizio® Overview - Mauna Kea Technologies.” Accessed: Oct. 12, 2024. [Online]. Available: https://www.maunakeatech.com/cellvizio-overview/
[4] K. Nakagawa et al., “Classification for invasion depth of esophageal squamous cell carcinoma using a deep neural network compared with experienced endoscopists,” Gastrointest. Endosc., vol. 90, no. 3, pp. 407–414, Sep. 2019, doi: 10.1016/j.gie.2019.04.245.
[5] G. Liu et al., “Automatic classification of esophageal lesions in endoscopic images using a convolutional neural network,” Ann. Transl. Med., vol. 8, no. 7, pp. 486–486, Apr. 2020, doi: 10.21037/ATM.2020.03.24.
[6] Z. Wu et al., “ELNet:Automatic classification and segmentation for esophageal lesions using convolutional neural network,” Med. Image Anal., vol. 67, p. 101838, Jan. 2021, doi: 10.1016/J.MEDIA.2020.101838.
[7] W. Du et al., “Review on the Applications of Deep Learning in the Analysis of Gastrointestinal Endoscopy Images,” IEEE Access, vol. 7, pp. 142053–142069, 2019, doi: 10.1109/ACCESS.2019.2944676.
[8] A. Chempak Kumar and D. M. N. Mubarak, “Ensembled CNN with artificial bee colony optimization method for esophageal cancer stage classification using SVM classifier,” J. Xray. Sci. Technol., vol. 32, no. 1, pp. 31–51, Jan. 2024, doi: 10.3233/XST-230111.
[9] W. Huang et al., “Raman spectroscopy and machine learning for the classification of esophageal squamous carcinoma,” Spectrochim. Acta Part A Mol. Biomol. Spectrosc., vol. 281, p. 121654, Nov. 2022, doi: 10.1016/J.SAA.2022.121654.
[10] “Exploring ResNet50: An In-Depth Look at the Model Architecture and Code Implementation | by Nitish Kundu | Medium.” Accessed: Oct. 12, 2024. [Online]. Available: https://medium.com/@nitishkundu1993/exploring-resnet50-an-in-depth-look-at-the-model-architecture-and-code-implementation-d8d8fa67e46f
[11] “Evaluation Metrics for Classification | by Python Programmer | Medium.” Accessed: Oct. 12, 2024. [Online]. Available: https://medium.com/@mlmind/evaluation-metrics-for-classification-fc770511052d
