E-ISSN:2709-6130
P-ISSN:2618-1630

Research Article

International Journal of Innovations in Science & Technology

2023 Volume 5 Number 1 December-Janurary

Action Recognition of Human Skeletal Data Using CNN and LSTM

Asghar. Z.1*, Moin. S.2, Qutab. I.3, Aqeel. M .4
DOI: https://doi.org/10.33411/IJIST/2023050102

1* Zara Asghar , Department of Computer Science, University of Lahore.

2 Saira Moin , Department of Computer Science, University of Lahore.

3 Irfan Qutab, Department of Software Engineering, Northwestern Polytechnical University, Xi'an.

4* Muhammad Aqeel , Department of Software Engineering, Northwestern Polytechnical University, Xi'an.

Abstract
Human action recognition recognizes an action performed by human beings in order to witness the type of action being performed. A lot of technologies have been developed in order to perform this task like GRN, KNN, SVM, depth maps, and two-stream maps. We have used 3 different methods in our research first method is a 2D CNN model, the second method uses an LSTM model and the third method is a combination of CNN+LSTM. With the help of ReLu as an activation function for hidden and input layers. Softmax is an activation function for output training of a neural network. After performing some epochs the results of the recognition of activity are declared. Our dataset is WISDM which recognizes 6 activities e.g., Running, Walking, Sitting, Standing, Downstairs, and Upstairs. After the model is done training the accuracy and loss of recognition of action are described. We achieved to increase in the accuracy of our LSTM model by tuning the hyperparameter by 1.5%. The accuracy of recognition of action is now 98.5% with a decrease in a loss that is 0.09% on the LSTM model, the accuracy of 0.92% and loss of 0.24% is achieved on our 2D CNN model while the CNN+LSTM model gave us an accuracy of 0.90% with the loss of 0.46% that is a stupendous achievement in the path of recognizing actions of a human. Then we introduced autocorrelation for our models. After that, the features of our models and their correlations with each other are also introduced in our research.

Keywords: Action Recognition, Skeletal data, Convolutional Neural Network, Long Short Term Memory, Machine Learning.

Corresponding Author How to Cite this Article
Irfan Qutab , Department of Software Engineering, Northwestern Polytechnical University, Xi'an
Zara Asghar, Saira Moin, Irfan Qutab, Muhammad Aqeel, Action Recognition of Human Skeletal Data Using CNN and LSTM. IJIST. 2023 ;5(1):20-26 https://journal.50sea.com/index.php/IJIST/article/view/436

Introduction

Action recognition is one of the domains of computer sciences in which action performed by a person is identified with the help of many foremost techniques. In doing so many futuristic methods are coming one day after another and lots of development is happening in this field. For recognizing an action performed by individual different techniques and datasets are generated. Each dataset has some actions that ought to be recognized by the researcher. Different actions are fed into datasets using different approaches and every dataset is different from others having some differentiating attributes.

Different areas that focus on recognizing human action are launching some techniques in order to excel in this field. These areas include health care centers as these places have to monitor a patient’s activity for observing the current situation and diagnosis. Hospitals, schools, and colleges also use this system to observe the activities performed by students. The field of Human-Computer Interaction is also using human action recognition to intensify the current methods and improve them to build new technology. The most important part of action recognition is feature extraction which is difficult to extract [1]. Feature extraction is done by using many methods like global extraction [2]. To identify the activities of a player in a game ( football), this system is used very precisely to recognize how a player is moving and what sort of actions is he performing on the ground [3].

Computer vision is one of the branches of Artificial intelligence. In computer, vision computers interpret and understand the visual world by training. It analyses an image of a scene by extracting some information related to that scene. The classification and identification of the objects are done by using deep learning models, videos, and images from cameras.

Computer vision works from getting an image as an input to properly knowing which class it belongs to. The process of classifying and identifying an object is taken out step by step. With the steps, training of the deep learning model is also done and labels are fed into the model. All the data that we need is already fed into the model so that every object is properly distinguished. Object classification classifies the class to which the object belongs. Object Detection finds out all the objects shown in the picture and points them out. Instance segmentation discriminates all the objects present in the picture and represents them separately.

In general, this study is beneficial for the recognition of actions using different techniques and models of computer vision. We will take some actions and recognize them. Those factors are also analyzed which provide favorable for the recognition of action.

This section presents an introduction to action recognition and the present research. Related and existing work is discussed in Section 2. Several steps are involved in the construction of the model and they are described in Section 3. The model is tested on data, and the evaluation of the results is discussed in Section 4. Similarly to that, the conclusion and suggestions for further research have been provided at the end.

Related Work
Action recognition has captured the eyes of researchers for some time now. Besides having a lot of difficulties and challenges in this field, a lot of work has been done to achieve accuracy and better results. Different types of features are used in order to recognize the actions performed by a human. A lot of people have performed different tasks, we begin by reviewing existing literature on Skeleton Action Recognition.

Daily routine actions of a human are recognized by using depth images which are captured by depth cameras and because of color intensity variation, segment human silhouettes are used [4]. In the end, different activities are recognized using the recognizer engine. The datasets that were used are MSR depth images and self-annotated datasets. The results performed on these two datasets showed 88.9% accuracy on MSR datasets and 66.8% accuracy on self-annotated datasets.

As the availability of depth sensors is increasing, dynamic skeletons of the human body are much in talk because of their strong mechanism of recognizing the actions as suggested in [5] in history models comprising CNN or RNN models were used but those were having a limit to its power for recognition of actions. The topical methods for action recognition lookout for a recurrent feature space to capture different views. The work presented by [6] deals with this matter by proposing a network for view-invariant named Attention Transfer Network (ANT). Three types of view-invariant assessment are explained which are X-sub, X-view, and Arbitrary-View. The datasets used for this view-invariant are UESTC and the NTU, from which the results show 89% and 93% accuracy.

An approach is presented in [7] in which 3D skeletal data is represented by a novel 2D image. The information about the motion of the human skeleton and specifically its joints is transfigured to a pseudo-colored image. The dataset that is used for this model contains the instances of 3 camera angles which is the PKU-MMD dataset. The results show an increase in accuracy for a single view, cross-view, and cross-subject by 0.84, 0.81, and 0.86 respectively.

A method for recognizing human 3D actions early is described by [8] in which two types of temporal patterns: temporal dependencies and temporal dynamics are modeled. The illustrated method is performed on five datasets The MSR Action 3D dataset, CMU Motion Capture dataset, MSR 3D Action Pair dataset, NTU RGB+D, and UT Kinect-Action dataset.

An effectual method is dispensed in [9] in which depth images are used to recognize an action. By utilizing input depth sequences the MFSS ((multilevel frame select sampling) technique is proposed to generate 3 levels of temporal samples. The dataset and results on these datasets are MSR Action gives 98% accuracy, MSR Gesture shows 93% accuracy and UTD-MHAD represents 88.7% accuracy.

In [10] a 3D CNN model is used for the extraction of 2D spatial features for the purpose of recognizing an action. Kinect-based actions are recognized in [11] and comparisons between the features are measured. The complexity found in 3D convolutions is removed in [12] in accordance with multiscale Conv. A temporal pyramid network with 2 components source and feature is implemented in [13] for recognizing an action using visual tempos. A channel-wise STM is offered with a channel-wise motion module in [14] for capturing spatiotemporal features with the encoding of motion features. The short-range temporal evaluation motion excitation and for long-range temporal evaluation, multiple temporal aggregations are identified in [15] .For the purpose of video classification along with sequential data, a gated RNN is implemented [16].

The spatial features are extracted in [17] with the help of the STE path along with feature capturing done by CE. A module is introduced in [18] for capturing those dependencies in the skeleton which are richer for action recognition. Actional structures are also classified in a graphical CNN. A two-branch view for recognition of action is described in [19] in order to get an arbitrary view with the help of a model for generalizing the view. An attention method is implemented on a convent model for capturing distance and range in [20] for removing the objections in action irregularity. A point-wise conv is used in the creation of shift GCN in order to achieve a spatial graph without any trouble [21].

A GNN is used in [22] to gather information on bones and joints in a skeleton in order to get the action perfectly recognized. For encoding those features which prove to be different from each other in order to recognize an action a sub-graph is presented in [23]. In [24] an effective method of Tensor representation [25] is used for condensing those features which are high level for the recognition of action. A 3D CNN model along with asymmetric technology is implemented in [26] in the construction of micro Net [27] for effective action recognition. The actions performed by pedestrians are identified in [28] and evaluated for better recognizing an action. In [29] actions are labeled and Spatio-temporal features are extracted for evaluation of actions on web videos [30].

Material and Method

Our framework works in a way that firstly a batch of 4 activities is chosen (Walking, Sitting, Standing, Running) which are to be recognized. We have used three models to recognize the activities. Firstly the activities are recognized by using CNN (Convolutional Neural Network) model. Then the LSTM (Long Short Term Memory) model is used to check the accuracy. After that, a third model is built by using CNN+LSTM through which activities are trained and tested. Pre-processing of our data is done and features are extracted for our models to work and recognize an action precisely.

Activation functions are applied to the features. A dataset containing all the six mentioned activities is to be used for the recognition of actions (out of which 4 activities are recognized). The main objective is to achieve state-of-the-art results with a lot of accuracies. After the activities are recognized, the autocorrelation of both models is found. Lastly, the correlated features are found in our dataset. The detail about our model and process flow diagram is presented in Figure 1 given below.

1 https://archive.ics.uci.edu/ml/datasets/WISDM+Smartphone+and+Smartwatch+Activity+and+Biometrics+Dataset+

2 https://www.smrfoundation.org/nodexl/

Figure 1:Methodology for action recognition of skeletal data

Dataset
The dataset that we have used for our research is as below,

Wireless Sensor Data Mining (WISDM)
WISDM is an open-source dataset that was released by the Wireless sensor Data Mining Lab. The total number of actions found in the dataset is six: Walking, Running, Sitting, Standing, Upstairs, And Downstairs. These six activities are available in the form of raw data. The dataset comprises Labels for one and all activities. The labels for each activity include X-axis, Y-axis, and Z-axis values for the accelerometer which is tri-axial. Class is the attribute that belongs to the Activities. In all the datasets class distribution is elaborated. It defines the amount of data required for recognition of one action given the number of actions those activities are to be recognized from class distribution as per actions is mentioned in Table 1,

Table 1:Class distribution of WISDM

Pre-processing
It is compulsory to left the data from our dataset for attestation of our model in training and testing. The point behind the accuracy assessment of the model is to appraise the quality of the model and to create a model that would perform wonders on any data. The splitting of data is done in order to perform testing and training and the ratio of splitting is 80:20.

Feature Extraction
The features are extracted from images. The images get the features related to each activity and a number of classes related to one action are to be fed. After this these features are received by the dataset. Now the dataset will store these features one by one, class-wise into their respective action.

Action analysis
As our research is about recognition of the activities performed by an individual and feeding into the dataset. For recognition of actions accelerometer representation of axes is shown in Figure, The X-axis shows a value between -10 to 10 in some cases it is different from the other. Each activity is recognized individually and after the recognition, these are plotted into a graph.

Segmentation and Transformation
For training many groups at the same time, data that belong to a class of each action is split into data points of numbers which are further stored in segments. As LSTM requires a group of samples so sliding data of a total of 200 samples from the whole sequence of data is used. To work with these a time step size of 20 records is given and then the labeling is done that what action has the largest number of occurrences in the dataset.

Long Short-Term Memory
The model we proposed used LSTM (Long Short-Term Memory).LSTM possesses units that have cells with three gates which are input, output and forget gate. The gates are set out to attune the interchanging between the environment and memory cells. Input gates are used to allow the arriving signals to modify the shape of memory cells or they can block them also. On the flip side, the output gates allow the memory cells to prevent or have some effect on other neurons. Lastly, the forget gates can be used to forget the preceding states. The value of time intervals is remembered by cells, as gates normalize the information travels in 2 ways, from the cell, and to the cell. For time-series-based data, classification and prediction this is the best-used network. x^t is the input given to the memory cell at the time ‘t’. The weights used in the model are w1,w2,…wi, and the bias vectors for the model are b1,b2,…,bi.

Input Layer
The input layer possesses the input gate which is used for processing input through the layers.

Forward Layer
It is the layer that is used to forward the value of inputs to the next layer and because of this layer, the data from the input layer (through the input gate) can be easily passed.

Output Layer
This layer works with the output gate to gather all the processed data from the layers and gate and moved them to their final destination.

3 https://machinelearningmastery.com/cnn-long-short-term-memory-networks/

Activation Function
As we know LSTM works on 3 layers: the input layer, the hidden layer, and the output layer. The activation function used in our model for the Input and Hidden layer would be ReLu. The mathematical representation of ReLu is:

y=max(0,x)..........(1)

The activation function used in our model for the output layer would be Soft max. This activation function turns logits into probabilities that sum to one. Soft max function outputs a vector that represents the probability distributions of a list of potential outcomes. The mathematical representation of Softmax is:

Training Neural Network
For training, the learning rate is very essential, and choosing a learning rate that is appropriate is one of the milestones as learning rates can affect the time of training so a higher learning rate will be unstable causing issues with values and a lower learning rate would take a lot of time to learn so a moderate learning rate is what we need because the fine-tuning depends on these parameters. So important factors that affect the training of our model are described below:

Number of Epochs
The number of epochs for which we achieved our desired accuracy in our model is 10. For achieving this accuracy the value of batch size is 512.

Learning Rate
For choosing a learning rate one has to be cautious as a low learning rate will take so long to process and if it’s high it will cause uncertainty for the model. So for our model, the learning rate is 0.0025.

Optimization Function
The optimization function used for our model is Adam’s Optimizer. Adam’s Optimizer is best used for updating weights in the network which are of iterative nature in the training of data.

2D Convolutional Neural Network model
For action recognition, a 2D Convolutional Neural Network model is created and the features are gathered by using deep learning CNN features these features will lead to the next process of our model generation. A 2D CNN receives the input and after that, a sequence of Convolutional layers and pooling is applied to it. After this, a neural network is piled up on these sequences for slotting classification weights. By using this type of mechanism model works efficiently and the parameters used are reduced by this efficient mechanism. The utter interpretation of the CNN formation includes some layers that get the work done.

Input
A specified Time-length accelerometer type of data is used as input in the form of vector magnitude got from our dataset (WISDM). This input type of data is stored in our dataset. Each activity is assigned a number by using those numbers an activity can be classified and discriminated against.

Convolution Layer
The first layer to draw out the features from the data as (input) is the convolution layer. The features of a vector magnitude used for input are learned using a square of small size for input data with the stride size = 1. Two vectors are used for this purpose. The convolution layer conserves the association of learned features. The task of this layer is to compute the convolutional operation between two vectors. The first filter used for the 2D Conv layer is size 16 and for the next layer filter size=32.

A mathematical representation of this layer while taking an input matrix and filter as input is:

Dimension of input matrix= (h x w x d)

Filter= (fh x fw x d)

Activation Functions
After the convolution layer, activation functions are applied. The way of application of activation function is that it is applied to the output that we get from each convolutional layer. The purpose of applying this function is to differentiate the non-linear decision boundaries found in the model. Two activation functions are used in our CNN model, ReLu for input and Softmax for getting output.

The mathematical representation of both activation functions is given.

Pooling Layer
As the convolution layer produces the dimensions of the features representation, to reduce those dimensions of features pooling layer is used. The maximum or average block size that is already defined for input data is used. The features are extracted using 80 samples of features under 3 dimensions that is: x-axis, y-axis, and z-axis.

Fs= 20

Frame Size= Fs*4=80

Fully Connected Layer
The output on which sequences of convolution and pooling were applied is converted to a 2D vector. This vector is further used for learning the weights of classification by the usage of labels. Depending on the complexity of the features, two hidden layers are used to flatten and a Dense layer with filter size=64 is used.

Dropout: The 2D Conv and pooling features are treated as input on the fully connected layer with the application of dropout. Dropout is applied to avert the neural network from overfitting. With each dropout, the neurons are dropped so that network is stable leaving no under fitting and overfitting. The value of dropouts for layers are:

Dropout at 1st layer=0.1% = 10% of neurons are dropped

Dropout at 2nd layer=0.2% = 20% of neurons are dropped

Dropout at 3rd layer=0.5% = 50% of neurons are dropped

Output Layer
The last layer of CNN is located on top of the previous layer i.e. fully connected layer. This layer uses predicted labels to find out the distribution of the gathered probability of finding the activities. Each node of Soft max is used to calculate the chances of occurrence for each action available in the dataset.

Training Neural Network
For training, a learning rate is very essential, and choosing a learning rate that is appropriate is one of the milestones as learning rates can affect the time of training so a higher learning rate will be unstable causing issues with values and a lower learning rate would take a lot of time to learn so a moderate learning rate is what we need because the fine-tuning depends on these parameters. So important factors that affect the training of our model are described below:

Number of Epochs
The number of epochs for which we achieved our desired accuracy in our model training is 10.

Learning Rate
For choosing a learning rate one has to be cautious as a low learning rate will take so long to process and if it’s high it will cause uncertainty for the model. So for our model, the learning rate is 0.001.

Optimization Function
The optimization function used for our model is Adam’s Optimizer... As Adam works vastly and the hyper-parameter of the model works perfectly fine with this optimizer so choosing this works best for our model.

CNN + LSTM Model
The model we proposed used a combination of CNN and LSTM. As the model is using the combination of CNN and LSTM, the CNN layers are used to extract the features from the input and LSTM is used to support the sequence of predictions used in the data. So the combination of these two models together is so beneficial for action recognition as it combines the best attributes of both (CNN and LSTM) models and using them together plays an exemplary role in recognizing an action.

Layers
As it is a combined model so layers of CNN and LSTM both are combined. The indicted CNN is swaddled in a layer called Time Distributed layer. Those features that are extracted are then passed to the LSTM layer. The LSTM layer consists of a single hidden layer which is followed by a dropout layer the purpose of which is to avoid under fitting and overfitting the model at the time of training. A dense layer is used for the interpretation of the features extracted from the LSTM layer and then a final layer delivers the output in the form of recognized functions.

Number of Epochs
The number of epochs for which we achieved our desired accuracy in our model training is 50. For achieving this accuracy the value of batch size is 64.

Optimization Function
The optimization function used for our model is Adam’s Optimizer as Adam works vastly and the hyper-parameter of the model works perfectly fine with this optimizer so choosing this works best for our model.

Auto Correlation & Correlation
Auto Correlation: The concept of autocorrelation with the models of action recognition is introduced in our research.

rk =∑N−ki=1(Yi−Y¯)(Yi+k−Y¯)/∑Ni=1(Yi−Y¯)2...........(5)

Considering y1, y2…., in the measurement at the time x1, x2…., xn the k lag function with the mathematical explanation of autocorrelation is illustrated. Autocorrelation is considered a correlation coefficient. Nevertheless, the correlation takes place on the same variables having two different values at time Xi and Xi+k, rather than a correlation between two different variables.

Lag
In the time gap, the value of k is generally known as lag. The lag 1 autocorrelation considering the value of k=1 shows the correlation between values that are taken as one time period apart from each other. If we sum this concept up then it means a lag of k autocorrelation is the correlation of values apart at k times.

Correlation Features
The features found in our research models are checked if they correlate with each other. For this purpose, the features that are used in our dataset WISDM are used and the possibility of correlation is checked. Correlation basically shows the association of different variables with each other. The features found in the dataset are checked to find out the correlation between them and the value of correlation is got in the form of the matrix representing the range of correlations of the variables or features with each other in a semantic way. Those features are assigned values with other variables and themselves and the result represents the values. There are 3 features found in our dataset X, Y, and Z. so the correlation of these three features with each other and one another is drawn.

Result and Discussion

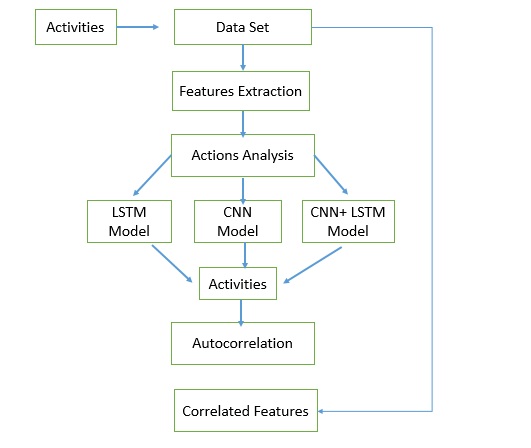
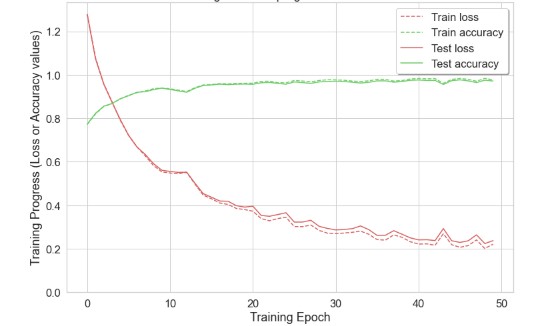
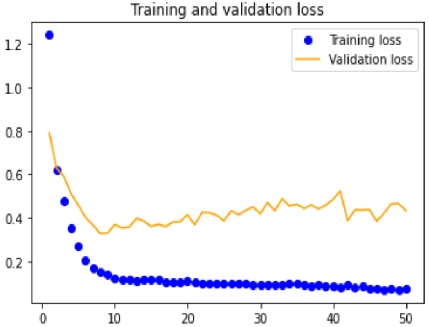
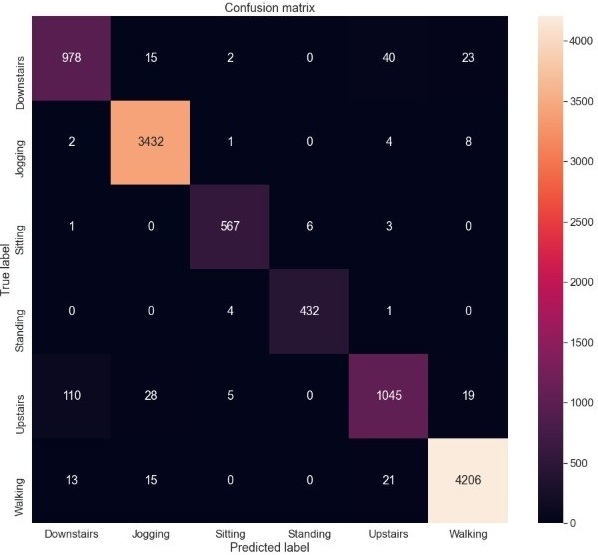
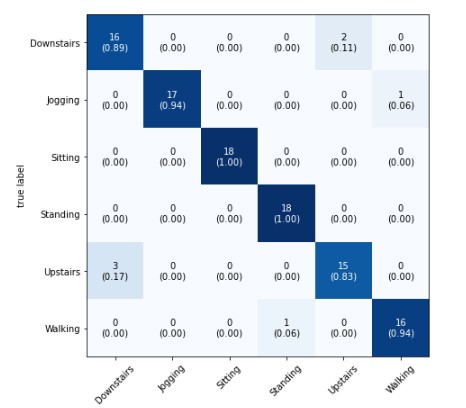
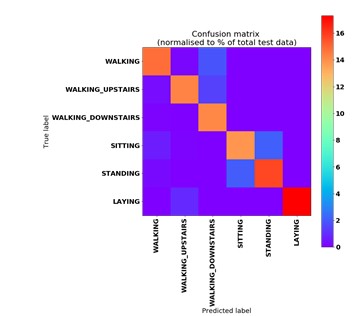
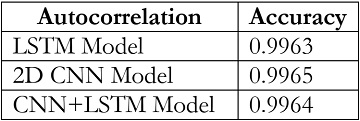
The tests driven out from our experiments are shown in the form of graphs and tables in this portion. Further, 
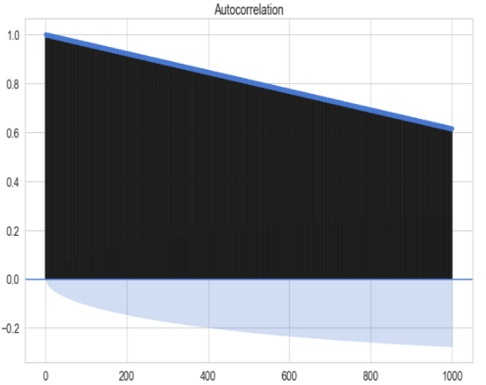
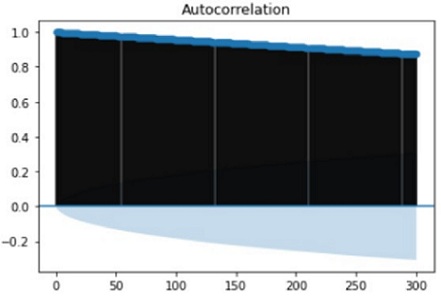
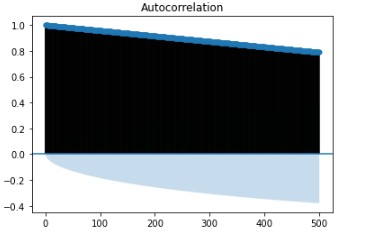
the three of our models (LSTM, CNN & CNN+ LSTM) went through the mechanism of autocorrelation. These models are one by one checked and autocorrelation of our models with the activities is found and its result is represented in form of a graph for 
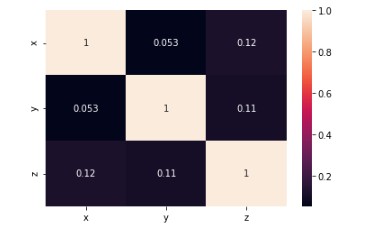
better understanding. At last, the correlation of all the features used in the models is found and this correlation of features is represented in the form of a matrix.

LSTM Model Results
The number of epochs is 50, and the accuracy reaches near to 1 result at each epoch accuracy and loss are shown in Table 2, and the accuracy of our LSTM model is increased by tuning the hyper parameter. Machine learning and deep learning models have many hyper parameters. One of the most important hyper parameters is batch size. Batch size means the number of records that process under one iteration. Table 3 represents how changing this parameter will cause our accuracy to increase.

Table 2: LSTM Model Results

Table 3: Batch Size effects on accuracy

CNN Model Results
The results of the CNN Model after performing 10 epochs are shown in Table 4 below:

Table 4:2D CNN Model Results

CNN+ LSTM Model Results
The results of the CNN+LSTM model after performing 50 epochs are shown in Table 5 below:

Table 5: CNN+LSTM Model Results

Graphs
LSTM Model: As the Graph states that the Green line represents the accuracy of recognizing an Action and the points of the Red line toward the loss that is being faced. In our case, a loss of almost 0.09% and an accuracy of 0.98% is achieved for the LSTM model which is superlative. This level of accuracy means that recognition of action is done in the best possible way. Figure 2 below is representing the accuracy and loss relation of the LSTM model.

Figure 2:Training Epoch’s Result for LSTM model

CNN Model
Figure 3, 4 represents that loss and accuracy values in terms of the x-axis and y-axis. In our case, a loss of almost 0.23% and an accuracy of 0.92% is achieved for the 2D CNN model which is superlative.

Figure 3:CNN Model Accuracy

Figure 4:CNN Model Loss

CNN+LSTM Model
Figure 5, and 6 represents the accuracy and loss of the CNN+LSTM model. The graph shows an accuracy of 90% at epochs of 50. The loss of the CNN+LSTM model is shown in Figure 7 which shows the loss of 0.47% while training on 50 epochs.

Figure 5:CNN+LSTM Model Accuracy

Figure 6:CNN+LSTM Model Loss

Confusion Matrix
The representation of our described activities which were Walking, Sitting, Standing, Running, Upstairs, and Downstairs are drawn on a confusion matrix.

LSTM Model
The confusion matrix is pointing toward the actions, class of actions, and the total number of labels found related to one action. The x-axis shows the activities found in the dataset and one side of the y-axis is representing those actions while the other side of the y-axis is representing the value of classes of actions. So the first activity “Downstairs” represents that the total labels of downstairs found in our dataset are 978. The second activity which is “Jogging/running” represents that the total labels of jogging/running found in our dataset are 3,432. The Third activity which is “Sitting” represents that the total labels of Sitting found in our dataset are 567. The fourth activity which is “Standing” represents that the total labels of standing found in our dataset are 432. The fifth activity which is “Upstairs” represents that the total labels of upstairs found in our dataset are 1,045. The sixth activity which is “walking” represents that the total labels of walking found in our dataset are 4,206. Figure 7 shows the confusion matrix of the LSTM model.

CNN Model
In Figure 8 the confusion matrix CNN model represents the recognition of activities The first activity “Downstairs” represents the accuracy of recognizing an action downstairs is 0.89 is 89% while the second activity which is “Jogging/running” represents the total labels of jogging/running found in our dataset are 3,432 and the accuracy of recognizing an action of jogging/running is 0.94 that is 94%, which means jogging/running action is 94% accurately recognized. The Third activity which is “Sitting” has the accuracy of recognizing an action of sitting at 1.00 which is 100%. The fifth activity which is “Upstairs” has an accuracy of recognizing an action upstairs is 0.83 which is 83%. The sixth activity which is “walking” has an accuracy of recognizing an action of walking is 0.94 which is 94%.

CNN+LSTM Model
The confusion matrix of the CNN+LSTM model states that in Figure 9 is perceptible that the labels of activities illustrated in diagonal regions have shown bright colors within the range of 13–16 colors found in the color bar. Thus, the predicted label has been identified as the true label in most of the experimental cases.

Figure 7:Confusion Matrix of LSTM

Figure 8:Confusion Matrix of CNN

Figure 9:Confusion Matrix of CNN+LSTM

Auto Correlation of Models
In our research, the autocorrelation of the models is introduced which works with the dataset of our models. A time series autocorrelation method is applied to our dataset which computes the correlation coefficient of linear correlation between two variables. Figure 10 is showing the autocorrelation of the LSTM model and Figure 11 shows the autocorrelation of the 2D CNN model figure 12 shows the autocorrelation of the CNN+LSTM Model and Table 6 shows the results of our models.

Table 6: Autocorrelation of our Models

Figure 10:Autocorrelation of the LSTM Model

Figure 11:Autocorrelation of 2D CNN Model

Figure 12:Autocorrelation of LSTM+CNN model

Correlation Features
The correlation features find out on the basis of the dataset. All the features found in our dataset are grabbed and the value of these features correlating with each other is shown in the form of a matrix that is given in figure 13. As our dataset contains 3 features i.e. x, y, and z. so a matrix with an x-axis and y-axis is plotted on both the axis representing the features of our dataset i.e. x, y and z. on the other side of the y-axis the values from 0 to 1.0 are plotted and correlation of these three features on the basics of values are shown.

Figure 13:Correlation Matrix

The values in the matrix range from -1 to 1 so this means that if the value of a feature is:

• -1 means there is a strong negative correlation between the features.

• 0 means there is no correlation between the features.

• 1 means there is a positive correlation between the features.

Conclusion

In this research, a method for the recognition of human actions is presented. The method comprised of an LSTM model and a 2D CNN model which is used for the recognition of actions performed by humans. The dataset used to get the activities is the WISDM dataset. Both models recognize the activities from the dataset and discriminate each activity. Training of neural network is performed and results are retrieved by 50 epochs of training that show 98% accuracy in state of the art for LSTM model accuracy of 92% is achieved for 2D CNN after 10 epochs. A confusion matrix is used to represent this accuracy. After both the models have shown their working accuracy the autocorrelation of both models is checked individually. We have introduced the autocorrelation of our LSTM model with our data shows 0.9963 accuracy while the autocorrelation of 2D CNN shows an accuracy of 0.9965 with our data. Lastly, the features of our models are found to that correlates with each other and a correlation matrix represents the results. The features that show a strong positive correlation are x y and z when there are correlated with themselves. The correlation of features with themselves gives the value 1 which means they are strongly correlated to each other. In the future, more classes of activities can be recognized using our model.

Dataset & codes
Provided on request

Conflict of Interest: The authors declare no conflict of interest in publishing this manuscript in IJIST.

Reference

1. H. B. Zhang, Y. X. Zhang, B. Zhong, Q. Lei, L. Yang, J. X. Du and D. S. Chen, "A comprehensive survey of vision-based human action recognition methods," Sensors, vol. 19(5), no. 1005, 2019.

2. . Staff, in 5th International Conference on Advanced Technologies for Signal and Image Processing (ATSIP), 2020.

3. J. Xiong, L. Lu, H. Wang, J. Yang and G. Gui, "Object-level trajectories based fine-grained action recognition in visual IoT applications," IEEE Access, vol. 7, pp. 103629-103638, 2019.

4. A. Jalal, S. Kamal and C. A. Azurdia-Meza, "Depth maps-based human segmentation and action recognition using full-body plus body color cues via recognizer engine," Journal of Electrical Engineering & Technology, vol. 14(1), pp. 455-461, 2019.

5. X. Gao, W. Hu, J. Tang, J. Liu and Z. Guo, " Optimized skeleton-based action recognition via sparsified graph regression," In Proceedings of the (pp.27th ACM International Conference on Multimedia, 2019 (october).

6. Y. Ji, F. Xu, Y. Yang, N. Xie, H. T. Shen and T. Harada, "Attention transfer (ANT) network for view-invariant action recognition," In Proceedings of the 27th ACM International Conference on Multimedia, pp. 574-582, 2019 (October).

7. I. Vernikos, E. Mathe, A. Papadakis, E. Spyrou and P. Mylonas, "An image representation of skeletal data for action recognition using convolutional neural networks," 2019.

8. G. Lin and W. Shen, "Research on convolutional neural network based on improved Relu piecewise activation function," Procedia computer science, vol. 131, pp. 977-984, 2018.

9. X. Weiyao, W. Muqing, Z. Min, L. Yifeng, L. Bo and X. Ting, "Human action recognition using multilevel depth motion maps," IEEE Access, vol. 7, pp. 41811-41822, 2019.

10. G. Yao, T. Lei and J. Zhong, " A review of convolutional-neural-network-based action recognition.," Pattern Recognition Letters, vol. 118, pp. 14-22, 2019.

11. L. Wang, D. Q. Huynh and P. Koniusz, "A comparative review of recent kinect-based action recognition algorithms," IEEE Transactions on Image Processing, vol. 29, pp. 15-28, 2019.

12. N. Hussein, E. Gavves and A. W. Smeulders, "Timeception for complex action recognition.," In Proceedings of the IEEE/CVF Conference on Computer Vision and Pattern Recognition, pp. 254-263, 2019.

13. C. Yang, Y. Xu, J. Shi, B. Dai and B. Zhou, "Temporal pyramid network for action recognition," In Proceedings of the IEEE/CVF conference on computer vision and pattern recognition, pp. 591-600, 2020.

14. B. Jiang, M. Wang, W. Gan, W. Wu and J. Yan, "Stm:Spatiotemporal and motion encoding for action recognition.," In Proceedings of the IEEE/CVF International Conference on Computer Vision, pp. 2000-2009, 2019.

15. Y. Li, B. Ji, X. Shi, J. Zhang, B. Kang and L. Wang, "Tea:Temporal excitation and aggregation for action recognition," In Proceedings of the IEEE/CVF conference on computer vision and pattern recognition, pp. 909-918, 2020.

16. N. Jaouedi, N. Boujnah and M. S. Bouhlel, "A new hybrid deep learning model for human action recognition," Journal of King Saud University-Computer and Information Sciences, vol. 32(4), pp. 447-453, 2020.

17. Z. Wang, Q. She and A. Smolic, "Action-net: Multipath excitation for action recognition," In Proceedings of the IEEE/CVF conference on computer vision and pattern recognition, pp. 13214-13223, 2021.

18. M. Li, S. Chen, X. Chen, Y. Zhang, Y. Wang and Q. Tian, "Actional-structural graph convolutional networks for skeleton-based action recognition," In Proceedings of the IEEE/CVF conference on computer vision and pattern recognition, pp. 3595-3603, 2019.

19. K. Gedamu, Y. Ji, Y. Yang, L. Gao and H. T. Shen, "Arbitrary-view human action recognition via novel-view action generation," Pattern Recognition, vol. 118, p. 108043, 2021.

20. J. Li, X. Liu, M. Zhang and D. Wang, " Spatio-temporal deformable 3d convnets with attention for action recognition," Pattern Recognition, vol. 98, p. 107037, 2020.

21. K. Cheng, Y. Zhang, X. He, W. Chen, J. Cheng and H. Lu, "Skeleton-based action recognition with shift graph convolutional network," In Proceedings of the IEEE/CVF Conference on Computer Vision and Pattern Recognition, pp. 183-192, 2020.

22. L. Shi, Y. Zhang, J. Cheng and H. Lu, "Skeleton-based action recognition with directed graph neural networks," In Proceedings of the IEEE/CVF Conference on Computer Vision and Pattern Recognition, pp. 7912-7921, 2019.

23. D. Li, Z. Qiu, Y. Pan, T. Yao, H. Li and T. Mei, "Representing videos as discriminative sub-graphs for action recognition," In Proceedings of the IEEE/CVF Conference on Computer Vision and Pattern Recognition, pp. 3310-3319, 2021.

24. P. Koniusz, L. Wang and A. Cherian, "Tensor representations for action recognition," IEEE Transactions on Pattern Analysis and Machine Intelligence, vol. 44(2), pp. 648-665, 2021.

25. W. Hackbusch and S. Kühn, "A new scheme for the tensor representation," Journal of Fourier analysis and applications, vol. 15(5), pp. 706-722, 2019.

26. H. Yang, C. Yuan, B. Li, Y. Du, J. Xing, W. Hu and S. J. Maybank, "Asymmetric 3d convolutional neural networks for action recognition," Pattern recognition, vol. 85, pp. 1-12, 2019.

27. Y. Li, Y. Chen, X. Dai, D. Chen, M. Liu, L. Yuan and N. Vasconcelos, "MicroNet: Towards image recognition with extremely low FLOPs," arXiv preprint, p. 2011.12289, 2020.

28. T. Özyer, D. S. Ak and R. Alhajj, "Human action recognition approaches with video dataset," A survey. Knowledge-Based Systems, vol. 222, p. 106995, 2021.

29. D. Ghadiyaram, D. Tran and D. Mahajan, "Large-scale weakly-supervised pre-training for video action recognition," In Proceedings of the IEEE/CVF conference on computer vision and pattern recognition, pp. 12046-12055, 2019.

30. Y. Song, J. Vallmitjana, A. Stent and A. Jaimes, "Tvsum: Summarizing web videos using titles," In Proceedings of the IEEE conference on computer vision and pattern recognition, pp. 5179-5187.