E-ISSN:2709-6130
P-ISSN:2618-1630

Research Article

International Journal of Innovations in Science & Technology

2023 Volume 5 Number 1 December-Janurary

Detection & Quantification of Lung Nodules Using 3D CT images

Memon. F.1*, Jawaid. M.2, Talpur. S.3
DOI: https://doi.org/10.33411/IJIST/2023050105

1* Falak Memon, Mehran University of Engineering & Technology Jamshoro Campus).

2 Moazzam jawaid, Mehran University of Engineering & Technology Jamshoro

3 Shahnawaz Talpur, Mehran University of Engineering & Technology Jamshoro

Abstract
In computer vision image detection and quantification play an important role. Image Detection and quantification is the process of identifying nodule position and the amount of covered area. The dataset which we have used for this research contains 3D CT lung images. In our proposed work we have taken 3D images and those are high-resolution images. We have compared the accuracy of the existing mask and our segmented images. The segmentation method that we have applied to these images is Sparse Field Method localized region-based segmentation and for Nodule detection, I have used ray projection. The ray projection method is efficient for making the point more visible by its x, y, and z components. like a parametric equation where the line crossing through a targeted point by that nodule is more dominated. The Frangi filter was to give a geometric shape to the nodule and we got 90% accurate detection. The high mortality rate associated with lung cancer makes it imperative that it be detected at an early stage. The application of computerized image processing methods has the potential to improve both the efficiency and reliability of lung cancer screening. Computerized tomography (CT) pictures are frequently used in medical image processing because of their excellent resolution and low noise. Computer-aided detection systems, including preprocessing and segmentation methods, as well as data analysis approaches, have been investigated in this research for their potential use in the detection and diagnosis of lung cancer. The primary objective was to research cutting-edge methods for creating computational diagnostic tools to aid in the collection, processing, and interpretation of medical imaging data. Nonetheless, there are still areas that need more work, such as improving sensitivity, decreasing false positives, and optimizing the identification of each type of nodule, even those of varying size and form.

Keywords: Image segmentation, CT, Ray Projection, Frangi Filter, SFM

Corresponding Author How to Cite this Article
Falak Memon, Mehran University of Engineering & Technology Jamshoro.
Falak Memon, Moazzam jawaid, Shahnawaz Talpur, Detection & Quantification of Lung Nodules Using 3D CT images. IJIST. 2023 ;5(1):68-81 https://journal.50sea.com/index.php/IJIST/article/view/438

Introduction

About one million people die every year from lung cancer, which is one of the most dangerous types of disease. The way things are going in medicine right now makes it necessary to look for lung nodules on chest CT scans. This is because lung nodules are getting more and more common. Because of this, CAD systems are needed to reach the goal of finding lung cancer early [1]. During a CT scan, high-tech X-ray equipment is used to take pictures of the body from several different angles. After that, the images are sent to a computer, which processes them so that a cross-sectional view of the organs and tissues inside the body is made.

A major cause of death from lung cancer is that it is often not found early enough. Coughing, sore throat, chest pain, fatigue, chest infection, coughing up blood, and weight loss are all common signs of lung cancer. If lung cancer cases aren't found or treated quickly enough, the patient could get sick. This shows why diagnostic and treatment procedures need to be effective and done promptly. In hospitals, outpatient care for cancer patients can be inefficient for several reasons, such as not being able to get specialized medical care, problems with referring patients and not having a specific treatment. Outpatient care needs to be brought back into the public health system so that counseling can be done faster, requests for diagnostic tests can be met, and the time it takes to diagnose and treat a tumor can be cut down. But it's still hard to know what happens to a patient's chance of living if lung cancer treatment is put off [2].

Current clinical methods take thousands of pictures of each patient, and it would be hard for a doctor to look at all of them accurately and in detail. Also, a person can make mistakes when interpreting medical images and may not find all the data and imaging information. With the improvement of computer systems, a radiologist's knowledge can be used in a computer to get information out of a medical picture. Human analysis is usually subjective and qualitative, and carelessness may occur. Furthermore, a comparative analysis is required between an image with a nodule and another nodule pattern, and the human observer usually provides a qualitative response. Using images and getting quantitative or numerical information out of them requires the use of computers [3].

Since most analyses done by humans are based on qualitative judgment, they will vary depending on how much time an observer spends on them or from one observer to the next. This can be due to the lack of diligence or inadequate knowledge and also because of the diversity of education and the level of understanding or competence. Computers can do the same task many times in a short amount of time and with high accuracy. In addition, the knowledge of many experts can be implemented computationally; thus computers are often trained in a specific field by a team of several human experts. In this way, the move toward CAD systems in medicine, which is caused by a quantitative analysis of CT lung images, can improve the analysis of CT images (which may show pulmonary nodules), the diagnosis of the disease, the detection of small cancerous nodules (which are hard for a doctor to find), and the time it takes to find out what's wrong [4].

In the process of medical image processing, segmentation is used. The main purpose of a picture is to show what is good and what is bad. As a consequence of this, it separates a picture into distinct pieces based on the degree to which each component is similar to its surrounding components. You can get this effect by changing both the intensity and the texture. A segmented area of interest can be used as a diagnostic tool to get information quickly that is relevant to the problem at hand. K-means clustering is the most common way to divide up medical images. During the clustering process, the picture is broken up into several separate groups, or "clusters," that don't overlap [5]. There is no way that these clusters can be linked to each other. There are a few clear clusters that stand out in this picture. Each of them has its own unique set of reference points that each pixel is connected to. The K-means clustering algorithm uses k reference points to divide the available data into k separate groups.

Artificial neural networks, or ANNs, are often used in the medical field to classify medical images to figure out what's wrong with a patient. When it comes to how it does its job, the ANN is a lot like the human brain. By looking at a collection of pictures that have already been put into categories, you can get the information you need to make an educated guess about where a picture fits. This can be done by looking at a group of pictures that have been put into different groups. Each of the pictures in this gallery has already been put into a category. An artificial neural network (ANN) is made up of artificial neurons that are programmed to act the same way as their real-life counterparts in the human brain. Neurons can talk to each other outside of their bodies because they are connected [6]. Weights can be given to neurons and edges, and these weights can be changed at any time during the learning process. An artificial neural network usually has three layers: an input layer, a hidden layer, and an output layer that is responsible for making the signal. This is the most common type of architecture. Most artificial neural networks have an input layer, a hidden layer, and a final layer, but there are other ways they can be set up as well. It is possible that there is only one hidden layer, that there are several hidden levels, or that there are no hidden layers at all. All of these choices are not completely out of the question. The weights that need to be changed until the output is just right are hidden in a layer below the active layer. During the training of the ANN model, the number of iterations has a lot to do with how well the computer works. If there aren't enough neurons in the hidden layer, precision will suffer, but if there are too many, it will take longer to train.

The most common method used in machine learning (ML) is the KNN approach, which makes it easy to learn about the algorithms used in ML. It is a supervised learning technique that doesn't need any parameters. So, the training phase of the k-training NN is much shorter than the training phase of other classifiers. On the other hand, as the testing stage goes on, it takes longer and uses more memory. To use k-nearest neighbors to put new types of data points into different categories, you must first have data that is already organized into many different types. Because there are training observations in each labeled dataset, the algorithm can find a link between x and y in each training dataset (x, y). Most of the time, the processing is held off at this point so that the KNN function can be found. In classification models and regression models, neighbor's contributions can be given more weight. This can make the average score of people who live close to each other higher than those who live farther away. As the distance between two neighbors goes up, each neighbor gets an extra weighting of 1/d. Even though KNN did a good job on the test dataset, it still took more time and memory to run and was less accurate. For prediction, it needs a lot of memory to store the whole training dataset. Also, because Euclidean distance is very sensitive to orders of magnitude, features in the dataset with high magnitudes always have a higher weight than those with low magnitudes. Last but not least, we need to keep in mind that KNN is not good for big datasets [7].

According to the World Health Organization, "WHO," cancer is the most common throughout the world. In 2022, about a killer, each year, 2.09 million check new instances of lung cancer are diagnosed, and 1.76 million related deaths are reported. Despite significant advancements in treatment over the past few decades, the outlook for lung cancer remained bleak. In developed nations, the 5-year survival rate remained at 15%, compared to 10% in Europe and 15% in the United States. [8]

In Pakistan, the third leading cause of mortality in lung cancer [9]. Whether they were smokers or not, it has touched everyone. Cancer patients in our area have a dismal rate of survival. There exists a chance of survival if it is discovered in the early stages. It is believed that screening can identify lung cancer at an early stage and can assist lower mortality.

Computed Tomography (CT) and Positron Emission Tomography (PET) are two of the most popular imaging techniques that may employ advanced X-ray equipment to scan the body and deliver detailed information regarding cancer-related activities. The inspection and detection of lung cancer depend greatly on the CT scan [10].

In the majority of the suggested techniques, the Region of Interest (ROI) is manually drawn by the radiologist using a semi-automated approach, and a preset ROI is then used to separate the tumor masses [11]. Making such a decision can help to shorten the diagnostic process and enable the doctor to highlight a particular area of interest that will be beneficial in multistep algorithms. These outcomes can also be further enhanced when the semiautomatic tool applies over- or under-segmentation. The first step in expediting the analytic process is the use of a semiautomatic tool, and during the entire operation, no human subjects were used to acquire the data. On the other hand, the radiologist must be involved and manually pick the ROI slice by slice [12].

Detection
Development Evaluation Training and Educational Consultative Detection is the action of accessing information without specific cooperation. Detection is the act of noticing or discovering something [13]. The act of detection is to make open what was concealed or hidden or what tends to elude observation Detection is the act of noticing or sensing something. A lung nodule (or mass) is a tiny abnormal spot that can occasionally be discovered during a chest CT scan. These scans are performed for a variety of purposes, including lung cancer screening or to evaluate the lungs if someone is experiencing symptoms. On CT scans, the majority of lung nodules are not cancerous [14].

Quantification
The process of mapping human sense observations and experiences into amounts by counting and measuring is known as quantification. The scientific approach is fundamentally quantified in this way. Quantification is a type of language construction that describes the number of people in the discourse domain who meet certain criteria.

The long- and perpendicular short-axis are measured on two-dimensional images when measuring nodule size manually using electronic calipers [15]. Nodules that range in size from 6 mm to 10 mm should be thoroughly examined. Given that nodules larger than 10 mm in diameter have an 80% chance of being malignant, they should either be biopsied or removed. Lung masses are nodules that are 3 cm or larger.

When nodules are small, biopsies are typically not advised since it is quite challenging to do so safely. When a nodule is small, doing a biopsy might be harmful, leading to breathing difficulties, bleeding, or infections. Nodules that are 9 mm or larger are frequently the subject of biopsies [16]. The size and presence of nodules are shown in figure 1 and 2.

Figure 1:The red circle shows the presence of a nodule

Figure 2:The size of the Nodule has been mentioned

Localized Region-Based Segmentation
The regions with the identical characteristics that we designate can be correctly divided using region growth methods. Methods for expanding regions can produce original images with sharp edges and segmentation. The effectiveness of radiation therapy is significantly influenced by the exact delineation of the boundaries between nearby normal organs and malignant tissues. Deformable models provide a novel and effective method for segmenting medical images. The study's goal was to examine the validity of three well-known local region-based level-set methodologies for segmenting Organs-At-Risk (OARs) [17].

Related Studies
The existing methods show some drawbacks, due to which models are not fully reliable

Res Net
Res Net's artificial neural network "identity shortcut connection" enables the model to omit one or more layers. This approach allows for the network to be trained on hundreds of layers without sacrificing performance [18]. After the first CNN-based design (Alex Net), which won the ImageNet 2012 competition, every subsequent winning architecture increases the number of layers in a deep neural network to reduce the error rate. This works well for fewer levels, but as we increase the number of layers, a common deep-learning problem known as the Vanishing/Exploding gradient appears. As a result, the gradient either reaches zero or grows excessively. As a result, as the number of layers rises, the training and test error rates also rise. Res Net model ignores some details of small objects because of the Gaussian filter. This model cannot handle noisy images which result in inadequate image segmentation. RES NET model increased the complexity of architecture [13] as shown in Figure 3.

Figure 3:(a), (c) Initialization; (b), (f) final result with global energies; (c), (g) final result with local energies; (d), (h) convergence and timing properties of localized method (dashed line) and corresponding global method (solid line).

DNN
Models based on Deep Neural Networks (DNNs) can overcome these drawbacks of matrix factorization. Due to the network's input layer's versatility, DNNs may readily add query features and item features, which can help to identify a user's interests and increase the relevancy of suggestions.

The deep neural network has the less resourceful (DNN) Mobile Net as the ‘trainer’. It has been two methods to organize this Mobile Net which are the input picture resolution and the second size of the model in the Mobile Net. In this research paper, it has been shown where Input Image pixels are set as 227, and the Size of the model is about 0.51 [19]. The deep neural networks model is extremely expensive to train due to complex data models and its time-consuming [20].

CNN
For deep learning algorithms, a CNN is a specific kind of network design that is used for tasks like image recognition and pixel data processing. CNNs are the chosen network architecture for detecting and recognizing objects in deep learning, even though there are several types of neural networks. Convolution Neural Network (CNN) and Keras API, the results are extracted using customized neural network CNN with the architecture.[21]. CNN and Keras API model segments images with intensity inhomogeneity but limits its performance because of dependency on the initial customized position.

Objectives
The objective of this research is as below:

• Segmentation of 3D lungs model from CTA volume using Localized region-based segmentation.

• Identification and quantification of nodules in segmented lungs using image processing techniques (intensity and geometric shape analysis).

• To perform a comparative analysis of results with existing methods.

Material and Method

First, the 3D image is selected and then preprocessed by different methods including segmentation filtration and nodules detection. The flow of methodology is as below in figure 6. It is helpful to begin with a discussion of the overall methodology, giving the reader a thorough understanding, before going to explain the individual processing used to produce the most precise segmentation [22]. For this, CADe systems use four phases to identify lung nodules including FP reduction, segmentation of the lungs, nodule detection, and preprocessing [23]. Figure 4 describes the overview of the DNN model and figures determine about different layers of the CNN model.

Figure 4:Overview of the DNN model

Figure 5:Different layers of the CNN model

Figure 6:Proposed Methodology

Conversion of DCM into Mat-Volume
A DICOM file is a combination of a header file and the image data as a single file. The content of the header is organized using a regular, standardized set of tags. By extracting information from these tags, one can get crucial details about the patient demographics and study features [24]. There are several subsequent versions of MAT-file that support an increased set of visions [25]. Figure 7 shows a 3D image and its particular slice.

Figure 7:(a) 3D image (b) one particular slice

Preprocessing
Data preprocessing includes cleaning, instance selection, normalization, one-hot encoding, transformation, feature extraction, and selection, to name a few. The outcome of data preparation is the final training set. Pre-processing is the process of purging an image of undesirable information. Additionally, it improves performance and serves as a crucial stage in the data mining process. The outcome of the final data processing may be hampered by data pre-processing [26].

Figure 8:(a) Initial Image (b) Segmented Image(c) Pre-processed Image

Performed Segmentation Using SFM & Display Visual Results
Structure from motion is a method for identifying a scene's 3-D structure from a set of 2-D pictures (SfM) [27]. A few applications for SfM include 3-D scanning, augmented reality, visual simultaneous localization, and mapping (vSLAM). SfM can be computed in a variety of ways [28].

Image segmentation is the process of breaking a picture into areas or portions. Often, the characteristics of the image's pixels serve as the foundation for this segmentation. For instance, looking for sharp discontinuities in pixel values, which often denote edges, is one method of locating regions in an image [29].

For homogeneous images, the SFM Model produces better segmentation outcomes. Segmenting is not possible for photos with altered intensity or images with inhomogeneous intensity [23,24]. Figure 9 shows various forms of an image.

Figure 9:(a) Image solid form (b)Segmented Form (c)Image transparent

Geometric Shape Analysis
Shape analysis is the automatic analysis of geometric shapes for example to detect the similarities of shaped objects computerized in a database or parts that fit together. Digital form is the object that has to be analyzed geometric shapes automatically with the help of a computer [21]. Figure 10 is showing vascular and non-vascular types of an image

Figure 10:(a) Vascular Image (b) Non-Vascular Image

To evaluate the overall performance, three indicators including Accuracy, Sensitivity, and Dice index were calculated using the following formulas.

Where TP, TN, FP, and FN are True Positive, True Negative, False Positive, and False Negative respectively.

The areas of the lungs are segmented by the TP's true positive rate. While FP signifies a false positive rate in which the non-tumor regions are incorrectly classified as tumors and FN is a false negative rate in which the tumor tissues are incorrectly classified as non-tumor tissues, TN represents a True Negative that cannot segment the non-tumor regions.

Result

Nodule detection using Ray Projection, Intensity Profiling, and Geometric Shape analysis was applied and results are mapped in Figure 11. This figure is showing original image and its segmentation [31].

Figure 11:Nodule detection process images

Intensity analysis
In intensity analysis, we detected the location of the nodule that was detected after intensity fluctuation in the image. The set of intensity values along a line segment or multi-line path in an image is taken at regular intervals to form the intensity profile of the image. You can use the profile function to build an intensity profile as shown in Figure 12.

Figure 12:(a) The intensity with Nodule (b) Intensity without Nodule

The position of the nodule is estimated in Table 1

Table 1: Position of Nodules

Lung’s Segmentation
Image segmentation is a common technique in digital image processing and analysis to separate an image into multiple parts or areas. It is frequently based on the characteristics of the picture's pixels. Segmenting an image allows discerning between the foreground and background. One can group pixels based on how similar they are in terms of color or shape. Image segmentation is frequently used in medical imaging to recognize and classify pixels in an image or voxels in a 3D volume that, for example, signal a tumor in a patient's brain or other organs.

The accuracy, sensitivity, and dice index were calculated and the values are shown as below in Table 2.

Table 2:Position of Nodule

Discussion

Lung cancer is one of the deadliest kinds of disease. Each year, about one million people die from it. Given how medicine is right now, lung nodule identification must be done on chest CT scans. Because of this, CAD systems are very important for finding lung cancer early. Image processing is a necessary task that is used in many different areas of business. It is used in X-rays of the lungs to find places in the body where cancerous growths have started. To find parts of the lung that have been affected by cancer, image processing techniques are used, such as removing noise, pulling out features, identifying damaged areas, and maybe even comparing the results with information about the medical history of lung cancer. This study shows that technologies made possible by machine learning and image processing can accurately classify and predict lung cancer. To start, photos must be gathered. After that, a geometric mean filter is used to prepare the images. In the end, this makes the image quality better. Then, the K-means method is used to divide the images into groups. With this division, it's easier to find the area of interest. After that, algorithms for categorization are used that are based on machine learning.

Figure 13:(a) Original Image (b)Ground truth(c)Segmented image

Conclusion

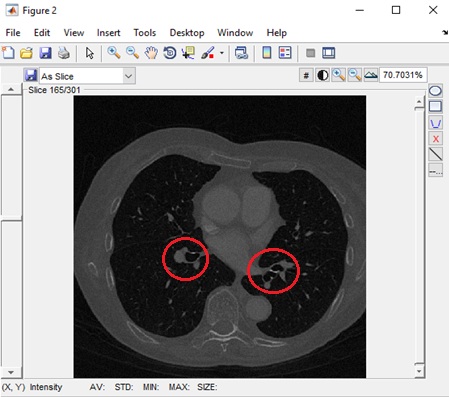
Accurate Lungs Nodule identification is critical for early Lungs Nodule detection. Thus this study 
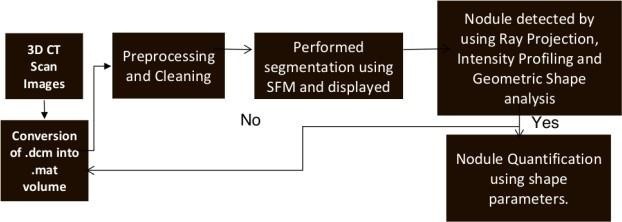
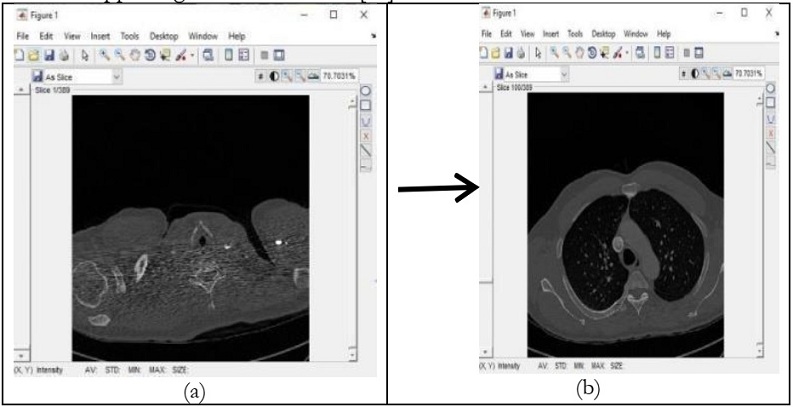
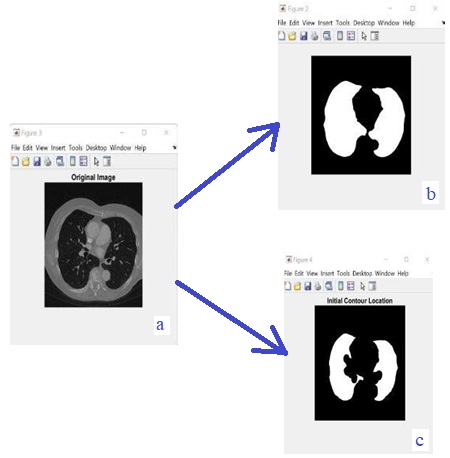
proposed a model to address nodules present in 3D CT Scan images. The proposed model preprocessed 
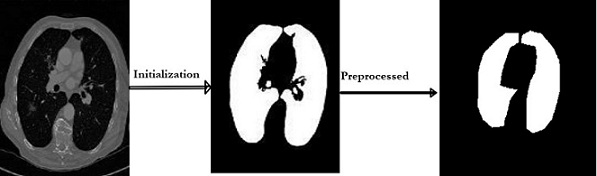
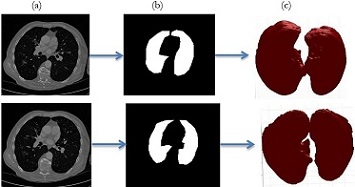
the image by removing unwanted data and segmented the data by using SFM (sparse field method) then 
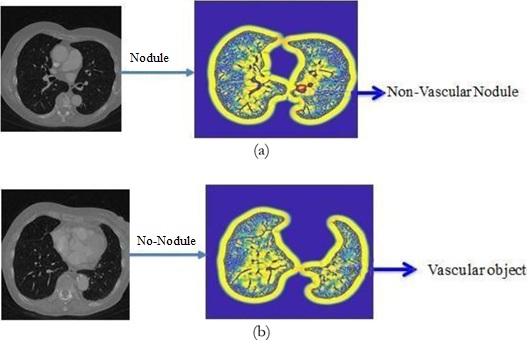
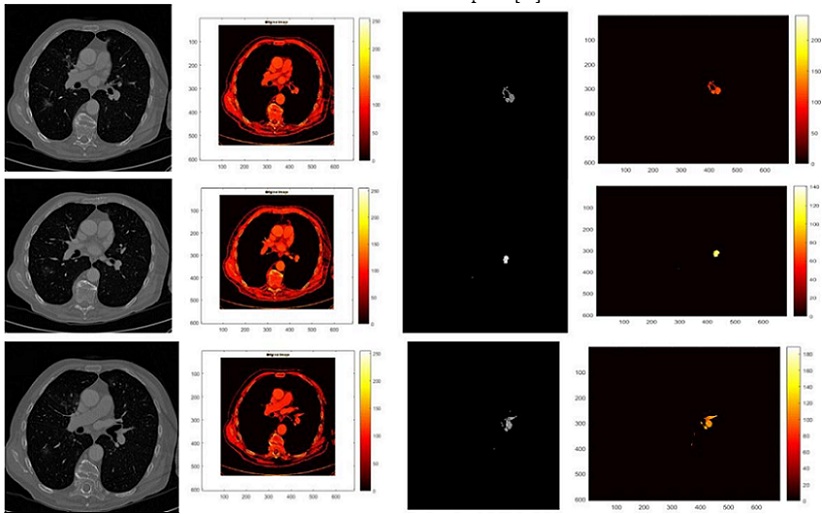
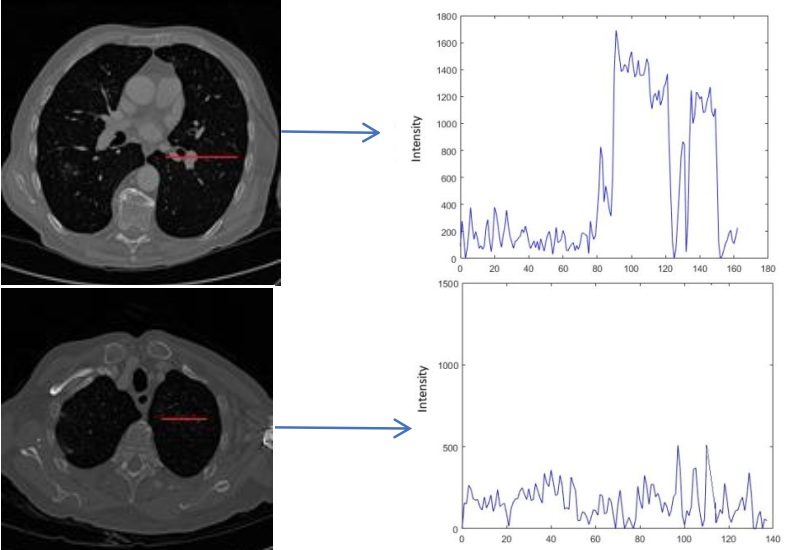
give its geometric shape and in the end detect nodules. Quantification shows the number of pixels nodule covered in the image. In the past few years, the use of computer systems and image processing to analyze medical CT images has come a long way, and many published works could be used in medical practice. In this situation, doctors need to learn more about how computer systems work in medical image processing. This will allow them to use these systems to find lung cancer early. But for these systems to be used and accepted, their flaws must be fixed. Because of this, developers and analysts need to work closely with the medical community. This way, the specific needs of CAD systems can be used to make them better. Doctors, patients, engineers, and scientists will all work together to make this happen. In this work, the use of CAD systems in processing CT images of the lungs has been looked into, and the stages of processing that are needed to make diagnoses and find lung nodules have been shown. Researchers in this field should find this information useful, and it should also encourage doctors to use these systems.

Acknowledgement

Thanks to Almighty Allah for giving me the strength, and confidence in pursuing my research work. Special thanks to my supervisors for taking time for advisory and report reading and spending a lot of time during simulations. and providing ideas for improvement My sincere gratitude to the Dean Faculty of Electrical, Electronics, and Computer Engineering for their kind interests, valuable guidance, and encouragement. Special thanks to my family and who has always been my moral support.

Conflict of Interest: The authors declare no conflict of interest in publishing this manuscript in IJIST.

Reference

[1] Y. Tadavarthi et al., “The state of radiology AI: Considerations for purchase decisions and current market offerings,” Radiol. Artif. Intell., vol. 2, no. 6, pp. 1–9, 2020, doi: 10.1148/ryai.2020200004.

[2] G. Chassagnon, M. Vakalopoulou, N. Paragios, and M. P. Revel, “Artificial intelligence applications for thoracic imaging,” Eur. J. Radiol., vol. 123, no. June 2019, 2020, doi: 10.1016/j.ejrad.2019.108774.

[3] G. Chassagnon et al., “Elastic registration-driven deep learning for longitudinal assessment of systemic sclerosis interstitial lung disease at CT,” Radiology, vol. 298, no. 1, pp. 189–198, 2020, doi: 10.1148/RADIOL.2020200319.

[4] G. Chassagnon et al., “Quantification of cystic fibrosis lung disease with radiomics-based ct scores,” Radiol. Cardiothorac. Imaging, vol. 2, no. 6, 2020, doi: 10.1148/ryct.2020200022.

[5] G. Chassagnon et al., “Deep learning–based approach for automated assessment of interstitial lung disease in systemic sclerosis on ct images,” Radiol. Artif. Intell., vol. 2, no. 4, pp. 1–10, 2020, doi: 10.1148/ryai.2020190006.

[6] G. Chassagnon et al., “AI-driven quantification, staging and outcome prediction of COVID-19 pneumonia,” Med. Image Anal., vol. 67, p. 101860, 2021, doi: 10.1016/j.media.2020.101860.

[7] G. Chassagnon, M. Vakalopolou, N. Paragios, and M. P. Revel, “Deep learning: definition and perspectives for thoracic imaging,” Eur. Radiol., vol. 30, no. 4, pp. 2021–2030, 2020, doi: 10.1007/s00330-019-06564-3.

[8] Q. Wu and W. Zhao, “Small-Cell Lung Cancer Detection Using a Supervised Machine Learning Algorithm,” Proc. - 2017 Int. Symp. Comput. Sci. Intell. Control. ISCSIC 2017, vol. 2018-February, pp. 88–91, 2018, doi: 10.1109/ISCSIC.2017.22.

[9] L. Böröczky, L. Zhao, and K. P. Lee, “Feature subset selection for improving the performance of false positive reduction in lung nodule CAD,” IEEE Trans. Inf. Technol. Biomed., vol. 10, no. 3, pp. 504–511, 2006, doi: 10.1109/TITB.2006.872063.

[10] M. Schultheiss et al., “Lung nodule detection in chest X-rays using synthetic ground-truth data comparing CNN-based diagnosis to human performance,” Sci. Rep., vol. 11, no. 1, pp. 1–10, 2021, doi: 10.1038/s41598-021-94750-z.

[11] R. Sammouda, “Segmentation and analysis of CT chest images for early lung cancer detection,” Proc. - 2016 Glob. Summit Comput. Inf. Technol. GSCIT 2016, pp. 120–126, 2017, doi: 10.1109/GSCIT.2016.29.

[12] F. Homayounieh et al., “An Artificial Intelligence-Based Chest X-ray Model on Human Nodule Detection Accuracy from a Multicenter Study,” JAMA Netw. Open, vol. 4, no. 12, pp. 1–11, 2021, doi: 10.1001/jamanetworkopen.2021.41096.

[13] N. Khehrah, M. S. Farid, S. Bilal, and M. H. Khan, “Lung nodule detection in CT images using statistical and shape-based features,” J. Imaging, vol. 6, no. 2, 2020, doi: 10.3390/jimaging6020006.

[14] R. Gruetzemacher, A. Gupta, and D. Paradice, “3D deep learning for detecting pulmonary nodules in CT scans,” J. Am. Med. Informatics Assoc., vol. 25, no. 10, pp. 1301–1310, 2018, doi: 10.1093/jamia/ocy098.

[15] E. E. Nithila and S. S. Kumar, “Segmentation of lung nodule in CT data using active contour model and Fuzzy C-mean clustering,” Alexandria Eng. J., vol. 55, no. 3, pp. 2583–2588, 2016, doi: 10.1016/j.aej.2016.06.002.

[16] D. Riquelme and M. Akhloufi, “Deep Learning for Lung Cancer Nodules Detection and Classification in CT Scans,” Ai, vol. 1, no. 1, pp. 28–67, 2020, doi: 10.3390/ai1010003.

[17] A. C. M. et al. MacMahon, Heber, David P. Naidich, Jin Mo Goo, Kyung Soo Lee, Ann NC Leung, John R. Mayo, “Guidelines for management of incidental pulmonary nodules detected on CT images: from the Fleischner Society 2017,” Radiology, vol. 284, no. 1, pp. 228–243, 2017.

[18] H. Cao et al., “A Two-Stage Convolutional Neural Networks for Lung Nodule Detection,” IEEE J. Biomed. Heal. Informatics, vol. 24, no. 7, pp. 2006–2015, 2020, doi: 10.1109/JBHI.2019.2963720.

[19] M. S. A. Dwivedi, M. R. P. Borse, and M. A. M. Yametkar, “Lung Cancer detection and Classification by using Machine Learning & Multinomial Bayesian,” IOSR J. Electron. Commun. Eng., vol. 9, no. 1, pp. 69–75, 2014, doi: 10.9790/2834-09136975.

[20] X. X. Jiang, Beibei, Nianyun Li, Xiaomeng Shi, Shuai Zhang, Jianying Li, Geertruida H. de Bock, Rozemarijn Vliegenthart, “Deep learning reconstruction shows better lung nodule detection for ultra–low-dose chest CT,” Radiology, vol. 303, no. 1, pp. 202–212, 2022.

[21] S. M. Naqi, M. Sharif, and M. Yasmin, “Multistage segmentation model and SVM-ensemble for precise lung nodule detection,” Int. J. Comput. Assist. Radiol. Surg., vol. 13, no. 7, pp. 1083–1095, 2018, doi: 10.1007/s11548-018-1715-9.

[22] X. Li et al., “Multi-resolution convolutional networks for chest X-ray radiograph based lung nodule detection,” Artif. Intell. Med., vol. 103, p. 101744, 2020, doi: 10.1016/j.artmed.2019.101744.

[23] S. Kido et al., “Segmentation of Lung Nodules on CT Images Using a Nested Three-Dimensional Fully Connected Convolutional Network,” Front. Artif. Intell., vol. 5, no. February, pp. 1–9, 2022, doi: 10.3389/frai.2022.782225.

[24] M. Schultheiss et al., “A robust convolutional neural network for lung nodule detection in the presence of foreign bodies,” Sci. Rep., vol. 10, no. 1, pp. 1–9, 2020, doi: 10.1038/s41598-020-69789-z.

[25] S. H. Rehman, Muhammad Zubair, Nazri Mohd Nawi, Aisha Tanveer, Hassan Zafar, Hamza Munir, “Lungs cancer nodules detection from CT scan images with convolutional neural networks,” Int. Conf. Soft Comput. Data Min., pp. 382–391, 2020.

[26] N. Sourlos, J. Wang, Y. Nagaraj, P. van Ooijen, and R. Vliegenthart, “Possible Bias in Supervised Deep Learning Algorithms for CT Lung Nodule Detection and Classification,” Cancers (Basel)., vol. 14, no. 16, pp. 1–15, 2022, doi: 10.3390/cancers14163867.

[27] S. Fernandes et al., “Solitary pulmonary nodule imaging approaches and the role of optical fibre-based technologies,” Eur. Respir. J., vol. 57, no. 3, 2021, doi: 10.1183/13993003.02537-2020.

[28] Q. W. Tao, Haoyi, Yuanfang Qiao, Lichi Zhang, Yiqiang Zhan, Zhong Xue, “Anatomical Structure-Aware Pulmonary Nodule Detection via Parallel Multi-task RoI Head.,” Int. Work. Predict. Intell. Med., pp. 212–220, 2021.

[29] X. F. Lu, Yu, Huanwen Liang, Shijie Shi, “Lung Cancer Detection using a Dilated CNN with VGG16,” 2021 4th Int. Conf. Signal Process. Mach. Learn., pp. 45–51, 2021.

[30] J. Zhang, K. Xia, Z. He, Z. Yin, and S. Wang, “Semi-Supervised Ensemble Classifier with Improved Sparrow Search Algorithm and Its Application in Pulmonary Nodule Detection,” Math. Probl. Eng., vol. 2021, 2021, doi: 10.1155/2021/6622935.

[31] A. Naik and D. R. Edla, Lung Nodule Classification on Computed Tomography Images Using Deep Learning, vol. 116, no. 1. Springer US, 2021. doi: 10.1007/s11277-020-07732-1.