E-ISSN:2709-6130
P-ISSN:2618-1630

Research Article

International Journal of Innovations in Science & Technology

2023 Volume 5 Number 3 July-September

Development of A Web based GIS Solution for Flood Inundation Mapping and Assessment in Lahore, Pakistan

Akhtar. M1*, Akram. S2, Hafeez. S1, Nazeer. B1 ,Ahmad. S. R1,Kundi. S1

1*College of earth and environmental sciences, University of the Punjab, Lahore, Pakistan.

2 Center for remote sensing and GIS, University of the Punjab Lahore, Pakistan.

Abstract

Introduction:
Geographic information system (GIS) is a strong tool in flood hazard mapping, mitigation, and management. GIS-based approaches provide the wayforward to measure the flood inundation. Integration of web technologies with GIS (Web-GIS) is quite significant to accomplish the aim.

Methodology:
In this research, HEC-RAS 1D was used to map the flooded areas around River Ravi at Lahore. The output of HEC-RAS with Web-GIS stack were used to build the interactive flood measuring tool. The Web-GIS stack used for this study was based on Geo Server, PHP, HTML, CSS, and JavaScript. Geo Server provides the OGC implemented standards with vendor specific capabilities like WMS Animator to animate the flood inundation on the User-Interface (UI) and extent animation to make visual interpretations. CQL filter is vendor specific capability in Geo Server used to measure the flood inundation.

Results:
The outcomes of HEC-RAS are handy enough to measure, map and present the damages not only to analyst but also to the layman. The working and animated layers are shown in result section of this research.

Conclusion:
This web-based flood inundation is robust, user-friendly, and expandable for more features, scenarios, and conditions. This research concludes that visual and web-based data is handy to understand for common person/intellectuals.


Keywords: Geo Server WMS Animator, PostgreSQL, Geo Server, JavaScript, HEC-RAS, Flood inundation, Web GIS, Remote sensing

Corresponding Author How to Cite this Article
Mahreen Akhtar, College of earth and environmental sciences, University of the Punjab, Lahore, Pakistan.
Mehreen Akhtar, Saira Akram, Sumaira Hafeez, Basit Nazeer, Sajid Rasheed Ahmad , Development of A Web based GIS Solution for Flood Inundation Mapping and Assessment in Lahore, Pakistan. IJIST. 2023 ;5(3):298-307 https://journal.50sea.com/index.php/IJIST/article/view/484

Introduction

If the drop of water is a lifeline, then it can also be a reason to agitate life. In history, disasters related to floods have been one of the major reasons for the threat to lives, livelihood, infrastructure, social activities and a primary obstacle on the way of progress that has proved as barrier for jobs, crop production and so much more [1]. Floods are one of the major disasters that give rise to poverty and various pandemic diseases. The rate of reappearance of floods is among hydrometeorological disasters that occur due to flooding of rivers [2]. Flood risk mapping and flood sanctuaries suitability analysis are crucial elements in suitable land use planning for flood-prone zones [3]. Floods can be categorized into different types based on intensity, duration, and geographic location [4]. In GIS, most of the time, flood is discussed based on its geographic location. In context of geographic location, flood are categorized as riverine flood, urban flood, and coastal flood [5][6].

Pakistan is a country where floods occur in a repeating pattern. Flood hazard mapping and shelter suiting have been a big challenge while performing rehabilitation activities. Only the mapping does not fulfill the requirements of the modern era so there exist a need to portray the overall picture so that the layman, authorities, and stakeholders can be aware of the visual effect of flood after its occurrence and assist in rehabilitation activities in a more effective way. Visualization and mitigation of floods are easier by using web development than by using a specific flood inundation software that can dynamically show effects for visualization [7]. Various WEB-based applications have been designed for the ease of users to examine various aspects of flood e.g., inquiry, meditation, maintenance, and visual interpretations [8][9]. Existing geomatic expertise, geo-spatial technology and online hypermedia cartography are significant to map the trends of floods which occurred in past in the same region that is important to create an awareness to cater such unwanted events in a better way [10].

Interactive multi-user geographic application may provide pertinent information which is very important during hazards which is shared equally with all participents performing rescue or rehabilitation activities in their area of duty. It conjointly facilitates call networks in disaster handling. The general process of disaster management involves real-time prediction, information collection, compilations, interpretations, analysis, illustrations, and decision support on web-based structures [11][12][13]. Visual and web-based data is near to develop an understanding for common person/intellectuals. Visual interpretations and communication are the best way for professionals, non-professionals, GIS experts and laymen, etc. to examine the temporal changes in pre- and post-flood situation [14]. It is not easy for programmers to record the responses of victims and to incorporate these while developing an application in each phase of flood management [15][16]. Web GIS depicts the realtime picture in such a manner that can be understood by stockholders and users. Web-based access to data and simulation models are a part of Early Warning and Monitoring Systems (EWMS) and plays a crucial role in both the survival and recovery of populations aff ected by disasters [17]. So, it can be believed that a user-friendly interface is available to interact with location-based data through Web-GIS to examine the impacts and spread of a particular phenomenon [18].

GeoServer is an open-source server written in Java that enables users to share and modify GIS data. GeoServer has been created to provide location-based data of both types including vector (OGC named as a feature) and raster (OGC named as grid coverage) along with maps by overspreading raster data as per SLD rule to create and publish georeferenced maps coded hereby mentioned as per specific standards [19]. GeoServer is considered as J2EE model that divides enterprise applications into three fundamental parts: components, containers, and connectors. [20]. Open Geospatial Consortium (OGC) is the home of geospatial innovation, collaboration, and standards [18]. OGC standards provide the Web Map Service (WMS) and Web Feature Service (WFS) which are developed to share information over the internet in such a way that can be stabilized, regularized, and improved therefore these standards are assumed to enhance their popularity and working. WMS animator is not an OGC standard; rather it is implemented as an extra feature inside Geo Server. Using animation is always an intrigue as its interpretation is easier for users. The results in visual dynamic mapy with some moving activity impact more than tabular form or static map form. WMS results in form of an image or a map in various formats like jpeg, GIF and png, etc. This utility is provided by WMS Animator; that uses WMS requests partially along with animation parameters. The rendered map images are consolidated into a solitary image format (in a configuration that bolsters multi-outline pictures). The animator is requested by using the standard keyword animate after slash like wms/animate in the URL.

Only the mapping does not fulfill the requirements of the modern era. There is a need arises to automate the system so the layman, authorities, and stakeholders can be aware of visual effect of each phase of flood. Estimation and mitigation of flood are easier by using web development than using a specific flood inundation software that can dynamically show effect for vivid visualization to a non-GIS person.

Objectives:
The aim of this study is GIS-based visualization of flood inundation for different stakeholders like engineers, and disaster management authorities that include the complete development of a Web-GIS application from backend to frontend, which conforms different OGC standards like WMS, WFS, and vendor-specific standards i.e., WMS animator. It will allow spatially linked users to simultaneously analyze the flood extent and to answer multiple quries e.g., how much of the user-selected area is under the influence of flood, which kindly of landuse has been effected, what is the next destination or the trend of flood.

Novelty Statement:
This research is novel because PostgreSQL may be an objectrelational management system having a generic purpose. After all, it is most advanced opensource database system than other databases to handle large amounts of data with very quick response needed by the Client as the client feels uncomfortable with slow responsive databases and systems for extraction of GIS-based results of flood inundation. It will allow multiple users simultaneously to analyze the flood extent and will answer the questions like how much of user-selected area is under influence of flood, which help different stakeholders in making decisions.

Material and Method

Lahore stands on second rank based on demography and the river Ravi passes through it. According to the Indus Water Treaty of 1960, Ravi River with two other rivers was given in the control of India. In every monsoon season, the water level rises and India loses its hold on water. Basic data for flood modeling and map generation was collected from different resources are given in Table 1.

Table 1:Data collection sources.

The data was incorporated into HEC-RAS to map the inundation of flood. Flood velocity at bank and different reaches were calculated through HEC-RAS and the maps were developed in Web-GIS.

Figure 1:Flow chart of Web development

Figure 1 shows the step by step methodology used in this research. WEB-GIS application is designed to publish the hydraulic flood maps created in HEC-RAS [21] and finally the animation of flood effects. Two technologies including web services and animation were joined together through GeoServer WMS animator having two segments front end, and back end. The front end is supported by Ajax, Html, CSS, PHP, and GeoJson. The backend is supported by GeoServer, leaflet, PostgreSQL, and PostGIS. PostgreSQL is free and opensource software that gives the functionality of data transactions with the advanced method of keeping both the client and server sides apart, making the client-side library lighter [22][23].

This application follows the waterfall development model. This model works well for projects in which quality control is a major concern because of its intensive documentation and planning [24]. Every component was designed according to the water development model. This model includes the completion of each phase before the beginning of the next phase. It is a simple and useful model which is known as the linear-sequential life cycle model. Here the two technologies including web services and animation were joined together through GeoServer WMS animator. The basic utilities were provided to interpret and assess the area affected by the flood. The animation was created using buffers on different ranges of water. The outcomes of this system may portray the situation of flood while clicking any point on the map

The GeoServer WMS animator is used to create an animation to show the areas under risk with different colors at different ranges. The query is passed through Cql filter in GeoServer which gives a response in GIF format because the GeoServer WMS animator displays an animation in .GIF format by default. This view is passed to Leaflet which was shown as a layer in UI. All the tools are based on open-source utilities. A few steps in sequential order i.e. a code writing environment like visual studio code with the addition of a vector or raster based maps are fetched using javascript code [25].

The addition of this layer requires the connection name, hostname, database name, username, password, and port. After adding this layer, all the tables inside our database in PostgreSQL were accessible in QGIS. All the layers were imported and the Symbology tab was saved in .SLD format to give its own style to the layers in GeoServer preview (Figure 2).

The WFS requests to the GeoServer, just like WMS, require a standard format and some of the parameters along with the version name of the WFS request. The application uses the 1.1.0 version of the WFS that get post request to get the route from the GeoServer parametric view in the GeoJson format. Creating animation is a time-dimension process. It requires time as input in any of the following formats and the variable that needs to be animated. To check the expansion of water in the area, 15 buffers of different ranges were created following time dimension at distance in QGIS, the resulting table was stored in PostgreSQL.

Result

In Figure 3, the Web interface is displayed with the coordinates of the ground. The user interface is user-friendly and provides the efficiency for a user to interact with the application effectively. Whereas Figure 4 shows the panel to run animation of water extent and area under damage due to flood water. The application uses the 1.1.0 version of the WFS to compute the route from the GeoServer in the GeoJson format.

Figure 2:SLD created by QGIS inserted into GeoServer (Source: Geoserver).

Figure 3:User Interface (Source: Geoserver).

Figure 4:Flood animation application covering area (Source: Geoserver)

Figure 4 shows the visual interpretations of flood by all aspects. Results of Inundation of HEC-RAS can be understood by an analyst in various aspects e.g., velocity, stress, and area coverage of flood at any point. All the information is shown on the application with symbology and cartographic(Figure 5).

Figure 5:Flood extent of river through Animation (Source: Geoserver)

Figure 6: Final WEB-GIS User Interface (Source: Geo server).

The outcome of the WEB-GIS Interface is shown in Figure 6, where the user can switch the base map according to requirement. Both the satellite imagery and topographic map are displayed to get the expension of water and the 8area under risk through animation.

Discussion

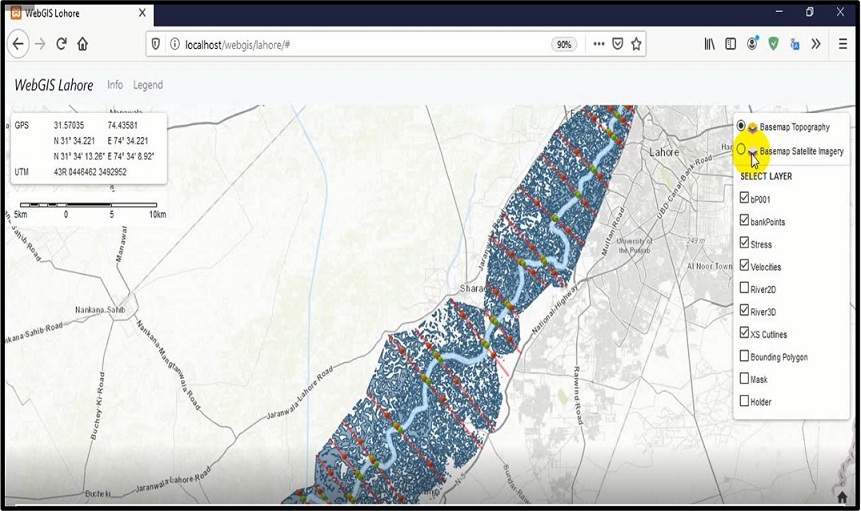
This research express the effects of flood in all aspects through animation so that these can be publicly available. There are so many benefits of online map like they are tranquilly controlled and their display speed is more rapid with the selection panel of the base map which shows topographic features [10].

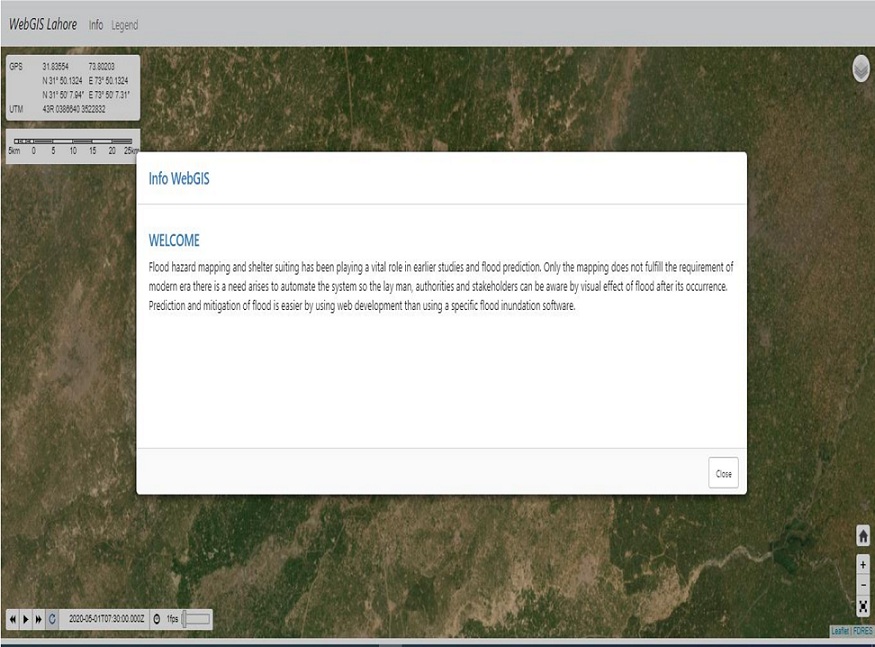
Visual interpretations give more vivid information and a detailed story to laymen. Not only the Inundation of HEC-RAS can be understood by an analyst but other aspect e.g., velocity, stress, and area coverage information is available on click. Available open-source development provide easy and robust platforms to facilitate user in different domains of daily life.

Limitations:
In our case, it was challenging to examine the flow of water that is an essential element while flood modelling. Geo Server WMS Animator gives animation only in GIF format which restricts the functionality of maps. Styles in Geo Server are difficult to design so there was a need to add XML files from QGIS styles.

Recommendations:
Several Future improvements could make the flood risk assessment and subsequent analysis more functional and realistic. Practically, boundless improvements can be made in the flood risk assessment and ultimately in the inundation. A continuation of this research might include various improvements. One can add filters of different water ranges to check the spread of floods. The flow data of different times and the information about soil type is essential to improve the flood risk damages. A connected geodatabase can store and run animation on the given data so that other users can also access datasets and information related to the flood in the animated form.

Conclusion

The objective of this research was to automate the flood results of HEC-RAS. So, the maps have sufficient information for the both layman and for the analyst. The tables, facts, and outputs were presented in Web-GIS via backend coding available on click at the point with their location coordinates, coordinate system, velocity and stress, etc.

This research showed that Leaflet selection proves to be one of the best open-source mapping libraries freely available as compared to others because of its broad range of features and flexibility

Geo Server WMS Animator is a good animation tool that provides an animation built-in tool than the rest to use animation analysis.

This study also reported that Geo Server is one of the best choices among free and opensource map servers available, as it offers many OGC services.

After the combination of GIS capabilities including web skills and technologies, it becomes easier for users to get different geospatial datasets without purchasing costly GIS software instead that they can use a web browser [26].

Conflict of Interest Statement:The authors have no conflict of interest in publishing this research with IJIST.

Project Details:Nil

Acronyms:

AJAX: Asynchronous JavaScript and XML

API: Application Programming Interface

CRS: Coordinate Reference System

CSS: Cascading Style Sheet

DB: Database

DBMS: Database Management System

GIS: Geographic Information System

GML: Geographic Markup Language

HTML: Hypertext Markup Language

JS: JavaScript

JSON: JavaScript Object Notation

OGC: Open Geospatial Consortium

OSM: Open Street maps

SQL: Structured Query Language

SRID: Spatial Reference Identification

SRS: Spatial Reference System

UI: User Interface

URI: Universal Resource Identifier

URL: Uniform Resource Locator

WFS: Web Feature Service

WMS: Web Mapping Service

XLink: XML Linking Language

XML: Extensible Markup Language

SLD: Styled Layer Descriptor

GUI: Graphical User Interface

QGIS: Quantum Geographical Information System

Reference

[1] K. Uddin, D. R. Gurung, A. Giriraj, and B. Shrestha, “Application of Remote Sensing and GIS for Flood Hazard Management: A Case Study from Sindh Province, Pakistan,” Am. J. Geogr. Inf. Syst., vol. 2, no. 1, pp. 1–5, Dec. 2013, doi: 10.5923/J.AJGIS.20130201.01.

[2] T. Tingsanchali, “Urban flood disaster management,” Procedia Eng., vol. 32, pp. 25–37, Jan. 2012, doi: 10.1016/J.PROENG.2012.01.1233.

[3] A. T. N. Dang and L. Kumar, “Application of remote sensing and GIS-based hydrological modelling for flood risk analysis: a case study of District 8, Ho Chi Minh city, Vietnam,” http://www.tandfonline.com/action/journalInformation?show=aimsScope&journalCode=tgnh20# .VsXodSCLRhE, vol. 8, no. 2, pp. 1792–1811, Dec. 2017, doi: 10.1080/19475705.2017.1388853.

[4] K. Khosravi et al., “A comparative assessment of flood susceptibility modeling using Multi-Criteria Decision-Making Analysis and Machine Learning Methods,” J. Hydrol., vol. 573, pp. 311–323, Jun. 2019, doi: 10.1016/J.JHYDROL.2019.03.073.

[5] A. A. Memon, S. Muhammad, S. Rahman, and M. Haq, “Flood monitoring and damage assessment using water indices: A case study of Pakistan flood-2012,” Egypt. J. Remote Sens. Sp. Sci., vol. 18, no. 1, pp. 99–106, Jun. 2015, doi: 10.1016/J.EJRS.2015.03.003.

[6] K. Chohan et al., “Riverine Flood Damage Assessment of Cultivated Lands along Chenab River Using GIS and Remotely Sensed Data: A Case Study of District Hafizabad, Punjab, Pakistan,” J. Geogr. Inf. Syst., vol. 7, no. 5, pp. 506–526, Sep. 2015, doi: 10.4236/JGIS.2015.75041.

[7] S. Mourato, P. Fernandez, F. Marques, A. Rocha, and L. Pereira, “An interactive Web-GIS fluvial flood forecast and alert system in operation in Portugal,” Int. J. Disaster Risk Reduct., vol. 58, p. 102201, May 2021, doi: 10.1016/J.IJDRR.2021.102201.

[8] S. Steiniger and A. J. S. Hunter, “The 2012 free and open source GIS software map – A guide to facilitate research, development, and adoption,” Comput. Environ. Urban Syst., vol. 39, pp. 136–150, May 2013, doi: 10.1016/J.COMPENVURBSYS.2012.10.003.

[9] A. T. Kulkarni, J. Mohanty, T. I. Eldho, E. P. Rao, and B. K. Mohan, “A web GIS based integrated flood assessment modeling tool for coastal urban watersheds,” Comput. Geosci., vol. 64, pp. 7–14, Mar. 2014, doi: 10.1016/J.CAGEO.2013.11.002.

[10] J. Zavala-Hidalgo, A. Fernández-Eguiarte, R. Romero-Centeno, and O. ZavalaRomero, “Digital Atlas of Mexico Provides Accessible Climate Information,” Eos, Trans. Am. Geophys. Union, vol. 91, no. 14, pp. 125–126, Apr. 2010, doi: 10.1029/2010EO140001.

[11] I. Demir et al., “Data-Enabled Field Experiment Planning, Management, and Research Using Cyberinfrastructure,” J. Hydrometeorol., vol. 16, no. 3, pp. 1155–1170, Jun. 2015, doi: 10.1175/JHM-D-14-0163.1.

[12] P. H. Hsu, S. Y. Wu, and F. T. Lin, “Disaster management using GIS technology: A case study in Taiwan.” pp. 1510–1519, 2005. Accessed: Apr. 25, 2023. [Online]. Available: https://researchoutput.ncku.edu.tw/en/publications/disastermanagement-using-gis-technology-a-case-study-in-taiwan

[13] W. F. Krajewski et al., “Real-Time Flood Forecasting and Information System for the State of Iowa,” Bull. Am. Meteorol. Soc., vol. 98, no. 3, pp. 539–554, Mar. 2017, doi: 10.1175/BAMS-D-15-00243.1.

[14] Z. C. Aye, T. Sprague, V. J. Cortes, K. Prenger-Berninghoff, M. Jaboyedoff, and M. H. Derron, “A collaborative (web-GIS) framework based on empirical data collected from three case studies in Europe for risk management of hydro-meteorological hazards,” Int. J. Disaster Risk Reduct., vol. 15, pp. 10–23, Mar. 2016, doi: 10.1016/J.IJDRR.2015.12.001.

[15] I. Demir, E. Yildirim, Y. Sermet, and M. A. Sit, “FLOODSS: Iowa flood information system as a generalized flood cyberinfrastructure,” https://doi.org/10.1080/15715124.2017.1411927, vol. 16, no. 3, pp. 393–400, Jul. 2017, doi: 10.1080/15715124.2017.1411927.

[16] E. Yildirim and I. Demir, “An integrated web framework for HAZUS-MH flood loss estimation analysis,” Nat. Hazards, vol. 99, no. 1, pp. 275–286, Oct. 2019, doi: 10.1007/S11069-019-03738-6/METRICS.

[17] H. J. Henriksen, M. J. Roberts, P. van der Keur, A. Harjanne, D. Egilson, and L. Alfonso, “Participatory early warning and monitoring systems: A Nordic framework for web-based flood risk management,” Int. J. Disaster Risk Reduct., vol. 31, pp. 1295– 1306, Oct. 2018, doi: 10.1016/J.IJDRR.2018.01.038.

[18] “(PDF) WebGIS for water level monitoring and flood forecasting using Open Source Technology.” https://www.researchgate.net/publication/343181650_WebGIS_for_water_level_m onitoring_and_flood_forecasting_using_Open_Source_Technology (accessed Apr. 25, 2023).

[19] “GeoServer The Open Source Solution for the interoperable management of geospatial data @ GFOSS Day 2013.” https://www.slideshare.net/geosolutions/geoserver-the-open-source-solution-forthe-interoperable-management-of-geospatial-data (accessed Apr. 25, 2023).

[20] Z. Huang and Z. Xu, “A method of using geoserver to publish Economy Geographical Information,” 2011 Int. Conf. Control. Autom. Syst. Eng. CASE 2011, 2011, doi: 10.1109/ICCASE.2011.5997789.

[21] M. Bhandari, N. Nyaupane, S. R. Mote, A. Kalra, and S. Ahmad, “2D Unsteady Flow Routing and Flood Inundation Mapping for Lower Region of Brazos River Watershed,” World Environ. Water Resour. Congr. 2017 Hydraul. Waterw. Water Distrib. Syst. Anal. - Sel. Pap. from World Environ. Water Resour. Congr. 2017, pp. 292–303, 2017, doi: 10.1061/9780784480625.027.

[22] A. Viloria, G. C. Acuña, D. J. A. Franco, H. Hernández-Palma, J. P. Fuentes, and E. P. Rambal, “Integration of Data Mining Techniques to PostgreSQL Database Manager System,” Procedia Comput. Sci., vol. 155, pp. 575–580, Jan. 2019, doi: 10.1016/J.PROCS.2019.08.080.

[23] M. G. Jung, S. A. Youn, J. Bae, and Y. L. Choi, “A study on data input and output performance comparison of MongoDB and PostgreSQL in the big data environment,” Proc. - 8th Int. Conf. Database Theory Appl. DTA 2015, pp. 14–17, Mar. 2016, doi: 10.1109/DTA.2015.14.

[24] A. Alshamrani and A. Bahattab, “A Comparison Between Three SDLC Models Waterfall Model, Spiral Model, and Incremental/Iterative Model”, Accessed: Apr. 25, 2023. [Online]. Available: www.IJCSI.org

[25] D. Edler and M. Vetter, “The Simplicity of Modern Audiovisual Web Cartography: An Example with the Open-Source JavaScript Library leaflet.js,” KN - J. Cartogr. Geogr. Inf., vol. 69, no. 1, pp. 51–62, May 2019, doi: 10.1007/S42489-019-00006- 2/FIGURES/13.

[26] K. Kalabokidis et al., “Virtual Fire: A web-based GIS platform for forest fire control,” Ecol. Inform., vol. 16, pp. 62–69, Jul. 2013, doi: 10.1016/J.ECOINF.2013.04.007.