Flood Inundation Modeling and Damage Assessment in Lahore Using Remote Sensing
Abbas. Z1, Akhtar. M1, Akram. S2, Hafeez. S1 ,Ahmad, S. R1,
1 College of earth and environmental sciences, University of the Punjab, Lahore, Pakistan.
2 Center for Remote Sensing and GIS, University of the Punjab, Lahore, Pakistan
Introduction:
Ravi River has a great contribution to the glorious history of Lahore City, the second biggest city in Pakistan. But similar to all rivers of Pakistan, River Ravi occasionally experiences extreme floods. During the past 100 years, two extremely high floods created devastation in Lahore City, which caused enormous loss of properties and lives. To save the main metropolitan areas of Lahore in both these floods, the Shahdara Breaching section, on the western bank of the river, was operated. The potential of loss due to floods has increased even more owing to the rise in population, industrialization, and spring of unplanned settlements in the floodplain of the river.
Importance of Study:
This research provides a solution that has the potential for long-term effects in flood management, hygienic improvement of the area, planned urban development around the river, and improvement of sub-surface water quality.
Novelty Statement:
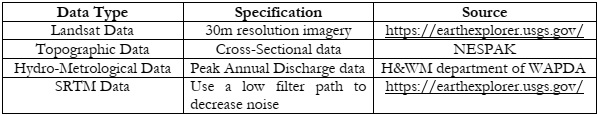
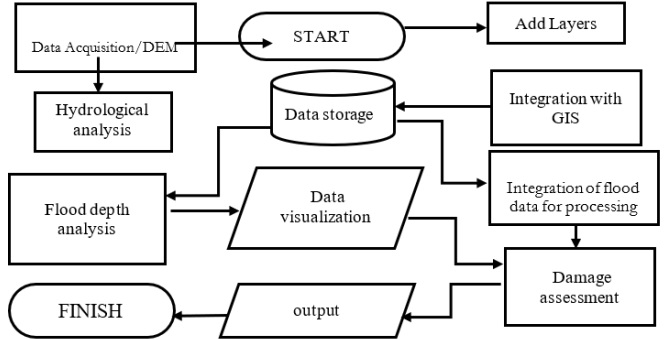
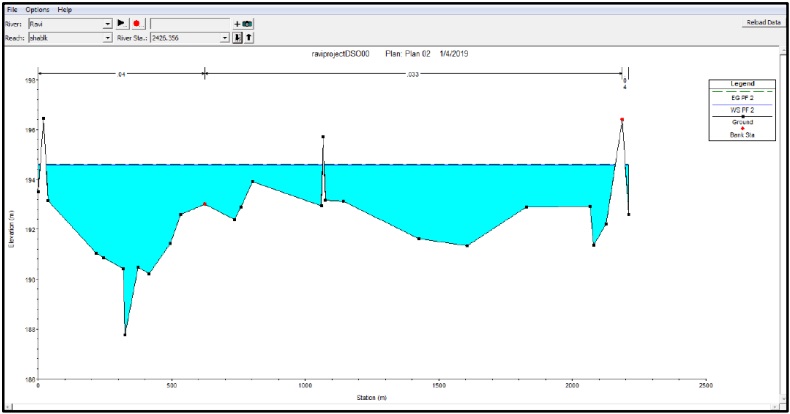
The present study is focused on determining the flood damage assessment using advanced geospatial techniques with HEC-RAS applications.Materials and Methods:
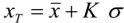
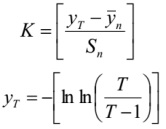
The selected reach of the Ravi River is from Shahdra to Balloki reach. Flood frequency analysis was performed to calculate a flood return period of five and fifty years, Hydraulic modeling of the river on HEC-RAS is used to find river capacity, its Validation, calibration, assessment of hydraulic capacity, Flood inundation extent, and depth analysis.
Results:
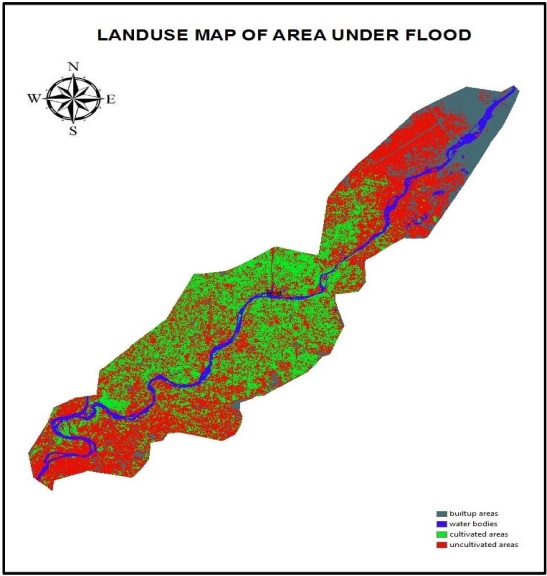
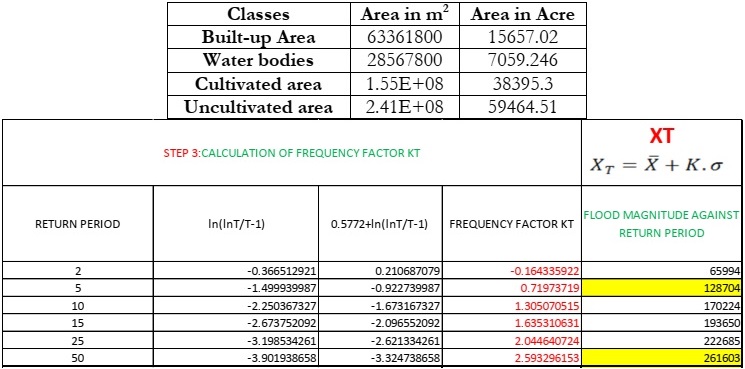
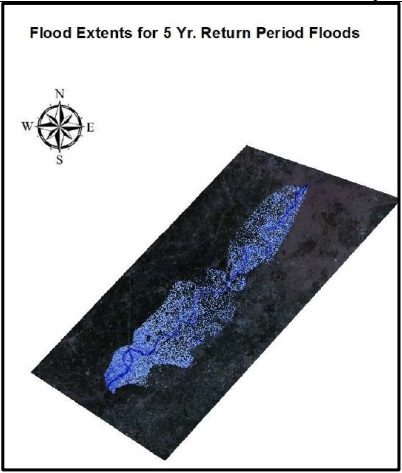
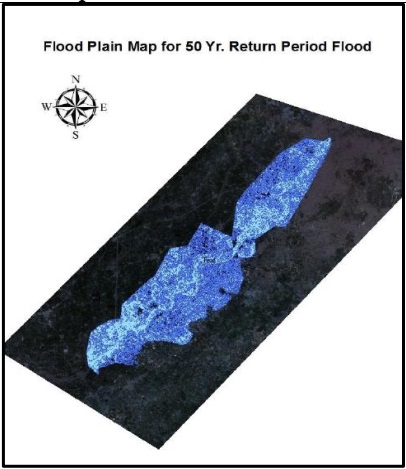
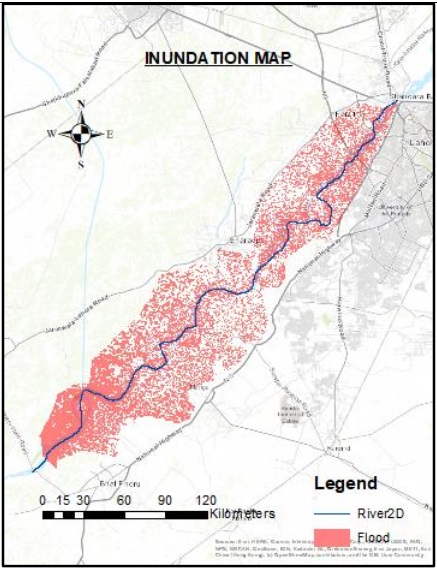
It is concluded that a flood of 3643.97 cumecs magnitude corresponds to 5 years return period and 7406.699 cumecs magnitude corresponds to 50 years return period. If the same phenomena occur in a repeating manner, then the built-up settlement near Ravi can meet alarming threats. According to the maximum likelihood classification the damaged buildup area was 15657 acres, the water body was 7059.246 acres, the cultivated area was 38395.3 acres, and uncultivated 59464.51 acres were affected
Conclusion:
The solution can also address the problems arising due to changes in river course and depletion of natural habitat.
Recommendations:
However, along the Lahore City, the required width is not available. In this condition, an engineering solution is mandatory to pass the flood. Channelization can be proposed to create the width of the River. The reclaimed land should be used for high-quality urban development to increase revenues. For the sake of channel stability, a detailed sediment study should be done.
Keywords: Flood, HEC-RAS, Remote sensing and GIS, Inundation, Damage Assessment, Hydrological modeling
| Corresponding Author | How to Cite this Article |
|---|---|
| , College of earth and environmental
sciences, University of the Punjab, Lahore, Pakistan |
Zunaira Abbas, Mehreen Akhtar, Saira Akram, Sumaira Hafeez, Sajid Rasheed Ahmad , Flood Inundation Modeling and Damage Assessment in Lahore Using Remote Sensing. IJIST. 2023 ;5(4):638-647 https://journal.50sea.com/index.php/IJIST/article/view/491 |