The pre-flood and post-flood analysis of Barwai Khwar using high-resolution aerial
imagery provided valuable insights into the extent of damage and changes in the landscape
caused by the flood event. On 25 August, Pakistan announced a state of emergency in response
to the flooding. On 1 September 2022, residents of Madyan in Pakistan's Swat Valley walk past
homes damaged by the flooding. Continuous monitoring and analysis of such data are crucial
for adapting to the dynamic natural environment and minimizing future flood impacts. The
flood event in Barwai Khwar, Swat, KPK, had far-reaching consequences that reshaped the
landscape and impacted the lives of the local population.
Land cover analysis revealed significant alterations caused by the flood, particularly in
agricultural areas and settlements. Floodwaters and sediment deposition transformed onceproductive lands, posing challenges
to agriculture and livelihoods. Additionally, the flood's force
and velocity caused erosion in some areas, leading to the loss of fertile topsoil and natural habitat.
To minimize future impacts, a comprehensive understanding of the environmental and
socioeconomic consequences is essential. Implementing measures that address both immediate
recovery and long-term resilience will be vital in supporting the affected communities and
safeguarding the region against similar events in the future.
After the flood, the active river flow significantly impacted and altered the landscape in
Barwai Khwar, Swat, KPK. The forceful flow of floodwater damaged and reshaped large
portions of agricultural land as shown in the above pre-flood image from point A to B, eroding
fertile topsoil and posing challenges for farmers. Moreover, one retaining wall, which likely
served as a flood defense structure, was unable to withstand the intensity of the flood, leading
to its failure.
The area between points C and D (Figure 4) experienced extensive damage to
agricultural land due to the forceful flow of floodwaters. The flood resulted in the destruction
of one bridge in the region between points C and D. The high-velocity floodwaters and debris
might have caused the bridge's structural integrity to fail, disrupting transportation and
connectivity in the area. The force of the flood likely overwhelmed one retaining wall in this
stretch. This wall, designed to hold back floodwaters and prevent damage to surrounding areas,
could not withstand the immense pressure, leading to its failure and leaving the adjacent areas
exposed to further flooding and erosion risks.
Between points E and F (Figure 5), there is a relatively smaller area of agricultural land
that exhibits signs of damage, contrasting with the surrounding regions. The damage likely
results from natural factors such as erosion or soil degradation, possibly exacerbated by adverse
weather conditions. Furthermore, in this specific section, two retaining walls have also been
affected, likely due to the increased pressure or impact from the damaged land. The cause of the
damage could be linked to factors like improper drainage, lack of maintenance, or a recent
natural event. Addressing these issues promptly is crucial to prevent further deterioration and
safeguard the agricultural land and retaining walls in the area.
Under mentioned Python based code is capable of extraction of flood extent from arial
photograph
import cv2
import numpy as np
def extract_water_extent(image_path):
# Load the aerial photograph
image = cv2.imread(image_path)
# Convert the image to HSV color space
hsv_image = cv2.cvtColor(image, cv2.COLOR_BGR2HSV)
# Define the lower and upper bounds for detecting water in HSV color space
lower_bound = np.array([90, 100, 100])
upper_bound = np.array([120, 255, 255])
# Threshold the image to get a binary mask
mask = cv2.inRange(hsv_image, lower_bound, upper_bound)
# Find contours in the mask
contours, _ = cv2.findContours(mask, cv2.RETR_EXTERNAL,
cv2.CHAIN_APPROX_SIMPLE)
# Calculate the total area of water
total_water_area = 0
for contour in contours:
total_water_area += cv2.contourArea(contour)
# Calculate the percentage of water area in the image
total_image_area = image.shape[0] * image.shape[1]
water_extent_percentage = (total_water_area / total_image_area) * 100
return water_extent_percentage
if __name__ == "__main__":
image_path = "path_to_your_aerial_image.jpg"
water_extent_percentage = extract_water_extent(image_path)
print(f"The extent of water in the image is approximately
{water_extent_percentage:.2f}%")
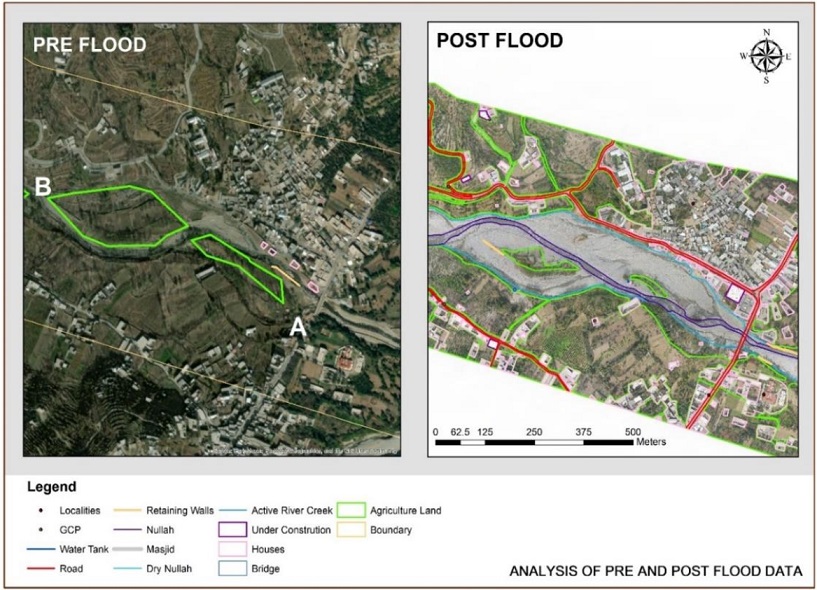
Figure 3:Analysis of Pre and Post Flood Data from point A to B
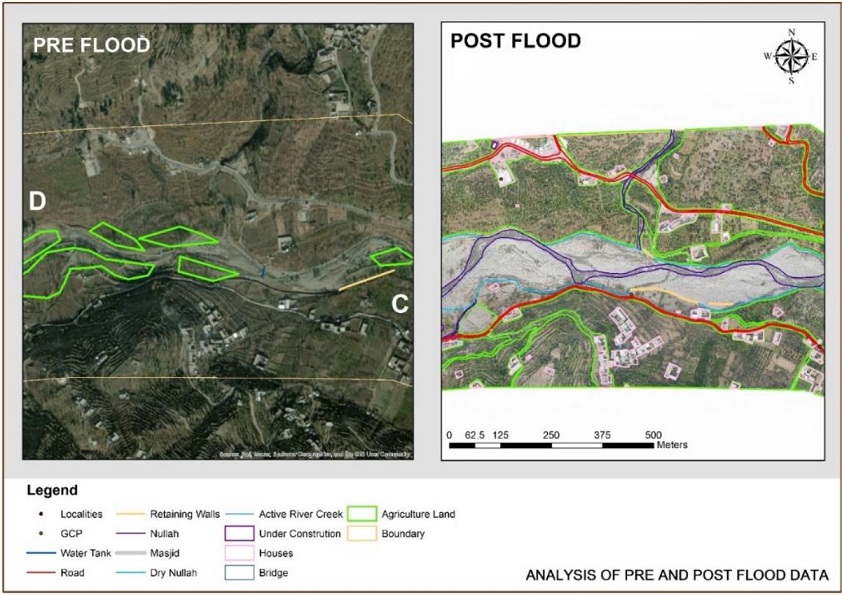
Figure 4:Analysis of Pre and Post Flood Data from point C to D
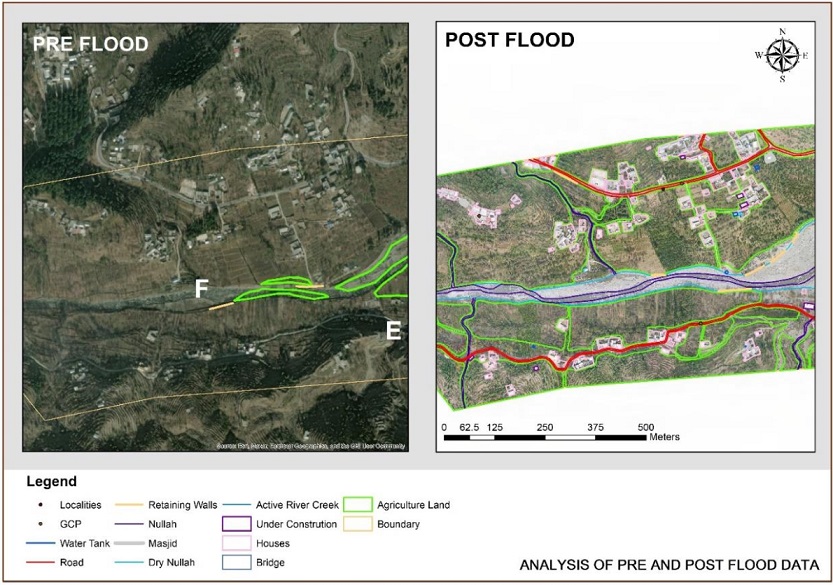
Figure 5:Analysis of Pre and Post Flood Data from point E to F
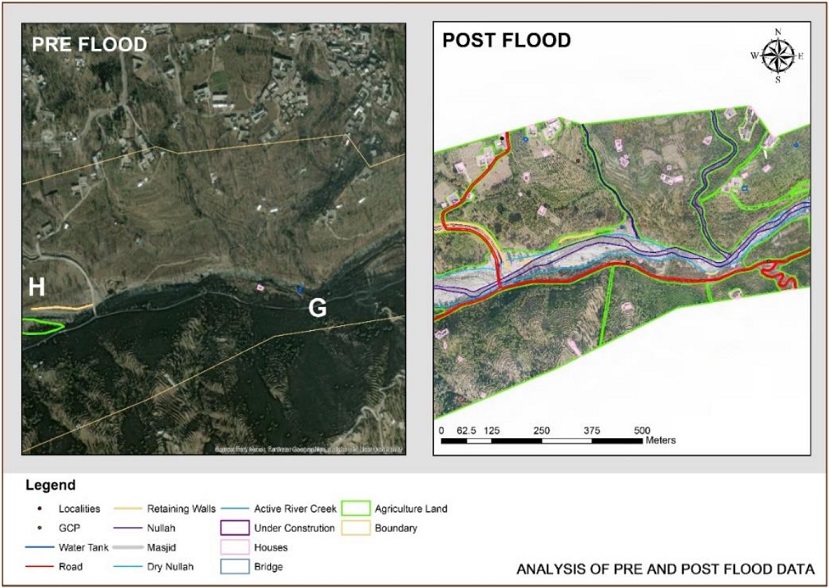
Figure 6:Analysis of Pre and Post Flood Data from point G to H
Between points G and H (Figure 6), the area is marked by a mix of varying impacts from
a previous disaster. The agricultural land in this region has experienced the least damage
compared to other areas nearby. This suggests that the local farmers might have taken effective
measures to protect their crops and fields during the calamity, showcasing their resilience and
ability to adapt.
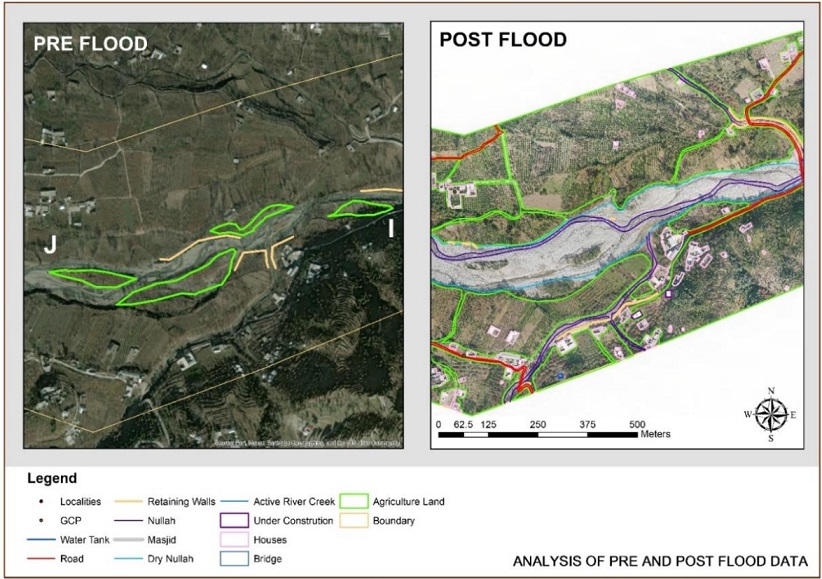
Figure 7:Analysis of Pre and Post-Flood Data from point I to J
However, there is evidence of some structures being affected by the disaster. One house
near a collapsed bridge has suffered damage, indicating the destructive force of the disaster on
buildings in the area. Additionally, a retaining wall is also damaged, reflecting the challenges in
maintaining infrastructure during such events. Overall, this landscape demonstrates the complex
nature of disasters, with certain areas faring better due to the proactive efforts of the farming
community, while others show the impact on buildings and structures in the vicinity.
Between points I and J, (Figure 7) the landscape reveals the devastating impact of the
flood, particularly on retaining walls and agricultural land. In this area, around four to five
retaining walls have been severely damaged, indicating the immense force and water pressure
brought by the flood. The destruction of these walls might have contributed to the flooding,
exacerbating its effects on the surrounding land. Moreover, the agricultural land in this region
has suffered significant damage, with portions of it being reshaped or even relocated due to the
force of the floodwaters. This implies that the flood not only caused immediate damage but also
altered the topography and layout of the farmlands, posing further challenges to the local
farmers.
The region between points K and L (Figure 8) was devastated by a destructive flood,
leading to extensive damage across the area. Two residential areas were severely affected, leaving
properties and homes in ruins. Additionally, a substantial retaining wall collapsed, posing a
further threat to the stability of the region. The floodwaters also wreaked havoc on a large scale
of agricultural land, causing substantial damage to crops and agricultural infrastructure. The aftermath of the flood
necessitated urgent response and recovery efforts to repair and rebuild
the damaged residential areas, reconstruct the collapsed retaining wall, and rehabilitate the
agricultural land to restore livelihoods and stability to the affected communities.
In the region from point M to N (Figure 9), the flood has primarily impacted a large area
of agricultural land, with minimal damage to other structures or infrastructure. The floodwaters
likely inundated the agricultural fields, leading to soil erosion, crop damage, and possible
contamination from floodwaters. However, due to the absence of significant damage to
residential areas or infrastructure in this specific region, the focus of the response and recovery
efforts would primarily be on agricultural rehabilitation.
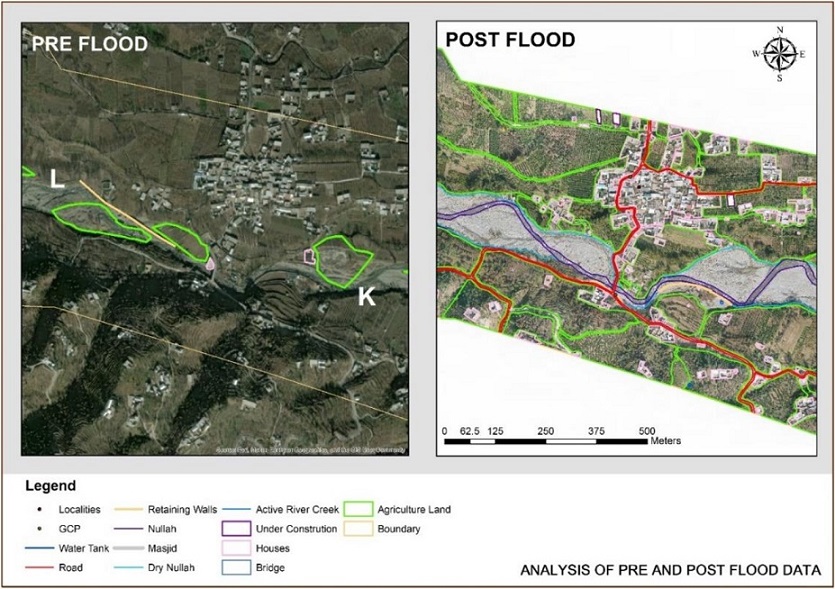
Figure 8:Analysis of Pre and Post Flood Data from point K to L
The next area, extending from point O to P (Figure 10), experienced significant damage
during the flood. The floodwaters caused extensive destruction to a large portion of agricultural
land in the region, leading to soil erosion, crop loss, and potential contamination. Alongside this,
a crucial long length of retaining wall, which was attached to a bridge in the area, was also
severely damaged, posing risks to the stability of the bridge and further hindering transportation
and connectivity. Furthermore, one house located near the agricultural land was affected by the
flood, resulting in structural damage and potential displacement of residents.
The area between points Q and R (Figure 11) has experienced significant damages caused
by the flood, affecting both residential areas and agricultural land. The floodwaters have
inundated and damaged several residential properties, leading to structural damage and rendering
homes uninhabitable. Residents in this area may have faced displacement and loss of belongings
due to the flood's impact. Additionally, the flood has wreaked havoc on the agricultural land in
this region, resulting in soil erosion, crop damage, and potential contamination.
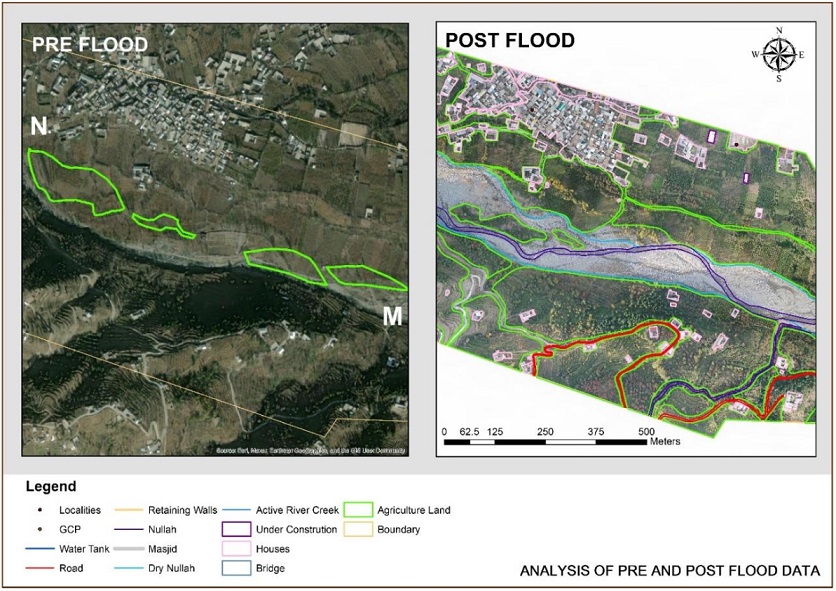
Figure 9:Analysis of Pre and Post Flood Data from point M to N
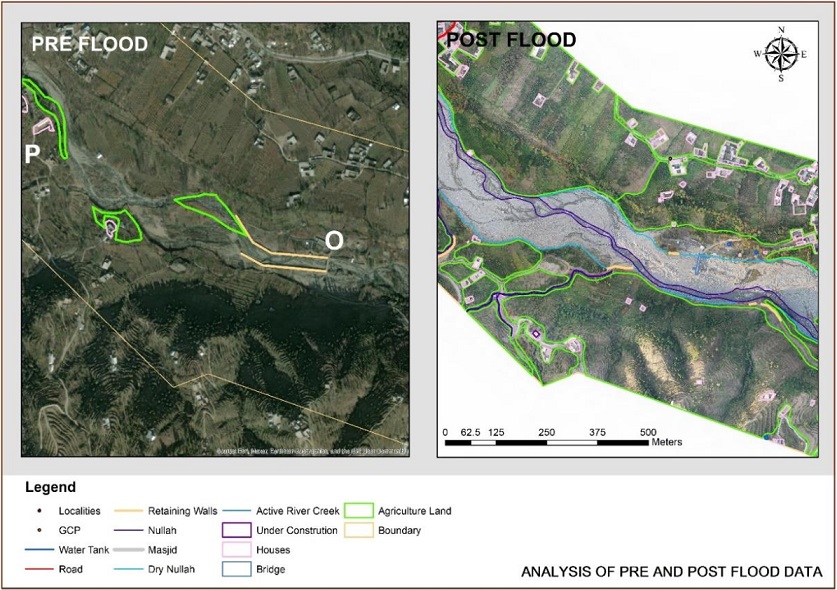
Figure 10:Analysis of Pre and Post Flood Data from point O to P
Between points S and T (Figure 12), the flood has caused multiple damages, including
three retaining walls, and a small area of agricultural land damage that has been affected. The
collapse or damage of the three retaining walls poses a risk of further erosion and instability in
the area. The floodwaters have also impacted a portion of agricultural land, resulting in crop loss
and soil damage, which could affect local farmers' livelihoods.
In the region between points U and V (Figure 13), there is evidence of flood damage,
including a damaged retaining wall and affected areas of agricultural land. The flood has caused
one retaining wall to collapse or sustain damage, potentially leading to land instability and posing
risks to nearby infrastructure or transportation routes.
Between points W and X (Figure 14), the width of the Nullah has decreased, resulting in
the minimization of flood flow. While this reduction in water flow may seem beneficial, it has
still caused damage to one retaining wall and small areas of agricultural land. The decreased flood
flow can lead to a gradual accumulation of water, causing localized flooding in certain areas. This
has resulted in damage to a retaining wall, which might have been unable to withstand the
pressure from the accumulated water. Additionally, the small areas of agricultural land in this
region have been affected by water stagnation, resulting in soil waterlogging, decreased crop
productivity, and potential crop damage due to prolonged submersion.
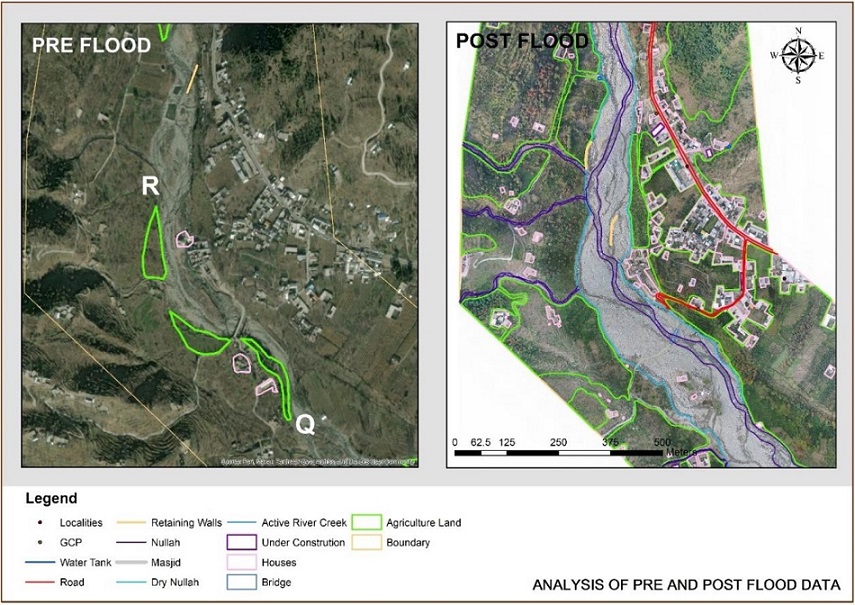
Figure 11:Analysis of Pre and Post Flood Data from point Q to R
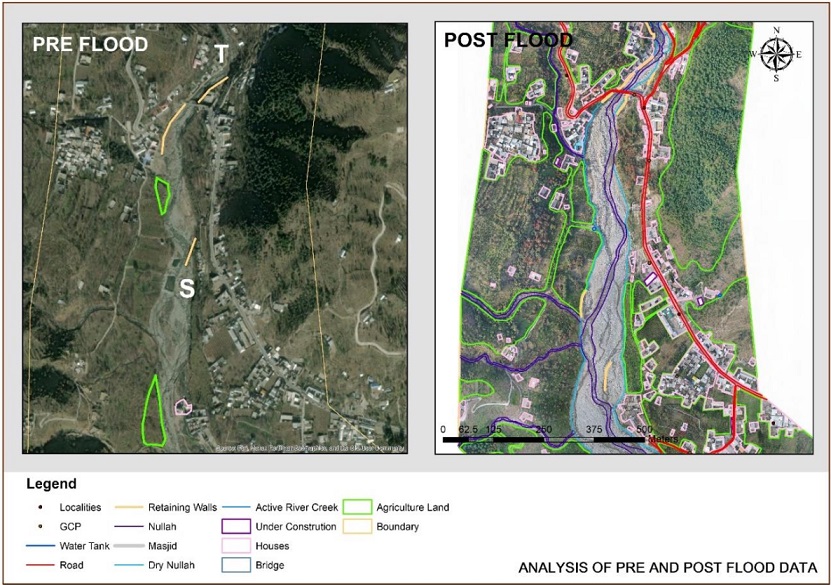
Figure 12:Analysis of Pre and Post Flood Data from point S to T
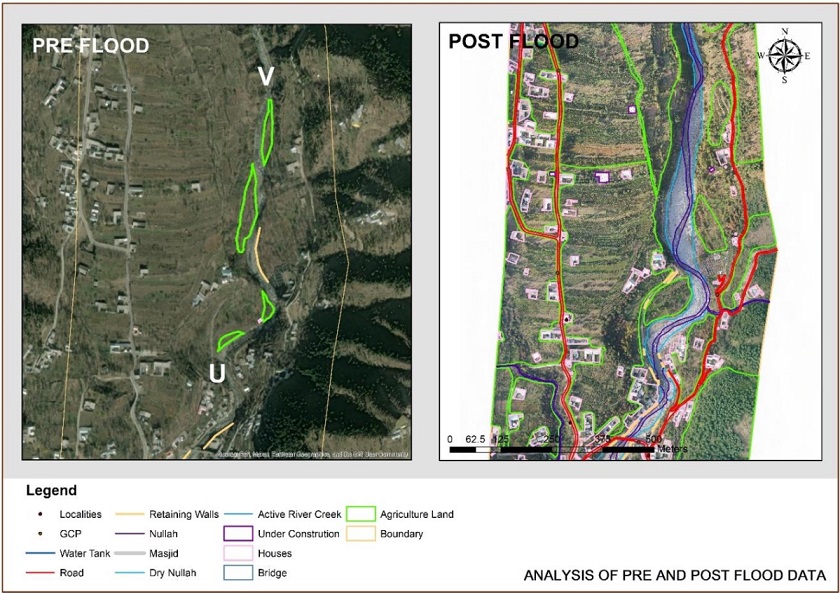
Figure 13:Analysis of Pre and Post Flood Data from point U to V
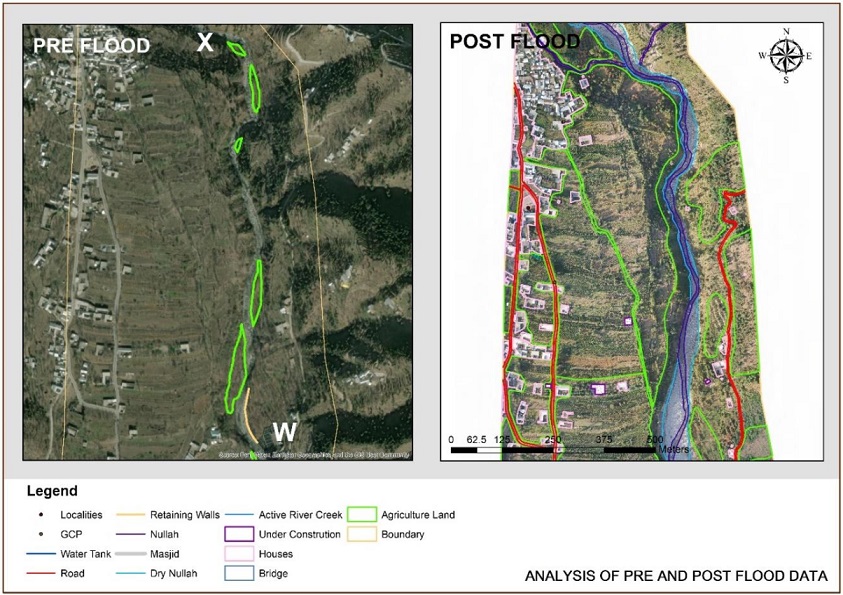
Figure 14:Analysis of Pre and Post-Flood Data from Point W to X
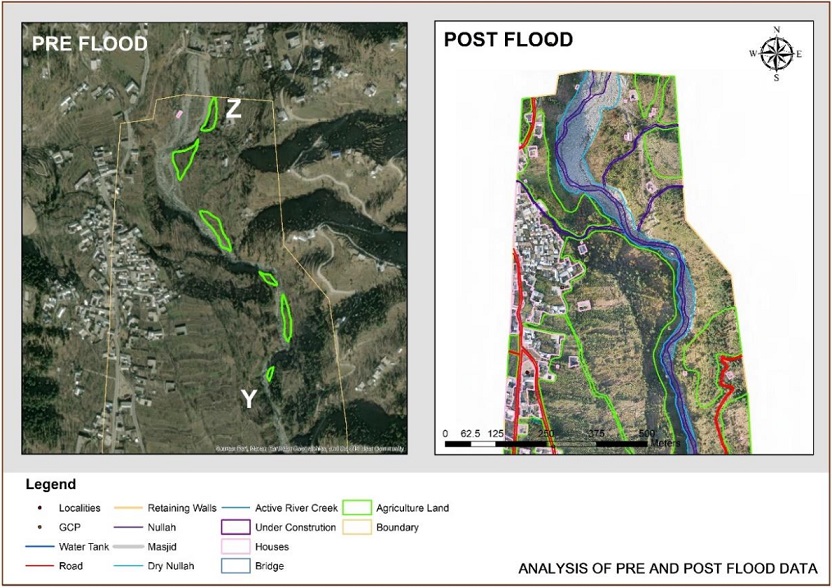
Figure 15:Analysis of Pre and Post-Flood Data from Point Y to Z
Between points Y and Z (Figure 15), the flow of the flood has decreased, which may
initially seem like a positive development. However, despite the reduced flood flow, the area has
still experienced significant damage, particularly to agricultural land and houses. The decrease in
flood flow might lead to water stagnation and prolonged inundation, negatively impacting the
agricultural land.
High-resolution imagery provides an accurate depiction of the damage caused by floods,
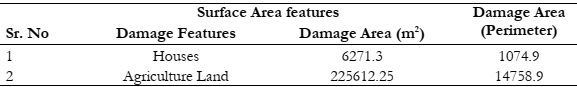
such as infrastructure destruction, according to Table 6, the 14758.9 m (14.8km) extensive
agricultural area of Barwai Khwar damaged in the flood of 2022 and the percentage of
agricultural land loss is highest among all. The destruction area of the retaining wall is 2184m
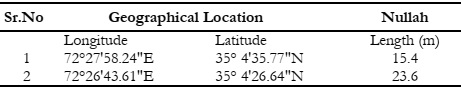
(2km) and housing loss is 1074.9m and the damaged area of Nullah is 82.6m.
Table 1:Damage Length of Retaining Walls
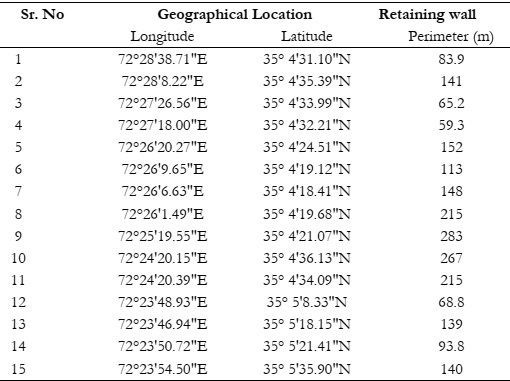
Table 2:Damage Area of Houses
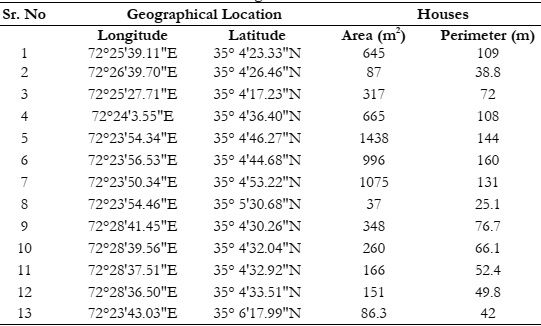
Table 3:Damage Area of Agriculture Land
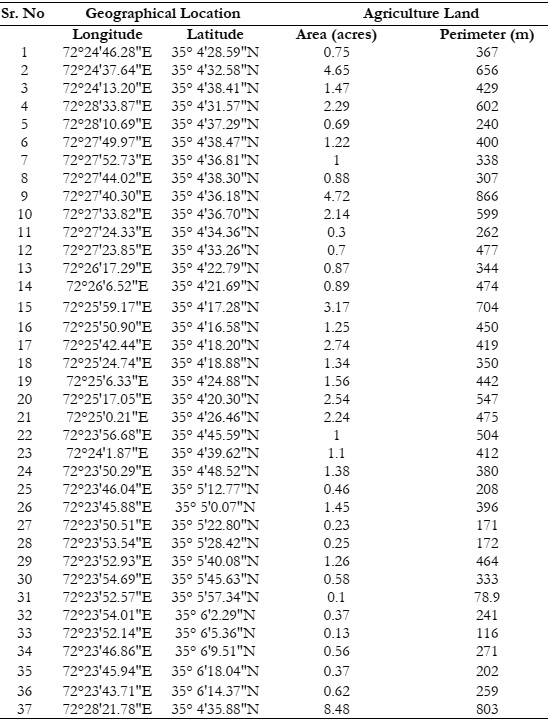
Table 4:Damage Length of Bridges
Nullah Width:
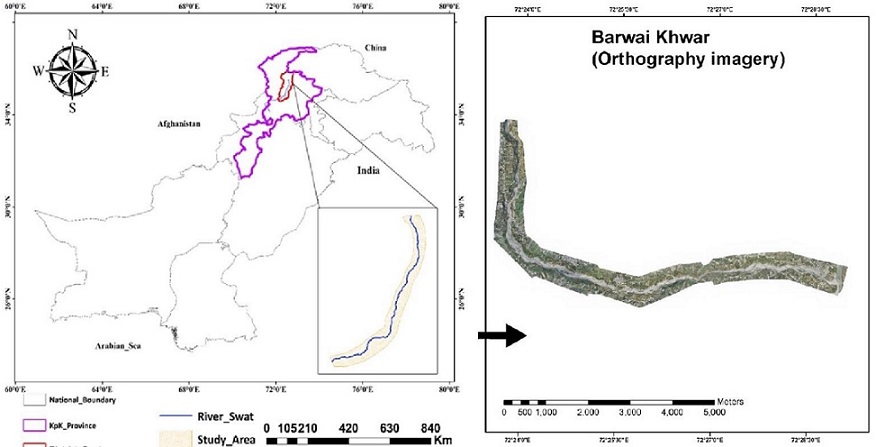
The total length of the nullah is 11378 meters with latitude (35° 4'30.59" N) and
longitude (72°28'48.49"E).
Table 5:Width of Nullah
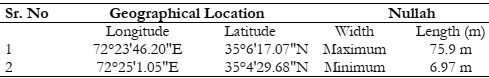
Table 6:Linear Features of Nullah
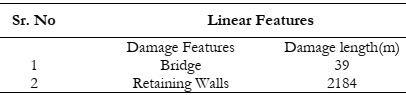
Table 7:Surface Area Features of Nullah
Discussion
Drone technology has emerged as a valuable and efficient method for flood damage
assessment and evaluating the impact of flooding on landscapes [22], infrastructure, and
communities. There are many aspects of flood damage assessment such as rapid and
comprehensive data collection, which can be used to assess the extent of the flood damage,
identify affected structures, roads, and infrastructure, and estimate the overall impact on the
environment [23]. In Figure 5 large portions of agricultural land are damaged and reshaped
during pre-flood image from point A to B, eroding fertile topsoil and posing challenges for
farmers. The total damaged area of agricultural land due to flood is 225612.25 (m2) houses are
6271.3(m2) respectively. Accuracy and precision is a valuable aspect of Drone technology as it
enables the accurate identification of damages to residential and agricultural land and retaining
walls, roads, and other critical infrastructure. Safety and accessibility are ensured by using a
drone, to get access to hazardous areas ( Quoc 2020). The residential areas were also severely
affected, with approximately 5 to 6 residential areas experiencing flood inundation. This resulted
in damage to houses, and infrastructure, and disruptions to the lives of the affected communities.
Comparison and monitoring, data integration and analysis, and resource allocation are also
prominent features of this state-of-the-art. Moreover, the agricultural land in this area has been
negatively impacted, with crops being damaged or destroyed due to floodwaters. Farmers in the
area may need assistance in reclaiming and reshaping the land, replenishing soil nutrients, and
replanting crops to restore agricultural productivity and ensure food security for the community
Soil erosion and potential contamination may have further compounded the agricultural losses.
The river's floodplain substantially expanded, leading to the inundation of agricultural land,
built-up areas, and settlements. Crucial infrastructure, including roads and bridges, faced damage
or were washed away by the force of the floodwaters, severely hampering accessibility and
mobility within the region.
Finally, the impacts varied across the region, with agricultural land, retaining walls, and
residential areas being the most affected. Urgent recovery efforts are necessary to restore stability
and livelihoods in the aftermath of this natural disaster. Additionally, measures to improve flood
resilience, infrastructure maintenance, and disaster preparedness should be prioritized to
mitigate the impact of future events. Collaboration between local authorities, communities, andInternational Journal of
Innovations in Science & Technology
Sep 2023|Vol 5| Issue 3 Page |249
relevant stakeholders will be essential in rebuilding and safeguarding the region against future
floods.
Conclusion
After the flood in Barwai Khwar, Swat, Khyber Pakhtunkhwa (KPK), the landscape
showed different levels of damage and impacts at various locations. The forceful flow of
floodwaters significantly altered the region, causing extensive damage to agricultural land,
residential areas, retaining walls, and infrastructure. From point A to B, the active river flow
reshaped large portions of agricultural land, eroding fertile topsoil and posing challenges for
farmers. One retaining wall, likely serving as a flood defense structure, failed to withstand the
flood's intensity. This led to localized flooding and further erosion risks. The residential areas in
this region experienced severe inundation, damaging houses, and infrastructure, and disrupting
the lives of the affected communities. Between points C and D, the forceful flow of floodwaters
caused extensive damage to agricultural land, leading to the destruction of one bridge.
Additionally, the flood overwhelmed a retaining wall, impacting the surrounding areas. At points
E and F, a relatively smaller area of agricultural land displayed damage, possibly from natural
factors like erosion or soil degradation, with two retaining walls also affected. Between points G
and H, the area depicted a mix of varying impacts from the disaster. While agricultural land in
this region fared better, one house near a collapsed bridge suffered damage, indicating the
destructive force on buildings (Quoc et al., 2020). A retaining wall was also damaged,
highlighting infrastructure challenges during such events. From points I to J, the flood's force
led to extensive damage to retaining walls and agricultural land, causing flooding and reshaping
of the land. Between points K and L, the region suffered from severe damage to residential
areas, retaining walls, and agricultural land, necessitating urgent recovery efforts. Between points
M and N, a large area of agricultural land was affected, demanding rehabilitation for the farming
community. From point O to P, the floodwaters damaged agricultural land and a retaining wall
attached to a bridge. Between points Q and R, both agricultural land and residential areas
experienced significant damage. At points S and T, the flood caused damage to three retaining
walls and a small area of agricultural land [25], [26]. Between points U and V, a damaged retaining
wall and affected agricultural land were observed. From points W to X, the reduced flood flow
still damaged a retaining wall and small areas of agricultural land. Between points Y and Z, the
decreased flood flow caused damage to agricultural land and one house. In conclusion, the flood
in Barwai Khwar, Swat, KPK, resulted in substantial damages, altering the landscape and posing
challenges to the affected communities
Recommendations
Based on the conclusion drawn from the flood in Barwai Khwar, Swat, KPK, the
following recommendations are crucial to address the challenges posed by the disaster and
enhance the region's resilience against future floods:
• Rehabilitation of damaged infrastructure, such as roads, bridges, and utilities, must be prioritized
to facilitate access and improve connectivity within the region.
• Strengthening disaster preparedness is crucial to respond effectively to future floods.
Establishing robust early warning systems, community drills, and contingency plans can help
minimize the loss of life and property during emergencies.
• Implementing sustainable land use planning practices is essential to reduce the vulnerability of
communities to floods. Identifying and protecting floodplains, restricting construction in highrisk areas, and promoting
resilient agricultural practices can prevent future flood-related
damages.
• Conducting awareness campaigns and providing training to local communities on flood risk
management and response can empower them to take proactive measures and safeguard their
lives and property during flood events
• Encouraging collaboration between local authorities, communities, NGOs, and other relevant
stakeholders is vital to developing and implementing effective flood management strategies.
Partnerships at various levels will help mobilize resources, expertise, and support for sustainable
recovery and preparedness efforts.
Reference
[1]
U. Iqbal, M. Z. Bin Riaz, J. Zhao, J. Barthelemy, and P. Perez, “Drones for Flood
Monitoring, Mapping and Detection: A Bibliometric Review,” Drones, vol. 7, no. 1, pp.
1–29, 2023, doi: 10.3390/drones7010032.
[2] M. N. Abdel-Mooty, W. El-Dakhakhni, and P. Coulibaly, “Data-Driven Community
Flood Resilience Prediction,” Water (Switzerland), vol. 14, no. 13, 2022, doi:
10.3390/w14132120.
[3] A. R. M. Amen et al., “Mapping of Flood-Prone Areas Utilizing GIS Techniques and
Remote Sensing : A Case Study of Duhok , Kurdistan Region of Iraq,” 2023.
[4] S. Mahmood, A. Rahman, and R. Shaw, “Spatial appraisal of flood risk assessment and
evaluation using integrated hydro-probabilistic approach in Panjkora River Basin ,
Pakistan,” 2019.
[5] M. Dilley, “Natural Disaster Hotspots: A Global Risk Analysis - Maxx Dilley - Google
Books.” 2005.
[6]N. M. Dang, M. S. Babel, and H. T. Luong, “Evaluation of food risk parameters in the
Day River Flood Diversion Area, Red River Delta, Vietnam,” Nat. Hazards, vol. 56, no.
1, pp. 169–194, 2011, doi: 10.1007/s11069-010-9558-x.
[7] T. Bibi, F. Nawaz, A. Rahman, K. Razak, and A. Latif, “FLOOD RISK ASSESSMENT
OF RIVER KABUL AND SWAT CATCHMENT AREA: DISTRICT
CHARSADDA, PAKISTAN,” ISPRS - Int. Arch. Photogramm. Remote Sens. Spat. Inf. Sci.,
vol. XLII-4/W9, pp. 105–113, Oct. 2018, doi: 10.5194/isprs-archives-XLII-4-W9-105-
2018.
[8] T. F. Stocker, S. K. Allen, V. Bex, and P. M. Midgley, “Climate Change 2013 The
Physical Science Basis Working Group I Contribution to the Fifth Assessment Report
of the Intergovernmental Panel on Climate Change Edited by,” 2013.
[9] M.-S. Aribisala, O.D.; Yum, S.-G.; Adhikari, M.D.; Song, “Sustainability _ Free FullText _ Flood Damage
Assessment_ A Review of Microscale Methodologies for
Residential Buildings.”
[10] C. X. Ashfaq Ahmad Shah, Ayat Ullah, Nasir Abbas Khan, Muhammad Haroon Shah,
Rasheed Ahmed, Syed Tauseef Hassan, Muhammad Atiq Ur Rehman Tariq, “Frontiers
_ GIS-based flood susceptibility mapping using bivariate statistical model in Swat River
Basin, Eastern Hindukush region, Pakistan.” Interdisciplinary Climate Studies, 2023.
doi: https://doi.org/10.3389/fenvs.2023.1088126.
[11] A. A. Memon, S. Muhammad, S. Rahman, and M. Haq, “Flood monitoring and damage
assessment using water indices: A case study of Pakistan flood-2012,” Egypt. J. Remote
Sens. Sp. Sci., vol. 18, no. 1, pp. 99–106, Jun. 2015, doi: 10.1016/J.EJRS.2015.03.003.
[12] Govt Pakistan, “Pakistan Floods 2022_ Post-Disaster Needs Assessment - Pakistan _
ReliefWeb.” 2022.
[13] UNDP, “Pakistan floods 2022,” 2022.
[14] Z. U. Rahman et al., “GIS-based flood susceptibility mapping using bivariate statistical
model in Swat River Basin, Eastern Hindukush region, Pakistan,” Front. Environ. Sci.,
vol. 11, 2023, doi: 10.3389/fenvs.2023.1178540.
[15] S. Guan, C. Tao, and S. Liu, “Proceedings of spie,” no. April, 2023, doi:
10.1117/12.2658632.
[16] K. J. Daniel Whitehurst and K. K. and J. Weeks, “Post-Flood Analysis for Damage and Restoration Assessment
Using Drone Imagery,” pp. 1–17, 2022.
[17] FAO, “Food and Agriculture Organization of the United State,” 2016.
[18] H. Mcgrath and P. N. Gohl, “Accessing the Impact of Meteorological Variables on
Machine Learning Flood Susceptibility Mapping,” 2022.
[19] T. D. E. M. Worlddem, “Flood hazard assessment and mapping of River Swat using
HEC-RAS 2D Flood hazard assessment and mapping of River Swat using HEC ‑ RAS
2D model and high ‑ resolution 12 ‑ m TanDEM ‑ X DEM,” Nat. Hazards, no. June
2020, 2019, doi: 10.1007/s11069-019-03638-9.
[20] O. S. Yilmaz, “Flood hazard susceptibility areas mapping using Analytical Hierarchical
Process (AHP), Frequency Ratio (FR) and AHP-FR ensemble based on Geographic
Information Systems (GIS): a case study for Kastamonu, Türkiye,” Acta Geophys., vol.
70, no. 6, pp. 2747–2769, 2022, doi: 10.1007/s11600-022-00882-9.
[21] Anne Crosby, “How are drones used in flooding management_.” 2022.
[22] A. Ntal, “Flood forecasting _ Aerial drones to predict and assess flood damage.”
Twinn, 2015.
[23] S. Mastura et al., “Science & Justice Applications of drone in disaster management : A
scoping review,” Sci. Justice, vol. 62, no. 1, pp. 30–42, 2022, doi:
10.1016/j.scijus.2021.11.002.
[24] eunghee P. Park, Dai Quoc, Tran Minsoo Daekyo JungS, “Remote Sensing DamageMap Estimation Using UAV Images
and Deep Learning Algorithms for Disaster
Management System.” Remote Sensing 12(24), 4169, 2020. doi:
https://doi.org/10.3390/rs12244169.
[25] H. Rizk, Y. Nishimur, H. Yamaguchi, and T. Higashino, “Drone-based water level
detection in flood disasters,” International Journal of Environmental Research and Public
Health, vol. 19, no. 1. 2022. doi: 10.3390/ijerph19010237.
[26] H. Events, S. Adams, C. Friedland, and M. Levitan, “Unmanned Aerial Vehicle Data
Acquisition for Damage Assessment in Hurricane Events,” 2010.