E-ISSN:2709-6130
P-ISSN:2618-1630

Research Article

International Journal of Innovations in Science & Technology

2023 Volume 5 Number 3 July-September

Geo-Spatial Dynamics of Snow Cover and Hydro-Meteorological Parameters for Gilgit Balistan, Pakistan

Arif. H1*, Mahmood. S. A2, Sabir. M1,

1* Hania Arif , Centre for Integrated Mountain Research, (Punjab University Lahore, Pakistan)

2 Syed Amer Mahmood , Department of Space Science (Punjab University Lahore, Pakistan)

1Munawar Sabir, Centre for Integrated Mountain Research, (Punjab University Lahore, Pakistan)

Abstract
Snow cover dynamism is an important component of the UIB’s (Upper Indus Basin) hydrodynamics in the context of snow building up and reduction occurring seasonally. This study incorporates investigation into the dynamics of snow covers in relation to the hydrodynamics of the region. Data acquired through remotely sensed MODIS (Moderate Resolution Imaging Spectro-Radiometer) satellite for the duration of 20 years from 2000-2020, together with additional variables of hydrometeorology was utilized in the assessment of spatial and temporal fluctuation in snow-covered areas of Gilgit Baltistan (GB). The snow cover analysis was done temporally with an evaluation of its relationship with the hydro-meteorological variables through the application of Pearson correlation, Principal Component Analysis (PCA), and basin-wise zonal analysis. The investigation revealed that glacial ice covered an area of 25 to 50% and that the SCA (Snow Covered Area) may expand to 80 to 90% of the region on the amassment of snow in the snowy season. Trends from hydro-meteorological correlativity demonstrate a greatly considerable proportionality of R = 0.78, between the maximal and minimal temperature zones and river drains. However, no noticeable correlativity was found between precipitation and river drains (R = -0.04). For the region of Hunza, a statistically important negative correlativity was observed between the river drains and precipitation i.e., R = –0.83. The minus factor indicates an increase in river drainage with increased melting of snow covers due to high temperatures. This investigation infers a close association of river runoffs of the GB area with its snow cover dynamism. Discharge of rivers is a consequence of melting snow in the basin due to rising temperature and thus it speeds up at the beginning of summers mainly during April and May. Snow and ice start melting from the bottom and then reaches the top areas that have greater upstanding glacial mass.

Keywords: Hydrology, Snow cover dynamics, Upper Indus Basin, Principal Component Analysis, Hydro-meteorological

Corresponding Author How to Cite this Article
Hania Arif, Centre for Integrated Mountain Research, (Punjab University Lahore, Pakistan)
Hania Arif, Syed Amer Mahmood and Munawar Sabir, Geo-Spatial Dynamics of Snow Cover and Hydro-Meteorological Parameters for Gilgit Balistan, Pakistan. IJIST. 2023 ;5(3):193-214 https://journal.50sea.com/index.php/IJIST/article/view/524

Introduction

Pakistan is known for the abundance of glaciers amounting to 5000 including the world’s second-biggest Siachen glacier [1]. Glacier snow and ice store freshwater throughout the winter season and release it into rivers in summers as a result of high-temperature ice melting. Pakistan has a greater economic reliance on agricultural systems that have a 21% contribution to National GDP. The Indus Irrigation system meets the water demands for agricultural purposes [2]. However, there has been a significant reduction observed in the water supply of the Indus River in comparison to the past 5 years particularly during the spring and summers which rebuts the past studies that regarded the river’s water availability as constant or increasing [3].

Snow is a necessary component of the climate with an ability to regulate hydrological and atmospheric phenomena owing to its greater albedo and lesser thermic conductibility [4]. In the regulation of hydrology, snow plays a significant role as a freshwater reservoir and source during summers in the form of ice melts for high altitude basins [5]. The Indus Basin is the best example in this case where the seasonal melting of snow becomes the prime source of water after a prolonged dry season from October to March [6]. It is so because the precipitation received by the Indus Basin during winters is primarily in the frozen states coming from the northern HKH region [7].

Recently, water scarcity has turned into a critical problem for the world with declining water availability per unit of the world population and with an exponential increase in the population of the world specifically in Asia, the issue is getting intense. In Pakistan [8], the major water consumption sectors include agricultural systems (92%), domestic (6%) and commercial use (2%). The major spot of water availability for the regional tributaries and community sustenance is the region of HKH that supports the lives of many people around the coast [7]. Considering the semi-dry climate of the riverside, there is an increased need for adequate water supply for harvesting and glaciers are the source for it which is why they are regarded to be the significant regulators of climate; however, their evaluation is restricted due to the regional natural unapproachability.

UIB has its hydrologic area at an elevation in the region of HKH [9]. The top of the river Indus receives a water flow of above 60% yearly from the perennially persistent seasonal snowfields [10][11][12]. Glaciers at a height of more than 3500 m also add to this flow of water [13]. The HKH region is a source of about 90% of runoff for the Indus River System [14]. The 2007 report from IPCC (Inter-Governmental Panel on Climate Change), predicted a rapid snow cover reduction during the whole of the 21st century with consequent water scarcity and significant alteration in seasonal runoffs from ice melts [15]. Various studies conducted within the region of Hindukush Karakoram Himalayas, signify a rapid snow cover depletion [9] [16][17][18][19] whereas a snow cover expansion has been recorded in the west of the Himalayan and Karakoram region [20].

Gurung et al. [16], indicated that in addition to being a great water reservoir, the glaciers when melted are also a major source for the regions that have a dry or a semi-dry climate. Around 17% of world inhabitants rely on water from ice melts every summer season [5]. As established earlier, the Indus river system receives more than 50% of water flow from the same ice bodies [21]. The investigation of Bajracharya and Shrestha in 2011 [22], declared that the net area of the Indus Basin covered by glaciers is 21193 km2. The IPCC report of 2013 indicated a substantial thermic increase in the Himalayan region as a result of global warming [15][23][24] and this temperature increase resulted in a 16% approximate reduction in Snow Covered Area (SCA) across the Himalayas during the period between 1990 to 2001 [25]. Immerzeel indicated an identical ice cover drop for the period 2000 to 2008 [9].

The water cycle in the mountainous region is a part of hydrometeorology that assists the evaluation of the hydrological stability of the region along with the supply of water in the usually dry area. When the hydrograph statistics for the up and downriver currents are analyzed, it is observed that the peak deflection occurs during the summer season when ice is melting in the Indus Basin [26]. For the UIB in the west of HKH, it is still unknown what part is played by the melting of snow in the water supply. Immerzeel et al. [9] noted the ice melt contribution in the UIB to be around 40%. This observation was derived through modelling investigation that is prone to errors and biases. Therefore, considering the significance of ice melts in water flow, there is a need for precise estimation and evaluation of its distributional trend across the region of UIB along with its implications on climate. In addition to that, the snow cover investigation is also important in calibrating the disseminated hydrological patterns [27], and in making seasonal predictions of water availability.

In conformity with the unconventional global warming, IPCC AR4, 2007), the Himalayan region is also recorded to be subject to rapid heating up in recent years [15] . Due to this heating up, there has been a considerable decrease in the yearly mean snowfield area; during the period 1990 to 2001 only, a snow reduction of approximately 16% has been observed across the Himalayan region.[25]. An identical pattern of snow reduction has been observed for the years 2000 to 2008 by Immerzeel et al. [9] and for the years 2000 to 2010 by Gurung et al. [16]. This implies a significant depletion of ice caps with some regional exceptions. Contrastingly, UIB shows a different side of climate variations with increased precipitation and decreased temperature [28]. Precipitation trends based on tree ring observation validate this climatic condition by declaring the region as the moistest for the past thousand years [29].

On the other hand, the major part of glaciers of the Himalayas has suffered retraction and loss of ice mass for a long time since the later part of the ice age and has caught an average speed up after 1990. The glacial ranges of the Karakoram have shown a certain irregularity for a considerable period with the last ten years marked by balanced budgets [12][30][31][32]. Due to this conflicting nature of the region, the evaluation of snow caps has not been successful which leaves the process of water managing operation uncertain.

Due to the lack of minimum-distance high-elevation stations for meteorology in the Upper Indus Basin, the snow cap evaluation has become difficult on both local and sub-basin levels. The rough climate and land of the Hindukush Karakoram Himalayas do not allow any snow assessment for the region. In addition to that, the snow evaluation and mapping require a suitable temporal resolution owing to its increasingly fluctuating nature, unlike the glacial mass that can be mapped by using appropriate planar resolution only. For this purpose, applying data from integrated Remote Sensing (RS) and GIS (Geographical Information System) method has made snow mapping feasible even in remote regions [33][34].

Remote Sensing via satellites has been the most useful method of evaluating snow caps in inaccessible and harsh regions [13]. Many researchers have worked in this domain and found significant results, for instance, Maurer [35] discovered a significant increment of snow through

Moderate Resolution Imaging Spectro-Radiometer:
(MODIS) snow data of the basin of Columbia River with complicated topography and this method proved more useful than the other. Similarly, Immerzeel [9] tested the precision of MODIS in assessing river flows by evaluating the correlation of snow cover dynamism with the upper Indus runoff within the constraints of the hydrological flow system. This accuracy and authenticity of the MODIS snow product make the evaluation of spatially variable snow covers possible at different heights and areas of the UIB. For this reason. MODIS data have been regarded as sufficient for basin wise evaluation and used for the same purpose [36]. As stated by the research in the Astore basin led by Forsythe [37] MODIS products are an effective means of monitoring remote regions with quite a few restrictions, for instance, the cloud cover. However, the cloud cover influence can be minimized by replacing a single day figure with an 8-daily product. MODIS has had extensive use worldwide by various scientists and researchers in snow cover estimation around the world. Lee [38] confirmed the precision of MODIS by using its data in SRM (Snowmelt Runoff Model) for the estimation of river runoff in the Upper Rio Grande basin. Tahir [39] and Tekeli [40] compared data from surface observatories with MODIS data of 500x500m resolution for snow cap estimation. Another comparison of the precision of MODIS with ASTER, revealed snow cover estimation at low, medium, and high elevation to be 75%, 95%, and 99% respectively and 62-82% when compared with surface observations.

This study was carried out to evaluate the dynamic of snow covers in the region of GB during the period 2000 to 2020 and its relationship with hydro-meteorological parameters using satellite products. The research area was classified into basins based on regional catchments. The major goals of the study were:

1. To comprehend hydrological trends and the possible implications of meteorological variables such as thermos-dynamics and precipitation variability on ground runoffs at various catchment areas,

2. To examine the dynamism of snow covers spatially and temporally,

3. To examine the feasibility of satellite data for snow covers and confirm its precision in estimating the participation of ice melts in the river runoffs.

The study also demonstrates a correlation between the hydro-meteorological variables that contribute to surface discharge with respect to the snow cover.

Study Area:
The study area confines the territorial dimension of 30–38 N and 67–84◦E, including ten sub-basins i.e., Astore, Diamir, Ghanche, Ghizer, Gilgit, Hunza, Kharmang, Nagar, Shigar and Skardu (Figure 1). The basins under investigation lie at the centre of two grand scale configuration systems: the disturbances at mid-latitude of the west and the summer monsoonal model of South Asia [26]. The hydrological dynamics of the sub-basins at higher elevation i.e., Hunza, Shigar, Ghanche and Astore are influenced by the disturbances of the western mid-latitude in winters and the spring [7][41][42]. These sub-basins of high elevations are shadowed by the precipitation of the west Himalayan region and thus gets the minimum rainfall in the summer monsoon [43], which is majorly concentrated over the low elevation sub-basins i.e., Diamir and Gilgit.

The Upper Indus Bain exhibits uncommon trends of estimated climatic variability. Around 50% of the observational data for this region since 1955 reveals an inclination of average annually and seasonally recorded temperatures towards colder environment except during the winter season [28]. Furthermore, an increase in the DTR (Diurnal Temperature Range) can be observed over the year [28] when it has been decreasing in the rest of the world since 1950 [44][45].

Streamflow coming from the basins under study is in the form of both snow and rain with the high elevated zones releasing snow and ice melts and low-lying areas releasing a fast flow of rainfall [46]. However, it is limited to the summer season during the time between June and August and is dependent on the glacier melt runoff [42]. The climatological runoff observations in the past for the basins of Gilgit Baltistan have declared these sub-basins as a source of around 80% of annually received water in Pakistan through IRS [43]. According to Fowler and Archer [28], the entire region of IB can be categorized into high, mid, and low altitude basins based on their hydro-meteorological features:

High altitude basins are characterized by a greater glacier mass aka glacier-fed basins. Their hydrological characteristics are dependent on ice melt discharge during the melting season that is linked with identical summer temperatures. The dissemination of snowfall has a considerable influence on the temporal and quantitative parameters of ice melt discharge from the basin.

Mid altitude basins are located at a relatively lower altitude/latitude and receive a lesser amount of glacier mass which is why they are known as snow-fed basins. The hydrological properties of these basins are influenced by the discharge from the melting of snow that is linked with the snowfall of the preceding season.

Low altitude basins are based on the foothill catchments that collect precipitation in the form of fast rainfall which is why they are known as rain-fed basins. According to the division of all basins into glacier-fed, snow-fed, and rain-fed categories, Hunza, Shigar and Ghanche basins fall in the glacier-fed category, while Astore, Gilgit, Ghizer, and Skardu are classified as snow-fed basins, and Diamir and Kharmang fall under rainfed basins (Figure 1). Table 2 illustrates the net area covered by the basins. As the runoff from snow-fed basins depends on the past winter and the runoff from the glacier-fed basins depends on the identical temperatures, this dependency along with the clashing precipitation and temperature variables across the HKH are of the Indus Basin, makes one expect substantial variations in the snow covers can be expected with significant climate changes that consequently impacts the hydrology and glacier persistence in the region. Glacier and seasonally occurring snow cover melting is the primary source of river runoffs with an intermittent contribution of rainfall. Figure 1 illustrates the map of the region under study.

Figure 1:Map of the region under study

Material and Method

Data Sources:

Hydro-Meteorological Data:
Precipitation and temperature data were acquired from the PMD (Pakistan Meteorological department) for the time of 1951 to 2016. The diurnal runoff data were obtained from WAPDA (Water and Power Development Authority) for the sub-basins of UIB for the time between the years 1960–2015.

Satellite Data:
MODIS products have had the greatest suitability in the basin-wise analyses [36] and a MODIS product with a spatial resolution of 500m is proven to be used in the estimation of SCA of the basins covering a total area of around 10,000 km2 or above [47]. For this study, the MODIS 8-daily product was selected to estimate the concerned SCA. Satellite data clusters (MOD10A2) from the beginning of the year 2000 to the end of 2020 were obtained through downloading and re-projection was done using the WGS 1984 UTM ZONE 43N projection system of the Geospatial Data Abstraction Library (GDAL) image processing system.

Table 1:Hydro-metrological stations name and elevations

Table 2:Basins name and elevations

Methodology:
MODIS snow product of 500m spatial resolution was made to undergo regional sinusoidal re-projected into Universal Transverse Mercator (UTM) Zone 43N projection with datum WGS-1984 using GDAL. The extraction of SCA was done using the 8-day MODIS product for the duration of 2000 to 2020 for the region under study.

The basin-wide height of the region under study was extracted by the 30m resolution SRTM DEM. The SCA extraction from the sinusoidally reprojected 8-day MODIS product was done using the sub-catchments. Consequently, the snow cover dynamism was evaluated in relation to varying altitudes. Hypsometric slopes were created according to the altitude. The derivation of SCDC (Snow Cover Depletion Curve) and SCIC (Snow cover Inclination Curve) was carried out from the zonal SCA. The derivation of SCDC and SCIC was made from the MODIS SCA data. Multiple statistical analyses were conducted to verify the accuracy of data before using them for the evaluation of hydrology.

For the investigation of the interlinks of the climate data from differently elevated stations, Pearson correlation was applied. The assessment of climate data (1951–2016) pattern of the study region was done for six ground stations of meteorology in the sub-basins. The average for diurnal maximum, minimum, and mean thermic values was taken for the ground meteorological observatories to derive the corresponding daily temperature values of the sub-basin. The aggregate of daily precipitation was taken for all observatories. After obtaining the average values for daily temperature and precipitation, the total temperature and precipitation for the entire period were calculated.

Correlation Analysis:
Correlation analysis was applied to estimate the intensity of correlation among seasonal runoffs, hydro-meteorological variables, and snow cover areas determined by correlation coefficient (R). R ranges from − 1 to + 1 and determines the course and intensity of the linear relationship between the two parameters [48]. The formula for the sample correlation coefficient is:

Regression Analysis:
Regression analysis was used to trace the magnitude of reliance of seasonal runoffs with hydro-meteorological variables and snow cover. Runoff was considered as a dependent variable (Y), and hydro-meteorological parameters and snow cover at different zones were taken as independent variables (X) using the best fit line.

Where

a: intercept,

b: Slope of the line, and

c: Error.

The hydro-meteorological data were divided into three periods: snow melting period, snow accumulation period, and snow constant period. Statistical evaluation was done for the runoff data.

Result

GB Hypsometry:
The hypsometric curve for the GB area indicates the range of elevation for major snow covers in the area under study to be between 3500 to 6000 m above mean sea level (a.m.s.l.) (Figure 2). This covers 85% of the total GB area. The total aggregative area of above 5000m a.m.s.l. for the basin represents the most glaciated areas and the remaining basin area under 3000m a.m.s.l. represents the least glaciated areas (Figure 2).

Figure 2:Hypsometric curve and distribution of the area by layer under each 500 m elevation band.

Basin-Wide Snow Cover Estimation:

Snow Cover:
The greatest yearly snow cover average is attributed to the sub-basins of Hunza, Shigar and Ghizar (Figure 3). The variation for snow caps for these sub-basins is greater than other sub-basins specifically the ones lying at the lower elevation. Moreover, the Kharmang sub-basin displays the minimum snow cap area majorly because of being located at a lower altitude on the south-eastern side. Astore and Gilgit encounter comparatively less cloud cover and more fluctuation during the periods of amassment and reduction. An acute decline in the curve for snow covers indicates minimum participation of these glaciers in the water management of the basin, therefore, the region relies greatly on melting of snow instead.

Snow Cover Trends:
A considerable fluctuation in the snow cover trends can be observed for the region of GB and all the basins that fall under it. These basins lie under the influence of western disturbances. Contrastingly, a small variation is observed for the remaining basins under analysis that lie under the implications of monsoon, however, these trends were statistically inconsequential. On the evaluation of yearly trends, it was revealed that they had a certain correspondence to the historically drastic drought of Pakistan that started during the years 1998/1999 to 2002/2003 and diminished in 2003 and 2004 on the occurrence of greater winter rainfall [49][50]. An identical drought occurrence was recorded from 2006 to 2009 as well. The analysis conducted seasonally, for they sow covers, revealed a declining pattern for most of the basins understudy during the seasons of winter and fall. This decline in snow covers during fall and winters align with the recorded observations of its rise during the spring and summer (cooling and warming patterns) [28]. No statistically significant methodical alteration has been noted, however, a greater general variability has been noted to exist. This may affect the temporal melt runoffs. For this study, data for only 21 years could be accumulated which implies that long-term trends cannot be deduced forms limited amount of data.

Altitude Dependence of Snow Cover Estimates:
We have recorded a great seasonal alteration in the altitude-dependent snow covers for the mid-altitudinal basins in comparison with the high-altitude basins all over the year (Figure 3). The highest mass of snow cover for the glacier-fed basins can be observed during the winter season, whereas for the snow/rain-fed basins, the same is observed during spring (Figure 4). For the majority of the basins, an excessively great amount of the snow cover is received from the highly elevated areas that incorporate minimum surface areas, for instance, the areas at a height of more than 500m a.s.l. for the Astore, Hunza, Ghanche, Shigar. On the contrary, the Diamir and Kharmang basins have more surface areas i.e, less than 2000 m a.s.l. that show an inconsequential proportion of snow covers (Figure 1). Based on the altitude reliant temporal trends of snow covers, a calculation of the end of regional summer snow line altitude (SLA) area was done. The variability of the SLA area offers an accurate estimate of prevalent regional climate states (such as the precipitation contribution and synchronous temperature dynamics) and the mass balance fluctuations of hydrology. The zonal increase of SLA implies a rise in melting occurrences and vulnerability of the snow-less glaciers to withdrawal. Whereas its decrease brings about an inverse situation with an implication of rising mass balance for glaciers. Based on the observational temperature drop [28] and snow cover rise in the summers, an assumption was made of a declining tendency of the local SLA area. For the verification of this assumption, a comparison of interannual alterations of the late summer SLA area was done with the median altitude of glaciers of the basin. The median altitude of the glacier is a logical representation of the long period ELA (Equilibrium Line Altitude referring to the altitude where total mass gain/loss is zero) for the existing according to the data acquired from their topography [51]. Our study has revealed the location of observed local SLA areas inside the basins being beneath the median glacier altitude. These deductions indicate a positive mass balance for the present glaciers during the study period. Correlating the snow covers with the curve, we anticipate the high elevation basins to have a comparatively less snow cover area at higher inclines because of mass runoff of collected snow. Alternatively, for the snow-fed basins, lesser snow cover is assumed at lower inclines due to the greater portion of these glaciers stretching to high-temperature mountainous areas.

Figure 3:Annual mean snow cover for all basins for the period 2000–2020

The snow cover dynamics for the region of GB was evaluated with the help of MODIS products. The evaluation involved hypsometric curves for the basin, snow cover decline curves for the sub-basins, snow cover inclination curves for sub-basins, analysis of temporal trends, hydro-meteorological variables, evaluation of scatter plot, the net snow cover patterns for the GB area and associated relationships.

Snow Cover Dynamics and Associated Variations:
As per the average trend data of regional snow cover, temperature, precipitation, and river runoff for the duration of 65 years; 1951-2016, basin wise analysis reveals the following attributes:

Astore:
This sub-basin shows the largest snow cover data during the winter months of December and January. The variability in snow covers is noted to be ranging from 10% to 90%. According to Figure. 3, 2007 and 2016 experienced the lowest snow covers whereas the years 2009 and 2019 observed the highest snow cover record. The accumulated snow starts melting in April consequent to temperature increase and by the time till August the entire accumulated snow mass disappears (Figure 4).

Diamir:
This sub-basin retains the peak snow covers during December and January. The variability of snow cover is recorded to be 5 to 68%. Referring to Figure 3, the minimum snow cover observations were taken in 2007 and 2016, whereas the maximum snow cover appearance was noted in 2009 and 2019. The melting period begins in February and finishes in August due to a rise in temperature (Figure 4).

Ghanche:
The peak of snow covers for this sub-basin is recorded to be in December and January. Snow cover variability is between 43-80%. Figure 3 shows 2005 and 2012 to be the minimal snow cover period and 2009 and 2015 to be the maximal snow cover period. The melting period begins in March and ends in August owing to rising summer temperature (Figure 4).

Ghizer:
This sub-basin shows the largest snow cover data during the winter months of December and January. The variability in snow covers is noted to be ranging from 40% to 50%. According to Figure 3, 2007 and 2017 experienced the lowest snow covers whereas the years 2009 and 2018 observed the highest snow cover record. The accumulated snow starts melting in March consequent to temperature increase and by the time till the end of August, the entire accumulated snow mass disappears (Figure 4).

Gilgit:
This sub-basin displays the peak snow covers during December and January. The variability of snow cover is recorded to be 40-90%. Referring to Figure 3, the minimum snow cover observations were taken in 2007 and 2016, whereas the maximum snow cover appearance was noted in 2009 and 2015. The melting period begins in February and finishes after melting all of the snow covers in August due to a rise in temperature (Figure 4).

Hunza:
In this sub-basin, the peak of snow covers is recorded to be in December and January. Snow cover variability is between 40-50%. Figure 3 shows the 2008 and 2012 to be the minimal snow cover period and 2009 and 2018 to be the maximal snow cover period. The melting period begins in March and ends in late August owing to rising summer temperature (Figure 4).

Kharmang:
This sub-basin shows the largest snow cover data during the winter months of December and January. The variability in snow covers is noted to be ranging from 10% to 90%. According to Figure 3, 2007 and 2016 experienced the lowest snow covers whereas the years 2009 and 2019 observed the highest snow cover record. The accumulated snow starts melting in February consequent to temperature increase and by the time till the end of August, the entire accumulated snow mass disappears (Figure 4).

Nagar:
The peak of snow covers for this sub-basin is recorded to be in December and January. Snow cover variability is between 40-80%. Figure 3 shows 2007 and 2016 to be the minimal snow cover period and 2009 and 2018 to be the maximal snow cover period. The melting period begins in March and ends in August owing to rising summer temperature (Figure 4).

Shigar:
The peak of snow covers for this sub-basin is recorded to be in December and January. Snow cover variability is between 50-85%. Figure 3 shows 2007 and 2012 to be the minimal snow cover period and 2009 and 2018 to be the maximal snow cover period. The melting period begins in February and ends in August owing to rising summer temperature (Figure 4).

Skardu:
In this sub-basin, the peak of snow covers is recorded to be in December and January. Snow cover variability is between 25-90%. Figure 3 shows 2007 and 2016 to be the minimal snow cover period and 2009 and 2015 to be the maximal snow cover period. The melting period begins in February and ends in late August owing to rising summer temperature (Figure 4).

Long Term and Seasonal Snow Cover Trends:
The fluctuations in SCA (Snow Cover Area) were analyzed basin wise using an 8-daily MODIS product on a diurnal, periodical, and annual basis for the duration of 2000-2020 (Figure 4). The snow cover figures for the region of Gilgit Baltistan revealed three definite seasonal periods namely snow cover withdrawal/depletion period, accumulation period, and the period with minimum snow cover period during March-June, July-August, and September to February respectively (Figure. 4, Appendix A: 1,2). SCA trends for Astore, Hunza and Shigar Basin display a minor increase whereas a significant fluctuation exists in the remaining sub-basins. Figure 5 illustrates Snow cover variations in every month of 2018 year.

Figure 4:Inter-Annual snow cover inclination and depletion curves from 2000–2020 showing quantitative variations of seasonal snow cover over for Astore and Skardu basin. (Rest of the basin maps are in appendix A1 and A2)

Climatic Data Variation:

Trend Analysis:
No substantial trend exists (P > 0.05) for the yearly average of least and highest temperature and precipitation (Table 3).

Correlation Analysis:
As demonstrated in Figure 6, the correlation between various climatic variables such as temperature and precipitation were evaluated. For the explanation of this correlation, the implementation of Pearson and Kendall rank correlation tests (significance level, p = 5%) was done. Results for correlation between Astore and Bunji revealed a maximum coefficient of correlation for minimum temperature (R = 0.49). Similarly, the lowest correlation was displayed by Astore and Chillas; Bunji and Skardu (R = 0.13) with each other. Figure. 6 illustrates the figures of correlation for climatic parameters (temperature and precipitation) and snow covers of individual basins. Pearson correlation was demonstrated at 5% signification to assess the correlation between the lowest and highest climatic parameters. If the value of the correlation coefficient is negative, it means that river discharge is dependent on the rate of melting of snow cover (depleting snow covers) due to a rise in temperature.

Figure 5:Variations in Monthly Snow Cover of GB area for the year 2018

Table 3:Mann-Kendall Test P-values (level of significance at 0.05%) and Sen’s Slope for Annual Minimum, Maximum and Mean Precipitation

Meteorological Data Station:
For the climatic parameters, the figures for the correlation coefficient show snow cover analysis in individual sub-basins. This correlation examination is carried out by Pearson correlation assessment by applying it at 5% signification and deriving the relation between the lowest and highest temperature and precipitation. Results showed light correlation products of R = 0.18, R = 0.23, R = 0.2.

Figure 6:(a) Correlation Matrices Station-wise Maximum Temperature (b) Minimum Temperature (c) precipitation and Flow data at Gilgit Station and runoff at Gilgit river

Principal Component Analysis:

Climate Data Variation Analysis:
The Principal Component Analysis (PCA) was done to analyze the correlation between temperature, precipitation and snow cover adjacent to the environment slope. In the analysis of all such correlating parameters, the first two major constituents gave the explanation of more the 80% of fluctuation. The ordination for the hydro-meteorological variables namely lowest and highest temperature and precipitation was carried out in six spatial observatories in Hunza. According to Figure 7a, thermic variables display a high correlation while the precipitation variables do not show any dependence and have specific values for spatial distribution. The ordination of SCA and minimum and maximum temperature activity, (Figure 7b, c) had the primary constituents describe timely correlations between SCA and temperature. It displayed a slope for both amassment and reduction of snow. A proportionality is observed between the minimum and maximum temperature variability and snow reduction that causes significant streamflow.

Figure 7: Principal Component Analysis (PCA) for Hydro-meteorological parameters precipitation and minimum temperature, maximum temperature and snow cover of basins

Discussion

The extensive evaluation of SCA using the MODIS (MOD10A2) data declared snow accumulation and reduction as seasonal and periodic across the basins under study. A certain variability is observed, however, in the year-to-year snow trends owing to interannually variable precipitation coming from the west over Hunza. Interannual precipitation has been studied extensively [52][53][54][55]. The topography of the basins under study is complex and 
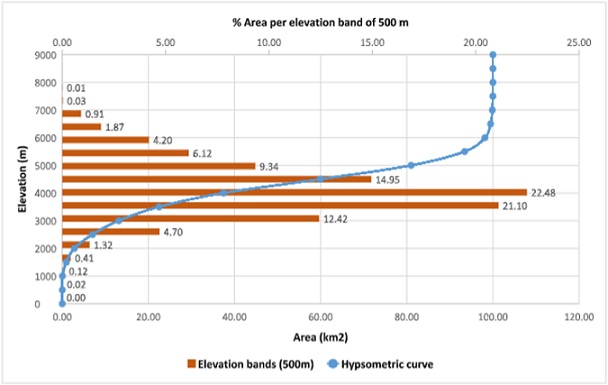
incorporates area-wise snow cover dynamism. 80% of all the snow cover formation takes place on latitudes of 6000 m (a.m.s.l.). Going beyond 5000 m (a.m.s.l.), glaciated zones can be found however, the zones under 3000 m (a.m.s.l.) display the lowest precipitation trend. The findings indicate the reliability of the MODIS (MOD10A2) product in the evaluation of dynamism of SCA having a 90% consensus with the data acquired from products with a relatively higher resolution. It also validates the research led by Shrestha [24]. A minute rise in trend is 
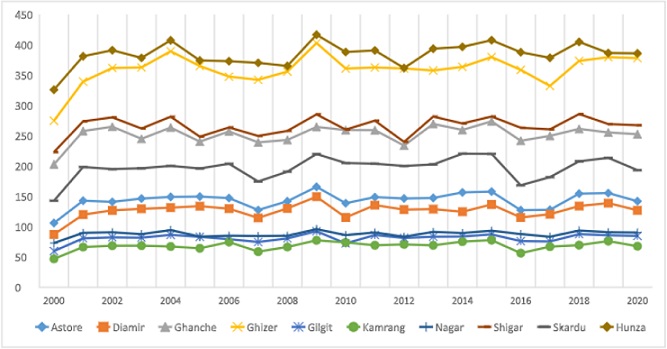
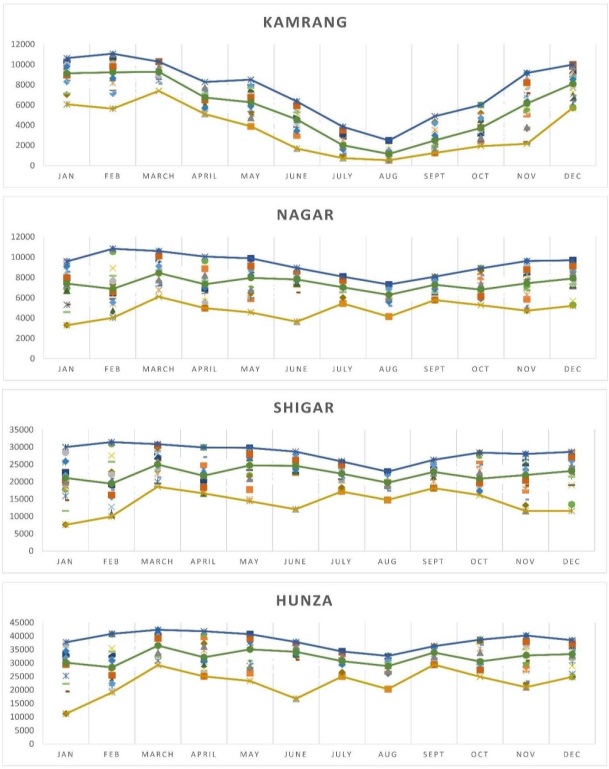
observed for the interannually recorded snow covers at Hunza and Shigar which indicates an increased amount of snowfall during the precipitation season. Many studies reveal an overall decline in the observed patterns of glacial volume, however, Kumar [55] has specifically discovered a recent increase in the SCA of the central Karakoram which is known as the Karakoram anomaly.

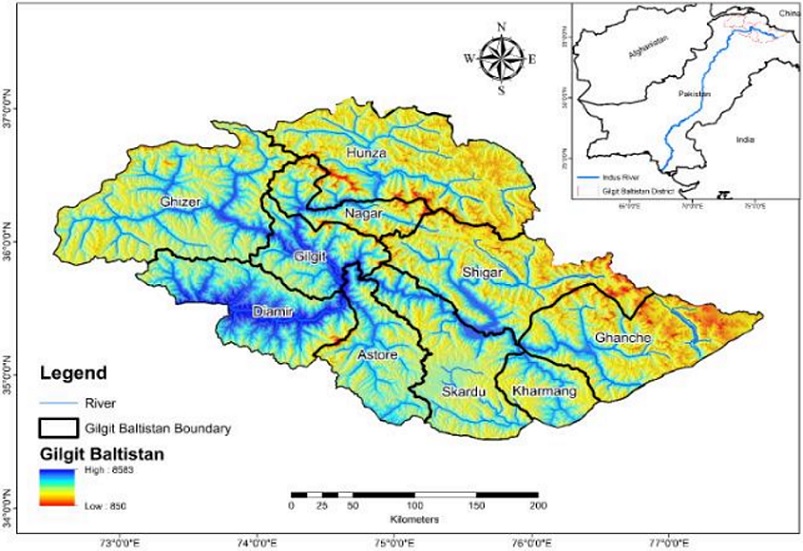
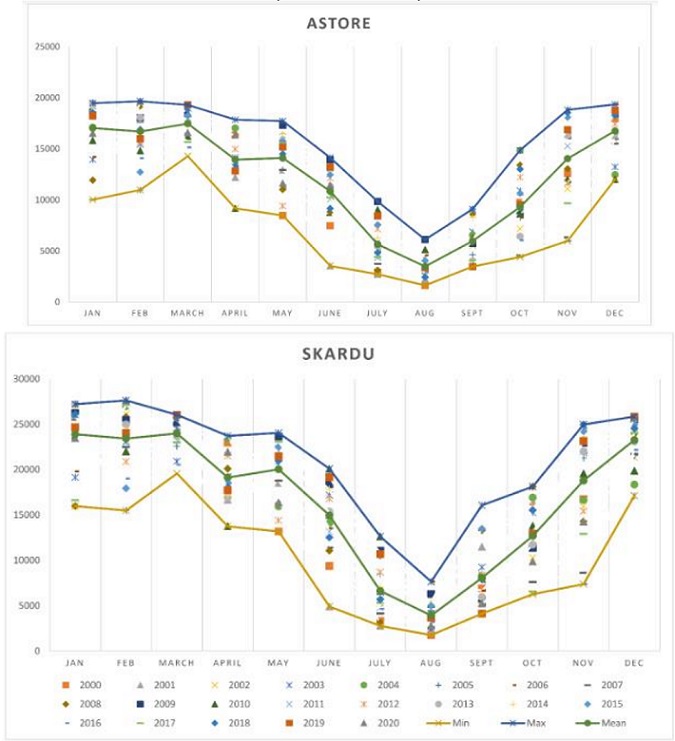
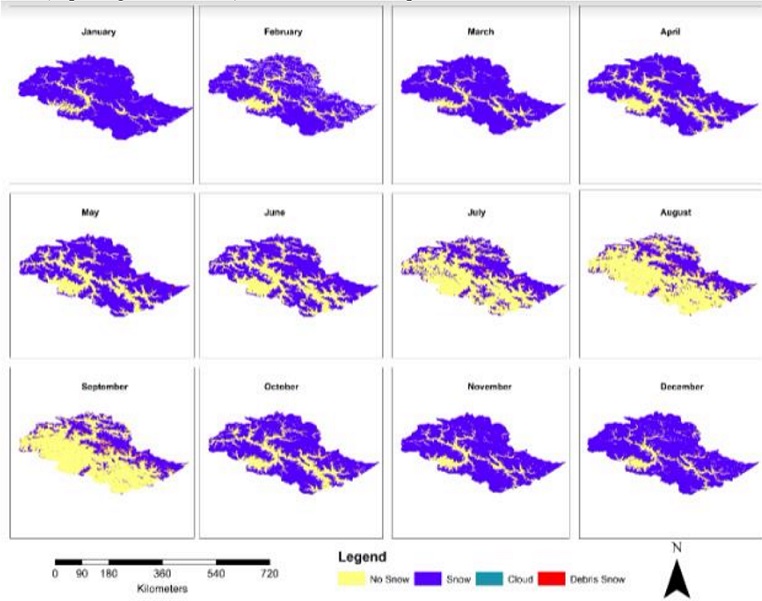
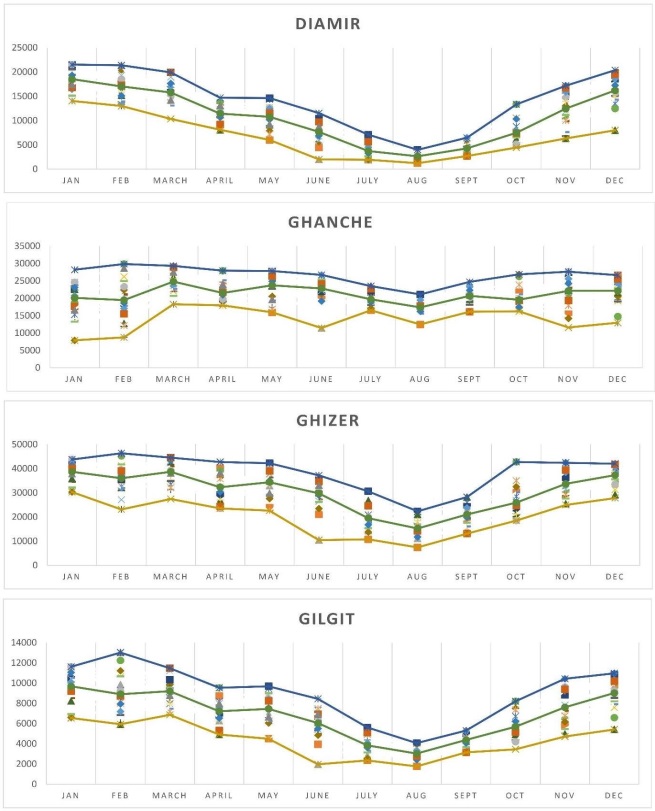
The snow cover figures for the Gilgit Baltistan Area offer three separate seasonal periods ie., snow cover withdrawal/depletion period, accumulation period, and the period with minimum snow cover period during April-June, July-September, and October to March respectively. For the area under study, the three periods of snow cover mobility area. (i) Accumulation period (October–March September–February) (ii) Depletion period (March– June) and (iii) Period with the lowest snow cover (July–August).

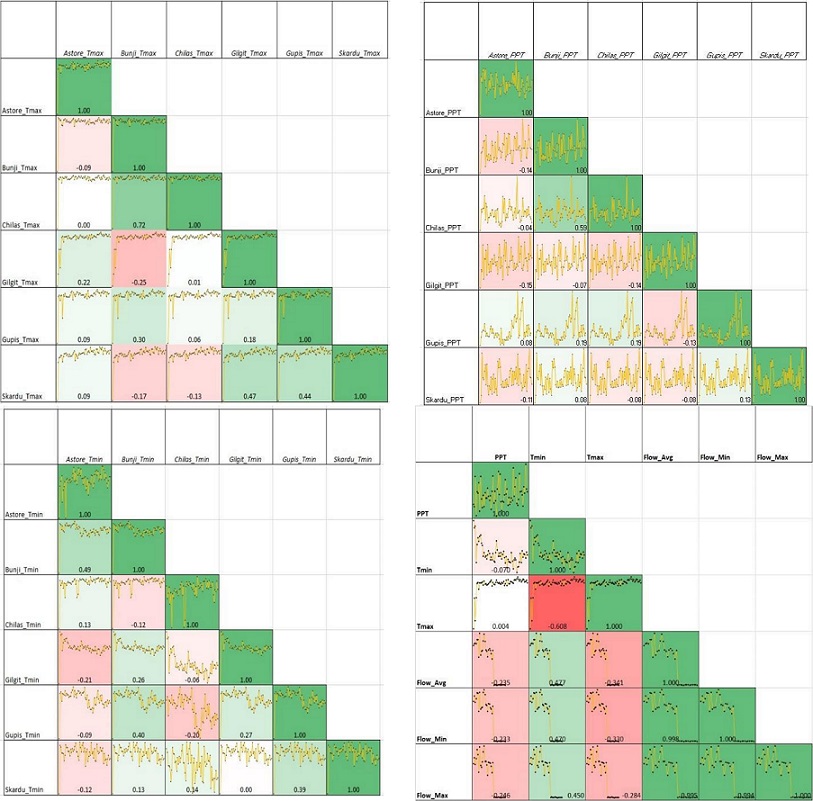
The positive relationship between the hydro-meteorological variables and the SCA indicates that snow cover amassment and reduction are reliant on temperature. As the temperature rises in late April, the river runoff increases on the rapid melting of snow covers; however, they may behave differently on different elevations. At a lower elevation, the melting begins as early as February, and rainfall has a certain intermittent contribution to the streamflow. Hussain [8] reported a year-to-year variability of runoffs due to rainfall in the snow amassment phase. Heading to the final part of the month of May, the stream flows are reduced, however, at the beginning of June, they start increasing again and are at their highest in the month of August due to high melting rates in elevated basins. The stream flows reduce in the amount in late September and early October. Hussain [8] also explained that the snow starts melting in February as soon as the temperature levels start rising and by the time of May and June almost all of it runs off.

The analysis of the hydro-meteorological characteristics of snow covers along with its statistical features, periodical, annual and inter-annual changeability and slow trend dynamism, is important to understand its consequential impacts on the hydrological and socio-economic systems of the region. This study offers the same. The high-resolution MODIS products were the most useful for this purpose. The main hindrance in the accurate snow cover evaluation was the existence of cloud cover. It was noted that the Aqua snow product had more cloud cover than the Terra snow product for the study area. The cloud filtering method was employed to get rid of the cloud cover and it performed well overall, however, it could not completely exclude the cloud cover factor from the input snow data. It usually happens if the clouds are bigger or remain for a significantly longer period than the time the window dimension of the applied spatiotemporal filter. For the study region, such occurrences are observed during the spring and winters. Summers and fall generally have minimal clouds and a clear sky with a constant cloud cover reading. Therefore, the cloud filtering method is not fully successful during winters especially for the glacier bodies at high elevated sub-basins. With the overall performance of this cloud filtering technique as sufficient, it is advised to use this filter prior to working on the evaluation of snow products. In this perspective, the results based on cloud-filter hyper-temporal snow representations for all the basin areas are exceptional in the face of many geographical variables. Some modelling procedures [56][15][34] using 8-daily MODIS snow datasets, free of cloud cover filter present the runoff evaluations against variable climate. We consider such evaluations as less accurate when it comes to assessing the correlation of snow cover with the runoff and studying their implications quantitatively.

Pakistan’s water storage capability was originally 13% of the exiting mean annual runoffs at the time of initial basin engineering, however, currently, it has reduced to 9% and is suffering a constant decline due to heavy alluviation from young HKH mountain ranges [49]. This calls for sufficient adaptative measures and research into the prospective changeability in the hydrology of the region.

Conclusion

The snow cover mechanism is an essential component of the regional water cycle as it regulates hydrological availability through the dynamics of snow amassment and depletion. In this way, the snow cover mechanism with respect to different altitudes of a basin area identify the hydrological dynamics of the region. A direct relation has been observed between the temperature characteristics of the region and melting of snow covers that contribute to the streamflow.

The major contribution in this hydro-meteorological analysis of the basin region was of MODIS satellite dataset MOD10A2 useful for its greater resolution and accurate predictions about the hydrology of inaccessible regions. The evaluation of MODIS products from 21 years indicated an overall minor rise in the mean SCA with some basins showing slight variability. The subordinate basins of Gilgit Baltistan are stretched across mid and high latitudes with the streamflow relying more on the amassment and melting of snow consequent to temperature variation than precipitation. Additionally, glaciers are spread across 20-25% of the region and snow accumulates over 85–90% of the area under study.

Time-related data indicates three different periods of snow cover mechanisms: (i) Accumulation period during Sept-Feb (ii) Reduction period during Mar-June (iii) Minimum snow cover period between Jul-Aug. A station-based longitudinal assessment of snow extent is essential in the evaluation of comparative mass participation from varying altitudes to investigate regional hydrology. This study asserts that it is important to investigate ice and water dynamics on the regional and basin level. In addition to that, there is a need of filling up the data gaps from ground stations to give a comprehensive account of snow cover correlation with meteorological variables in relation to altitudinal variability.

The dataset requires a short time limit to derive accurate results of analysis of long-term data for snow covers. This study has enabled an insight into the current snow cover state along with its spatiotemporal variability and other dynamics in relation to the geographical and meteorological features of the areas under study. The findings of this study are relevant to the hydrology of the region and can thus be instrumental in hydrological modelling and validating methods of operation. The results for the correlation of climatic and snow cover dynamics can serve as hydrological and streamflow forecasts to manage water sources.

Appendix A:

Figure A1: Inter-Annual snow cover inclination and depletion curves from 2000–2020 showing quantitative variations of seasonal snow cover over for Diamir, Gilgit and their subbasin.

Figure A2:Inter-Annual snow cover inclination and depletion curves from 2000–2020 showing quantitative variations of seasonal snow cover over for other basins.

Reference

[1] K. W. Rasul, G., Chaudhry, Q.Z., Mahmood, H., and Dahe, “Glaciers and glacial lakes under changing climate in Pakistan,” Pakistan J. Meteorol., vol. 15, no. 8, pp. 1–8, 2011.

[2] A. G. Awan and M. Imran, “Factors Affecting Food Price Inflation in Pakistan,” ABC J. Adv. Res., vol. 4, no. 1, pp. 75–90, Jun. 2015, doi: 10.18034/ABCJAR.V4I1.46.

[3] J. Qiu, “Indus River waters shrinking, Nature,” vol. 534, pp. 600–601, 2016.

[4] D. K. Hall and G. A. Riggs, “Accuracy assessment of the MODIS snow products,” Hydrol. Process., vol. 21, no. 12, pp. 1534–1547, Jun. 2007, doi: 10.1002/HYP.6715.

[5] T. P. Barnett, J. C. Adam, and D. P. Lettenmaier, “Potential impacts of a warming climate on water availability in snow-dominated regions,” Nat. 2005 4387066, vol. 438, no. 7066, pp. 303–309, Nov. 2005, doi: 10.1038/nature04141.

[6] W. W. Immerzeel, L. P. H. Van Beek, and M. F. P. Bierkens, “Climate change will affect the asian water towers,” Science (80. )., vol. 328, no. 5984, pp. 1382–1385, Jun. 2010, doi: 10.1126/SCIENCE.1183188/SUPPL_FILE/IMMERZEEL.SOM.PDF.

[7] H. G. Rees and D. N. Collins, “Regional differences in response of flow in glacier-fed Himalayan rivers to climatic warming,” Hydrol. Process., vol. 20, no. 10, pp. 2157–2169, Jun. 2006, doi: 10.1002/HYP.6209.

[8] S. Sajidin Hussain, M. Mudasser, M. Munir Sheikh, and N. Manzoor, “) 75 ♦ Global Change Impact Studies Centre,” Islam. Pakistan J. Meteorol., vol. 2, p. 76, 2005.

[9] M. F. P. Immerzeel, W.W., Droogers, P., de Jong, S.M., and Bierkens, “Large-scale monitoring of snow cover and runoff simulation in Himalayan River basins using remote sensing,” Remote Sens. Env., vol. 113, no. 40–49, 2009.

[10] H. J. Archer, D.R. and Fowler, “Spatial and temporal variations in precipitation in the Upper Indus Basin, global teleconnections and hydrological implications,” Hydrol. Earth Syst. Sci., vol. 1, no. 8, pp. 47–61, 2004.

[11] C. Hewitt, K., Young, G.J., and David, “Hydrological investigations at Biafo Glacier, Karakoram Range, Himalaya; An important source of Water for the Indus River, Annals of Glaciol,” vol. 13, 1989.

[12] K. Hewitt, “The Karakoram anomaly? Glacier expantion and the ‘Elevation effect,’ Karakoram Himalaya,” Mt. Res. Dev., vol. 25, no. 4, pp. 332–340, 2005, doi: 10.1659/0276-4741(2005)025[0332:TKAGEA]2.0.CO;2.

[13] B. B. Sirguey, P., Mathieu, R., Arnaud, Y., and Fitzharris, “Seven years of snow cover monitoring with MODIS to model catchment discharge in New Zealand,” IEEE Int. Geosci. Remote Sens. Symp. (IGARSS, 2009), Cape Town, pp. 863–866., 2009.

[14] B. Liniger, H., Weingartner, R., and Grosjean, M., Eds., “Mountains of the World: Water Towers for the 21st Century. Mountain Agenda for the Commission on Sustainable Development (CSD),” 1998.

[15] IPCC, “Climate Change 2007: The Physical Science Basis — IPCC,” 2007. https://www.ipcc.ch/report/ar4/wg1/ (accessed Aug. 11, 2022).

[16] D. R. Gurung, A. V Kulkarni, A. Giriraj, K. S. Aung, B. Shrestha, and J. Srinivasan, “Changes in seasonal snow cover in Hindu Kush-Himalayan region,” Cryosph. Discuss., vol. 5, no. 2, pp. 755–777, Mar. 2011, doi: 10.5194/TCD-5-755-2011.

[17] A. V. Gurung, D.R., Giriraj, A., Aung, K.S., Shrestha, B., and Kulkarni, “Snow-Cover Mapping and Monitoring in the Hindu Kush-Himalayas, Kathmandu,” ICIMOD, 2011.

[18] S. Maskey, S. Uhlenbrook, and S. Ojha, “An analysis of snow cover changes in the Himalayan region using MODIS snow products and in-situ temperature data,” Clim. Change, vol. 108, no. 1, pp. 391–400, Sep. 2011, doi: 10.1007/S10584-011-0181-Y/METRICS.

[19] “Institutional Dysfunction and Challenges in Flood Control: A Case Study of the Kosi Flood 2008 on JSTOR.” https://www.jstor.org/stable/25663989 (accessed Sep. 10, 2023).

[20] A. A. Tahir, P. Chevallier, Y. Arnaud, M. Ashraf, and M. T. Bhatti, “Snow cover trend and hydrological characteristics of the Astore River basin (Western Himalayas) and its comparison to the Hunza basin (Karakoram region),” Sci. Total Environ., vol. 505, pp. 748–761, Feb. 2015, doi: 10.1016/J.SCITOTENV.2014.10.065.

[21] A. Z. Zaidi, Z. Yasmeen, and M. D. Siddiqui, “Glacial Lake Outburst Flood (GLOF) risk mapping in Hunza River Basin (Pakistan) using geospatial techniques,” RAST 2013 - Proc. 6th Int. Conf. Recent Adv. Sp. Technol., pp. 191–195, 2013, doi: 10.1109/RAST.2013.6581198.

[22] F. Bajracharya, S.R., Maharjan, S.B., and Shrestha, “The Status of Glaciers in the Nepal Himalayas,” ICIMOD, 2011.

[23] N. Diodato, G. Bellocchi, and G. Tartari, “How do Himalayan areas respond to global warming?,” Int. J. Climatol., vol. 32, no. 7, pp. 975–982, Jun. 2012, doi: 10.1002/JOC.2340.

[24] A. B. Shrestha, C. P. Wake, P. A. Mayewski, and J. E. Dibb, “Maximum Temperature Trends in the Himalaya and Its Vicinity: An Analysis Based on Temperature Records from Nepal for the Period 1971–94,” J. Clim., vol. 12, no. 9, pp. 2775–2786, Sep. 1999, doi: 10.1175/1520-0442(1999)012.

[25] S. Menon, D. Koch, G. Beig, S. Sahu, J. Fasullo, and D. Orlikowski, “Black carbon aerosols and the third polar ice cap,” Atmos. Chem. Phys., vol. 10, no. 10, pp. 4559–4571, 2010, doi: 10.5194/ACP-10-4559-2010.

[26] S. Hasson, V. Lucarini, S. Pascale, and J. Böhner, “Seasonality of the hydrological cycle in major South and Southeast Asian river basins as simulated by PCMDI/CMIP3 experiments,” Earth Syst. Dyn., vol. 5, no. 1, pp. 67–87, Feb. 2014, doi: 10.5194/ESD-5-67-2014.

[27] P. Konz, M., Finger, D., Buergi, C., Normand, S., Immerzeel, W. W., Merz, J., Girirah, A., and Burlando, : “Calibration of a distributed hydrological model for simulations of remote glaicerised Himalayan catchments using MODIS snow cover data, Global Change: Facing Risks and Threats to Water Resources (Proc. Of the Sixth World FRIEND Conference, Fez, Morocco,” vol. 340, pp. 465–473, 2010.

[28] H. J. Fowler and D. R. Archer, “Conflicting Signals of Climatic Change in the Upper Indus Basin,” J. Clim., vol. 19, no. 17, pp. 4276–4293, Sep. 2006, doi: 10.1175/JCLI3860.1.

[29] K. S. Treydte et al., “The twentieth century was the wettest period in northern Pakistan over the past millennium,” Nat. 2006 4407088, vol. 440, no. 7088, pp. 1179–1182, Apr. 2006, doi: 10.1038/nature04743.

[30] T. Bolch et al., “The state and fate of Himalayan glaciers,” Science, vol. 336, no. 6079, pp. 310–314, Apr. 2012, doi: 10.1126/SCIENCE.1215828.

[31] R. Bhambri, T. Bolch, P. Kawishwar, D. P. Dobhal, D. Srivastava, and B. Pratap, “Heterogeneity in glacier response in the upper Shyok valley, northeast Karakoram,” Cryosphere, vol. 7, no. 5, pp. 1385–1398, 2013, doi: 10.5194/TC-7-1385-2013.

[32] J. Gardelle, E. Berthier, and Y. Arnaud, “Slight mass gain of Karakoram glaciers in the early twenty-first century,” Nat. Geosci. 2012 55, vol. 5, no. 5, pp. 322–325, Apr. 2012, doi: 10.1038/ngeo1450.

[33] M. König, J. G. Winther, and E. Isaksson, “Measuring snow and glacier ice properties from satellite,” Rev. Geophys., vol. 39, no. 1, pp. 1–27, Feb. 2001, doi: 10.1029/1999RG000076.

[34] J. Tong, S. J. Déry, and P. L. Jackson, “Topographic control of snow distribution in an alpine watershed of western Canada inferred from spatially-filtered MODIS snow products,” Hydrol. Earth Syst. Sci., vol. 13, no. 3, pp. 319–326, Mar. 2009, doi: 10.5194/HESS-13-319-2009.

[35] E. P. Maurer, J. D. Rhoads, R. O. Dubayah, and D. P. Lettenmaier, “Evaluation of the snow-covered area data product from MODIS,” Hydrol. Process., vol. 17, no. 1, pp. 59–71, Jan. 2003, doi: 10.1002/HYP.1193.

[36] S. Barman and R. K. Bhattacharjya, “Change in snow cover area of Brahmaputra river basin and its sensitivity to temperature,” Environ. Syst. Res. 2015 41, vol. 4, no. 1, pp. 1–10, Oct. 2015, doi: 10.1186/S40068-015-0043-0.

[37] N. Forsythe, H. J. Fowler, C. G. Kilsby, and D. R. Archer, “Opportunities from Remote Sensing for Supporting Water Resources Management in Village/Valley Scale Catchments in the Upper Indus Basin,” Water Resour. Manag. 2011 264, vol. 26, no. 4, pp. 845–871, Nov. 2011, doi: 10.1007/S11269-011-9933-8.

[38] S. Lee, A. G. Klein, and T. M. Over, “A comparison of MODIS and NOHRSC snow-cover products for simulating streamflow using the Snowmelt Runoff Model,” Hydrol. Process., vol. 19, no. 15, pp. 2951–2972, Oct. 2005, doi: 10.1002/HYP.5810.

[39] A. A. Tahir, P. Chevallier, Y. Arnaud, and B. Ahmad, “Snow cover dynamics and hydrological regime of the Hunza River basin, Karakoram Range, Northern Pakistan,” Hydrol. Earth Syst. Sci., vol. 15, no. 7, pp. 2275–2290, 2011, doi: 10.5194/HESS-15-2275-2011.

[40] A. E. Tekeli, Z. Akyürek, A. A. Şorman, A. Şensoy, and A. Ü. Şorman, “Using MODIS snow cover maps in modeling snowmelt runoff process in the eastern part of Turkey,” Remote Sens. Environ., vol. 97, no. 2, pp. 216–230, Jul. 2005, doi: 10.1016/J.RSE.2005.03.013.

[41] C. P. Wake, “Snow accumulation studies in the central Karakoram,” Proc. East. Snow Conf. 44th Annu. Meet. Fredericton, Canada, pp. 19–33, 1987.

[42] S. Hasson, V. Lucarini, and S. Pascale, “Hydrological cycle over South and Southeast Asian river basins as simulated by PCMDI/CMIP3 experiments,” Earth Syst. Dyn., vol. 4, no. 2, pp. 199–217, Jul. 2013, doi: 10.5194/ESD-4-199-2013.

[43] A. M. Ali, G., Hasson, S., and Khan, “Climate Change: Implications and Adaptation of Water Resources in Pakistan, GCISC-RR-13,” Glob. Chang. Impact Stud. Cent. (GCISC), Islam. Pakistan, 2009.

[44] R. J. Karl, T. R., Knight, R. W., Gallo, K. P., Peterson, T. C., Jones, P. D., Kukla, G., Plummer, N., Razuvayev, V., Lindseay, J. and Charlson, “A New Perspective on Recent Global Warming: Asymmetric Trends of Daily Maximum and Minimum Temperature,” B. Am. Meteorol. Soc, vol. 74, pp. 1007–1023, 1993.

[45] D. R. Easterling et al., “Maximum and Minimum Temperature Trends for the Globe,” Science (80. )., vol. 277, no. 5324, pp. 364–367, Jul. 1997, doi: 10.1126/SCIENCE.277.5324.364.

[46] K. F. Ali and D. H. De Boer, “Spatial patterns and variation of suspended sediment yield in the upper Indus River basin, northern Pakistan,” J. Hydrol., vol. 334, no. 3–4, pp. 368–387, Feb. 2007, doi: 10.1016/J.JHYDROL.2006.10.013.

[47] D. K. Hall, G. A. Riggs, V. V. Salomonson, N. E. DiGirolamo, and K. J. Bayr, “MODIS snow-cover products,” Remote Sens. Environ., vol. 83, no. 1–2, pp. 181–194, Nov. 2002, doi: 10.1016/S0034-4257(02)00095-0.

[48] J. Wu, P. Li, H. Qian, Z. Duan, and X. Zhang, “Using correlation and multivariate statistical analysis to identify hydrogeochemical processes affecting the major ion chemistry of waters: a case study in Laoheba phosphorite mine in Sichuan, China,” Arab. J. Geosci., vol. 7, no. 10, pp. 3973–3982, Oct. 2014, doi: 10.1007/S12517-013-1057-4/METRICS.

[49] D. H. Levinson and A. M. Waple, “State of the Climate in 2003.,” BAMS, vol. 85, no. 6, pp. 881–881, Jun. 2004, doi: 10.1175/BAMS-85-6-LEVINSON.

[50] M. Hasan, A. Baig, and G. Rasul, “The Effect of Eurasian Snow Cover on the Monsoon Rainfall of Pakistan”, Accessed: Sep. 10, 2023. [Online]. Available: http://www.cpc.noaa.gov/data/snow/

[51] R. J. Braithwaite and S. C. B. Raper, “Estimating equilibrium-line altitude (ELA) from glacier inventory data,” Ann. Glaciol., vol. 50, no. 53, pp. 127–132, 2009, doi: 10.3189/172756410790595930.

[52] A. Stehr and M. Aguayo, “Snow cover dynamics in Andean watersheds of Chile (32.0-39.5°ĝ€S) during the years 2000-2016,” Hydrol. Earth Syst. Sci., vol. 21, no. 10, pp. 5111–5126, Oct. 2017, doi: 10.5194/HESS-21-5111-2017.

[53] Z. Tang, J. Wang, H. Li, and L. Yan, “Spatiotemporal changes of snow cover over the Tibetan plateau based on cloud-removed moderate resolution imaging spectroradiometer fractional snow cover product from 2001 to 2011,” https://doi.org/10.1117/1.JRS.7.073582, vol. 7, no. 1, p. 073582, Mar. 2013, doi: 10.1117/1.JRS.7.073582.

[54] G. Zhang, H. Xie, T. Yao, T. Liang, and S. Kang, “Snow cover dynamics of four lake basins over Tibetan Plateau using time series MODIS data (2001–2010),” Water Resour. Res., vol. 48, no. 10, Oct. 2012, doi: 10.1029/2012WR011971.

[55] D. Kumar, A. Choudhary, and A. P. Dimri, “Regional climate changes over Hindukush-Karakoram-Himalaya region,” Sci. Geopolit. White World Arctic-Antarctic-Himalaya, pp. 143–159, Aug. 2017, doi: 10.1007/978-3-319-57765-4_11/COVER.

[56] M. Akhtar, N. Ahmad, and M. J. Booij, “The impact of climate change on the water resources of Hindukush–Karakorum–Himalaya region under different glacier coverage scenarios,” J. Hydrol., vol. 355, no. 1–4, pp. 148–163, Jun. 2008, doi: 10.1016/J.JHYDROL.2008.03.015.