E-ISSN:2709-6130
P-ISSN:2618-1630

Research Article

International Journal of Innovations in Science & Technology

2023 Volume 5 Number 4 Oct-Dec

Rock fall Hazard and Risk Assessment Using GIS Along JaglotSkardu Road, Pakistan

Bilal. M. F1*, Ghazi. S2

1,2Center for Geographic Information System, University of the Punjab, Lahore, 54000, Pakistan

Abstract
Rockfall is one of the major hazards all around the world. In Northern Pakistan, Jaglot-Skardu. The road is the main highway that connects KKH and Skardu, located in Gilgit Baltistan. The Area is very unique to study rock falls because of the variety of changes in the geological, seismological, and atmospheric conditions. The hazard and risk mapping of rock falls includes preparation of rock fall inventory map, susceptibility map and spatial analysis of Rock fall with its conditioning factors using GIS and Remote Sensing. The inventory map includes record of past rock falls along the road and prepared on hill shade map of the area using ArcGIS 10.4. Susceptibility maps of the area is generated using Weighted overlay technique. In Weighted overlay technique we use multi influencing factors of the rock falls as such as aspect, geology, slope, elevation, faults, curvature, Topographic wetness index, streams and road. Each map unit is than reclassified and assigned weight in weighted overlay to generate susceptibility map of area. In inventory map, almost 200 rock falls are marked and delineated on hill shade map of the area. The results of susceptibility show four zones i.e., low, moderate, high and very high hazard zones.The spatial analysis of rock falls showed that fault and geology is the main factor that are triggering the rock falls in the area. The areas which are present low and moderate susceptible zones are somehow safe and suitable for future planning and development and areas present in high to very high susceptible zones, large scale geotechnical investigations are required before any development and construction.

Keywords: GIS, Karakoram Highway (KKH), Remote Sensing, Susceptibility, Rock fall inventory

Corresponding Author How to Cite this Article
Muhammad Fahad Bilal, Center for Geographic Information System, University of the Punjab, Lahore, 54000, Pakistan
Muhammad Fahad Bilal, Shahid Ghazi, Rock fall Hazard and Risk Assessment Using GIS Along JaglotSkardu Road, Pakistan. IJIST. 2023 ;5(4):339-359 https://journal.50sea.com/index.php/IJIST/article/view/526

Introduction

Extreme downslope movement of rock by free fall, rolling, leaping, and bouncing is known as Rock falls [1]. Rock falls are a result of different geomorphic processes and represent a type of geohazard, causing economic and social loss by damaging infrastructure and buildings. They commonly occur in nearly all mountainous regions of the world, and understanding them is important while working on development projects. Landslides make up more than 9% of natural disasters worldwide [2]. Transportation corridors in many regions are often susceptible to landslides. In particular, rock falls are a significant risk in several rock cuts along roadways in hilly areas, resulting in fatalities as well as significant property damage and injuries [3]. Every year, hundreds of deaths are reported around the globe. Around 18,200 casualties caused due to landslides were reported in 2003 [4]. Rock falls not only harm human life but also result in significant financial losses [5]. Like other countries, Pakistan is also facing problems like rock falls, particularly in the Northern regions. Himalaya and Karakoram ranges, which include the highest mountain peaks in the world such as K2, Nanga-Parbat, and Rakaposhi, etc.) and have an active fault system are mostly facing this issue [6]. Deforestation, construction of roads, bridges, embankments, and other infrastructure projects, as well as human activity in other development projects, have increased the annual number of landslides. In mountainous areas, rock falls are among the most frequent types of landslides.

Hazard and risk assessment is very important in reducing the effects of natural disasters, particularly landslides [7]. Rock falls may be driven by earthquakes, precipitation, freeze-thaw cycles [8], or the gradual weathering of rock and discontinuities under the proper climatic conditions. They can be generated from cliffs of different sizes (from a few meters to hundreds of meters high) and natures (lithologic, structural, etc.), and involve a wide range of volumes. In Pakistan, most of the area is exposed to earthquakes as it comprises three major tectonic plates i.e. Indian, Eurasian, and Arabian [9]. In regions where they occur, rock falls represent a serious threat to people, property, and utilities as they are among the most damaging mass events.

A regional-to-site approach to assess risk associated with rock falls and debris flow can be implemented to find Highly hazardous sites using remote sensing and analysis of geographic information systems; these sites were then further examined for risk assessment [10]. Landslide susceptibility mapping is one of the primary steps to support highway authorities in maintaining smooth and hazard-free traveling. GIS was used to gather and process geological and geomorphological data. While generating the susceptibility map, many landslide conditioning and triggering variables were considered. Lithology, seismicity, rainfall volume and intensity, faults, elevation, slope angle, aspect, curvature, land cover, and water are used to prepare maps. [11]. GIS software was used in this work to collect and process topographical, geological, and remote sensing data. In mountainous areas, landslides are regarded as disasters that cause significant social and economic damage [12].

Javed et al[13] investigated landslide hazard mapping of Bagh District in Azad Kashmir. A landslide is a process that includes soil flow on a slope, rock falls, flow movement, creep movement, and snow avalanches. High-risk locations for landslide hazards were identified using the results of landslide hazard zonation mapping. Bacha et al[14] carried out landslide inventory and susceptibility mapping of Nagar Valley Hunza, Pakistan. They used SPOT images to prepare the landslide inventory and marked almost 173 landslides. The landslide inventory was subsequently divided into modeling and validation data sets. For landslide susceptibility mapping they used four models for the selection of landslide causative factors. The success rate and area under curves criteria were used to validate the generated landslide susceptibility maps. worked over landslide susceptibility using GIS and weighted overlay method: a case study from NW Himalayas, Pakistan. This research investigates the Tehsil Balakot area of the Pakistani NW Himalayas for landslide susceptibility. GIS and ERDAS Imagine software were used in this work to collect and process topographical, geological, and remote sensing data. In mountainous areas, landslides are regarded as disasters that cause significant social and economic damage. Due to the frequency of faults, extremely steep slopes, and lithology, the majority of the studied region (69%) falls in high and very high susceptibility zones. Therefore, sites close to faults and on steep slopes are dangerous for further development and construction.

Objectives:

Digital Elevation Models (DEM) can be utilized to find potential rockfall source regions. Inventory maps are essential for risk assessment and identifying hazards that predict the probability of Rockfalls. The Rockfalls inventory map's primary purpose is to show the location of rockfalls. This Study was carried out to generate rockfall hazard and risk maps of JaglotSkardu road Northwest Himalaya, Pakistan using Remote sensing and GIS. Inventory map mark the traces of old rockfalls in the area while Susceptibility is the probability or likelihood that a risk phenomenon/hazard happens in particular area [2].

Novelty: Previously no research was done in this area for rockfalls. The researchers used different approaches to study landslides using Remote sensing images and GIS. This research was focused on regional to site approach in which we interpret the rockfalls that were identified along the Jaglot-Skardu Road. The spatial analysis of rockfalls with the conditioning factors was also done in the present study. This approach gave very authentic results. Previously researchers used 30m, 90m DEM data but in the present study, the hazard and risk maps were prepared using high resolution DEM data i-e 12.5m in ArcGIS 10.4 which can be used further for planning and development.

Material and Method

Study Area:

The study area is Jaglot-skardu Road which is located in beautiful Gilgit Baltistan Pakistan having starting coordinates 35° 42.833' N latitude and 74° 37.778' E longitude and ending coordinates 35° 13.613' N latitude and 75° 53.655' E longitude shown in Figure 1. JaglotSkardu Road, is a 167km long highway in Pakistan that links Karakorum highway and Skardu in Gilgit−Baltistan. Frontier Works Organization (FWO) is the first to build the Jaglot to Skardu Road in 1984, however it was extremely damaged due to regular landslide activity and heavy snowfall in the section. Upgrading and broadening the road was crucial to provide a safe way for people that want to visit Skardu, traffic on the route, and to lessons number of tragic incidents every year. The average temperature in winter and summer seasons is -1.2oC to 29.9oC. According to Pakistan Metrological department, July is the warmest month with temperature 31.06oC while coldest month is the with temperature falling below -12°C.

The annual rainfall in the area varies from 900-1203mm. Rainfall takes place in low lying areas while in higher areas snowfall takes place. Rocks that are exposed in the study area are mostly metamorphic rocks i.e., quartzite, phyllite, schists, gneisses and amphibolite with bands of marble. These rocks contain intrusions of diorite, granodiorite and granite. The geology along road also contains quaternary deposits. Long-term orogeny, which started during the tertiary period when the Indian and African plates split and started to migrate northward, is affecting the area's mountainous landscape. As the Indian and Eurasian plates clashed, mountain ranges such as the Himalaya, the Kohistan Island Arc, and the Karakoram formed parallel to one another. Mountain ranges and other geological features formed side by side. The area's hilly topography has grown since the Tertiary, when it experienced extended orogeny [15]. The area is tectonically active with shear zones and active fault systems which include. Main Boundary Thrust (MBT), Main Mantle Thrust (MMT), and Main Karakorum Thrust (MKT).

Figure 1: Location Map of Jaglot-Skardu Road.

Inventory Mapping Data:

A rock fall Inventory map is a map that shows the history of the rock falls in a specific area. The objective of this study is to identify slopes through anomalous topography to point out landslide surfaces. [16]. Remote sensing imagery such as digital elevation models (DEM), aerial photographs and Google Earth Pro can be used to characterized and record these topographic patterns [17]. In this research Digital elevation model and google earth pro was used to prepare rock fall inventory map of the study area.

We used PALSAR DEM which was downloaded from the Alaska Satellite Facility (ASF) website. The Japan Aerospace Agency (JAXA) has launched PALSAR, one of the most effective radar systems [18]. High-quality Digital Elevation Models with a 12.5m resolution can be obtained using this radar system. PALSAR stands for Phased Array type L-band Synthetic Aperture Radar. Then 3D-Google earth images were used and analyzed to mark previous rock falls and all the features of the landslides i.e., head scarp, collapse materials etc. All these features are identified using Google Earth Pro and then there KML was used to prepare the map.

Susceptibility Mapping Data:

Based on the variables that cause slope instability, the likelihood of slope failure is quantitatively estimated in statistical analysis methods. By applying GIS-based multi-criteria analysis, such techniques could be used to build susceptibility maps [19]. Rockfalls are influenced by a variety of elements, including slopes, geology, rainfall, vegetation, seismicity, and many others [20]. In order to prepare the susceptibility data, the following are the indicator map units (data) that were utilized for mapping risk of rock falls or landslides. Figure 2 is showing the methodology used to conduct this research.

Figure 2: Flow Diagram of Methodology

Elevation map (DEM) of 12.5m resolution was downloaded from open source i.e., USGS explorer (https://asf.alaska.edu/

• Slope, slope aspect, curvature, TWI, and streams are generated using spatial analyst tool in in ArcGIS 10.4

• Geology and faults are derived from geological map taken from Geological survey of

• Road is taken from shape file of roads of Pakistan

Elevation:

When it comes to slope instability, rise or elevation is crucial. There are more landslides when the height is higher. Elevation data which is also called as DEM is freely downloaded from internet resources. Elevation changes in the study area is from a minimum of 1000m to a maximum of >6000m. The elevation map was classified into five classes with 1000m interval i.e. 1000-2000, 2000-3000, 3000-4000, 4000-6000 and >6000 in meters as shown in Figure 3A

Slope Angle:

As the slope is directly related to landslides, it is frequently used in the creation of landslide susceptibility maps. According to historical data, the steeper the slope, the higher the chance that it might fail [21]. The slope angle in the study area ranges from < 15 to > 45. It was classified in to five classes as less than 15, 15-25, 25-35, 35-45 and greater than 45 degrees. The slope angle of the area is shown in Figure 3B.

Slope Aspect:

Slope's direction is known as an aspect. This angle determines how much sunlight there is and how much precipitation are there [22]. Aspects are evaluated in a clockwise direction from 0 to 360. In contrast, 0 denotes the north, 90 the east, 180 the south, and 270 the west. Due to rain, the southwest and west are most severely affected [23]. The slope aspect of the study area was classified in to 10 classes as Flat (-1), North (0-67.5), Northeast (22.5-67.5), East (67.5- 112.5), Southeast (112.5-157.5), South (157.5-202.5), Southwest (202.5-247.5), West (247.5- 292.5), Northwest (292.5-337.5), North (337.5-360) as in Figure 3C

Curvature:

The classification of a region to concave and convex surfaces to determine the areas that are vulnerable to landslides is referred to as curvature. According to available literature, there are increased chances of rock falls/landslides in such specific locations where surface is concave. There are very few chances of landslides or rock falls on flat surfaces. The curvature of the study area is divided in two classes as shown in Figure 3D

Streams:

The proximity of streams to a slope is another factor that affects slope stability. While it has the potential to erode by undercutting the slope toe or by saturating the slope material situated within the water level of the stream ways [24], it diverts the hydrologic routes of slope and it may negatively affect slope stability [25]. A raster calculator tool is usually used to produce streams from Digital Elevation Models (DEMs) [26] As in Figure 3E.

Figure 3: (A) Elevation of the area (B) Slope of the area (C) Slope Aspect of the area (D) Curvature of the area (E) Streams of the area

Geology of the study site:

Geology and the occurrence of rock falls/landslides are closely related. The number of materials that are susceptible to landslides and the tensile strength of slopes are both governed by rock type. The geology of the area is extracted from geological map of Pakistan and digitized in ArcGIS 10.4. Geology of the area consists nine lithologies as shown in Figure 4A. Topographic wetness index:

TWI is topographic wetness index that shows surface saturation and soil moisture. It indicates the effect of hydrology on local topography[27]. It can be calculated by:

TWI=ln(a/tanβ)

Where a= specific upslope area,

Tanβ= local slope angle of a grid

Topographic wetness index in our study area is divided into four classes i.e., < 0, 0-5, 5, 10, >10 as shown in the Figure 4B

Faults:

Earthquakes happen regularly along faults, causing rock to fracture and materials to move in pulse-like action [28].Faults play a significant part in determining the structural integrity of any place. Since faults tend to weaken the rock by breaking it, they have a significant effect on the stability of the slope. Rock falls are thus seen to be more common close to faults and to rapidly decrease in number as distance increases[29]. For this thematic layer was generated using tectonic map of Pakistan and by applying multiple ring buffer in ArcGIS having classes 300, 500, 1500 and 2000 meters as shown in Figure 4C

Roads:

Road development always tends to reduce toe abutment and alter topography in highelevation areas, like the Jaglot-Skardu Road. As a result, stress increases on the back slope, leading to tensional cracks and fractures in the formation [30]. Depending on its closeness, the newly built road portion may act as a blockage, a net sink, or a channel for water flow. As a result, it frequently becomes a source of landslides Therefore, several studies have found that the distance to the road is one of the human factors that contributes to slope collapses [31]. For this multiple ring buffer is applied on Jaglot-Skardu Road with four classes i.e., 50, 100, 150, 200 meters as shown in Figure 4D.

Figure 4: (A) Geology of the area (B) TWI of the area (C) Fault Buffer of the area (D) Road Buffer of the area

Data Reclassification:

Using the reclassify tool in ArcMap 10.4, all layers such as slope, slope aspect, curvature, fault buffer, stream buffer, TWI, Road Bufferang geology etc. were reclassified into new classes and given new values. which were then utilized to generate the susceptibility maps of rockfalls.

Weighted Overlay Method:

Multiple map layers are overlaid one another in a weighted overlay [32]. This method derives by using the relative contributions of each parameter in situation like landslides [33]. The weighted overlay approach uses several raster layers, and composites are made by giving each class a certain amount of important weight dependent[34]. As a reliable method the weighted overlay procedure was used to construct the rock fall susceptibility map, this method weights each raster layer according to its relative worth. The flowchart of methodology followed in presence study is in Figure 4.

Result

Rock Fall Inventory Map:

The first step in the research process is constructing an inventory map of rock falls of the study area. Inventory Map reveals that a landslides occur in deformed morphology assessed using contours and different topographic expressions [35].A rock fall inventory map of study area is generated by different topographic recognition keys such as crenulated contours, isolated knobs, divergent contours, parallel and converging drainage patterns, and by visualizing and analyzing them in Google Earth Pro. For this a regional topographic contour map with a 30m contour interval was generated and combined with the hill shade map of the area to make a stitched topographic map using ArcGIS 10.4. The expression of a minimum five consecutive contour intervals is required for the identification of Rock falls with more confidence [19]. However, it is very difficult to locate rock falls based on field using this technique unless we required very high resolution It’s not very easy to locate rock falls in the field using this technique as it requires vast field experience and expert knowledge. In the present study hill shade map are constructed based on 12.5m resolution and identification of rock falls were made on the bases of google Earth Pro. Various topographic expressions and a total of 200 rock falls were marked on the map.

All possible rock falls were identified and marked on hill shade map and Google Earth Pro were used to identify rock falls with more accuracy. Later on, for validity and confirmation field reconnaissance was conducted. Many areas were difficult to visit due poor road network and due to blockage of the road at many places due to landslides. The 30 percent of total marked rock falls were confirmed during the field visit along the road. Overall, rate of success of the validation of the rock fall is very good. The Rock fall inventory map is shown in Figure 5. Ground-based interferometric-radar-systems have been designed and used to monitor displacement of unstable slopes Natural hazards radar system capable of sensing and monitoring slope movement on the ground. Despite the widespread usage of radar technology over the past 50 years, it has only been the last 10 years that improved computer technology has made the low-cost processing power required for interferometric computations available. To determine overall displacement and rates of change, high-resolution digital photographs taken at regular intervals or before and after events can be sequenced and compared. The human eye is welladapted to perceive movement, making it simple to switch between images by merely flicking between them.

Figure 5: Rock fall Inventory Map of the are

Spatial Analysis:

The main influencing factors for rock falls in the study area are slope, faults(seismicity), geology and aspect. The spatial analysis of these factors are as follows

Rock Falls Vs Slope Angle:

Slope plays a significant role in triggering rock falls. Up to 50% of all rock falls along Jaglot-Skardu Road occur at slope greater than 45 degrees, 28.94 % of the rock falls occurred at slope between 35-45 degrees, 17.3 % of rock falls happen on slopes between 25-35 degrees and 3.6 %of the rock falls occurs on slope between15-25 degrees. The slope less than 15% degrees have zero rock falls due to less angle as shown in Figure 6A.

Rock Falls Vs Distance to Faults:

Since faults tend to weaken the rock by breaking it, they have a significant effect on the stability of the slope. Rock falls are thus seen to be more common close to faults and to rapidly decrease in number as distance increases[29]. The analysis of the rock falls along the jaglot sakrdu road shows that the number of rock falls near in more in the area near to the fault and decreases as me move away from the fault as shown in Figure 6B

Rock Fall Vs Geology:

Every rock reacts differently due to variances in its physical and chemical characteristics. Geology is one of the variables that is most prone to the creation and control of rock falls. The spatial analysis of rock falls and geology shows that up to 28% of rock falls along the road occurs in Mzps, 12.8 % of rock falls occurs in Tkm, 21.7 % rock falls occurs on Tkb, 34.6 % of the marked rock falls occurs on pCb and 2.7 in Q. It means the number of rock falls varies due to different geologies present along rock as shown Figure 6C.

Rock Falls Vs Aspect:

The slope's direction is known as an aspect. This angle determines how much sunlight there is and how much precipitation are there [22]. The apatial analysis of rockfall and aspect also show that the number of rockfalls are different in aspect. The Figure 6D shown in the clearly shows the percentage of the rockfalls is higher in south and southwest direction lower in the north aspect

Figure 6: (A) Rock falls Vs Slope (B) Rock falls Vs Faults (C) Rock falls Vs Geology (D) Rock falls Vs Aspect

Landslide Susceptibility Map:

ArcGIS offers a very simple and basic tool for suitability assessment known as the weighted overlay technique. This approach made use of several input map layers that might be too responsible for slope failure It is a method or technique in which we use multi influencing factors of the rock falls as such as aspect, geology, slope, elevation etc. Every map unit which is in raster format is reclassified in which a certain ranking is given to each class. After reclassification a tool name “weighted overlay” in ArcGIS is used in which influence and rate of each map unit is assigned as shown in the Table 1.

Most influencing triggering factors of the rock falls such as fault, elevation, slope steepness and hydrology were assigned more percentage of the rate. Other factors are less influencing in this type of areas. Results which are generated from weighted overlay technique is than classified four zones i.e., low susceptible zone, moderate susceptible zone, high susceptible zone and very high susceptible zone shown in Figure 7. Interpretations shows that low zone covers 10.08% of the area while 39.6% is covered by moderate hazard zone, 39.7% of the area is high zone to the rock falls and 10.5% very high hazard zone as shown in Table 2

Rock fall protection structures aim to capture a rock or to control it once it has fallen. These structures catch areas, rigid or flexible barriers, attenuator systems, drapes, rock sheds and others. Catchment areas are specially constructed ditches that are intended stop and catch falling rocks before they damage the vulnerable structure. To stop fallen boulders from bouncing, the bottom of the ditch is frequently filled with loose, non-cohesive soil. They are frequently used beside vehicle corridors and may be connected with barriers, particularly when there is little space. Structures that restrict or deflect the falling pieces are known as rigid barriers. The building is sturdy enough to withstand the force of the falling boulder. Rigid structures bend relatively little as a result of impact, allowing them to be placed close to the assets they protect. Flexible barriers are lightweight structures that aim to contain the falling rock by significantly deforming to dissipate the energy of the rock block. A fence consists of a net panel that is suspended from a series of posts and cables that are anchored into the ground. Many others geotechnical structure can be built to reduce the effect of risk.

Table 1: Showing the weighted used weighted overlay technique.

Figure 7: Hazard (susceptibility) map of the study area

Table 2: Area of four zones

Validation of the Results:

The basic purpose of generation of making rockfall inventory is to further verify susceptibility mapping results. The validation results showed a good agreement between inventory and prepared susceptibility map of the Jaglot-Skardu Road. Shapefiles of the rockfall inventory map and the susceptibility map were overlapped and compared to find out the degree of reliability of these two efforts. Approximately 60% marked rockfalls lie within high and very high hazard susceptible zones, 30% lies in moderate hazard susceptible zone, and only 10% lies in the low hazard susceptible zone. The overlapped rockfall inventory and susceptible map is shown in the Figure 8.

The ROC curve provides a visual depiction of the model's performance. The true positive rate (TPR) and false positive rate are used in the calculation (FPR). FPR counts the amount of consistently correct positive results, as opposed to TPR, which counts the number of accurate positive results that show up in all positive situations. The area under the curve is a good indicator of the study's accuracy. The model's accuracy is measured by the area under the curve. We divided the inventory's training and testing data for this research. The training data was used to assess and rank the parameters. The receiving operating curve is produced once the susceptibility map has been evaluated The Area Under the Curve (AUC) value for all landslides was 0.775 as shown in Figure 9 which shows that this map can be used for planning and development purposes.

In order to avoid any lost after Rock falls stay away from the Susceptible area. There may be danger of additional rock falls. Listen to the news for the latest emergency information regarding Landslides. If you are close to the area Check for injured and trapped persons near the area, without entering the direct Rock fall area. Check your building foundations, and surrounding land which may help you assess the safety of the area. Look for and report broken utility lines and damaged roadways and railways to appropriate authorities got timely actions. Reporting potential hazardous sites will get the roads turned off as quickly as possible, preventing further hazard and injury. Look for and report broken utility lines and damaged roadways and railways to appropriate authorities. Get a geotechnical expert for evaluating landslide hazards or designing corrective techniques risk to prevent or reduce risk, without creating further hazard.

Figure 8: Overlapped rock fall inventory and susceptible map of the Jaglot-Sakardu Road

Figure 9: Graph shows Area Under Curve for susceptibility map

Discussion

The geology along road also contains quaternary deposits. Long-term orogeny, which started during the tertiary period when the Indian and African plates split and started to migrate northward, is affecting the area's mountainous landscape. As the Indian and Eurasian plates clashed, mountain ranges such as the Himalaya, the Kohistan Island Arc, and the Karakoram formed parallel to one another. Mountain ranges and other geological features formed side by side. The area's hilly topography has grown since the Tertiary, when it experienced extended 
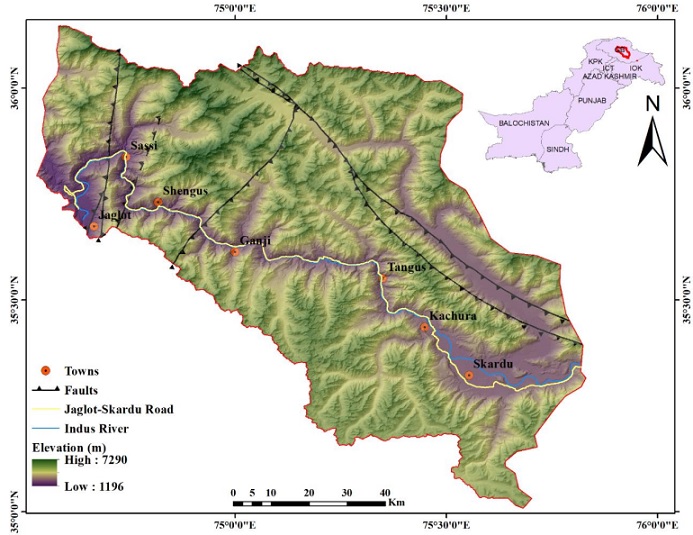
orogeny [14]. The area is tectonically active with shear zones and active fault systems which include. Main Boundary Thrust (MBT), Main Mantle Thrust (MMT), and Main Karakorum Thrust (MKT). The Main Karakorum Thrust (MKT) delineates the Karakorum Block's southern boundary. It resulted from the collision of the Eurasian plate with the Kohistan Island Arc [35]. Kohistan Island arc was developed due to subduction of Indian Plate beneath Eurasian. Main Mantle Thrust (MMT) is located in the north of the Northern Deformed Fold and Thrust Belt (NDFTB) which also passes through the Study area. The Main Boundary Thrust extends from northeast to southwest along the front of the northern fold and thrust belt in Hazara-Kashmir syntaxes, reflecting the southward movement of Himalayan deformation from the MMT in the north. Pre-collisional Paleozoic and Mesozoic sedimentary and meta-sedimentary rocks from the Northern Deformed Fold and Thrust Belt make up the MBT's hanging wall. The primary 
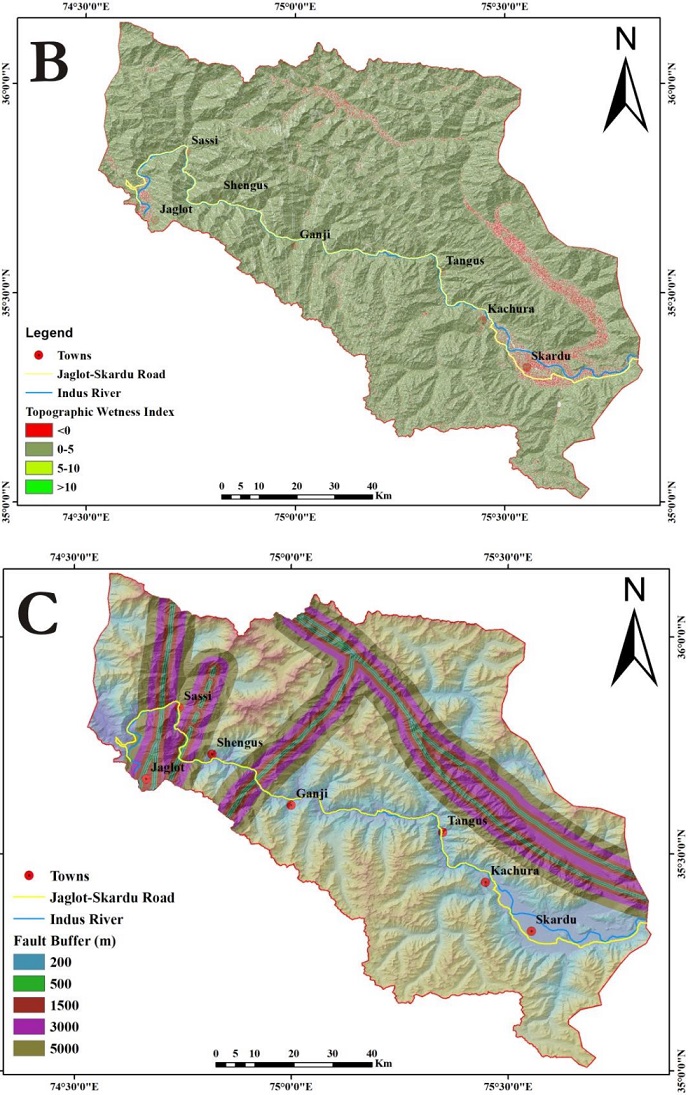
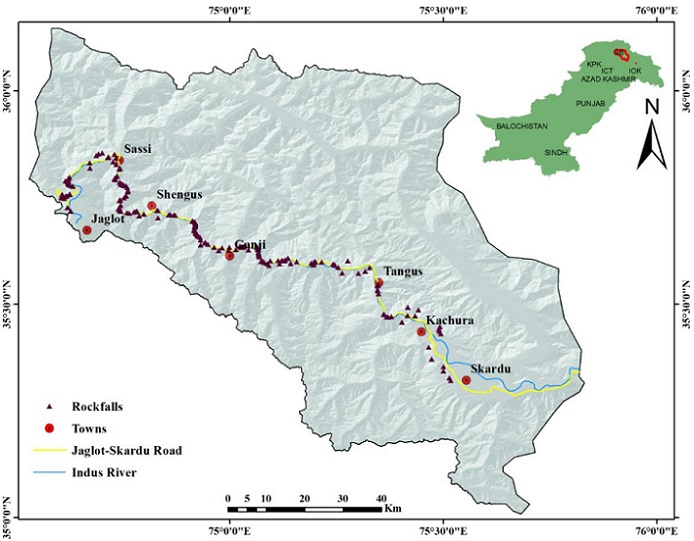
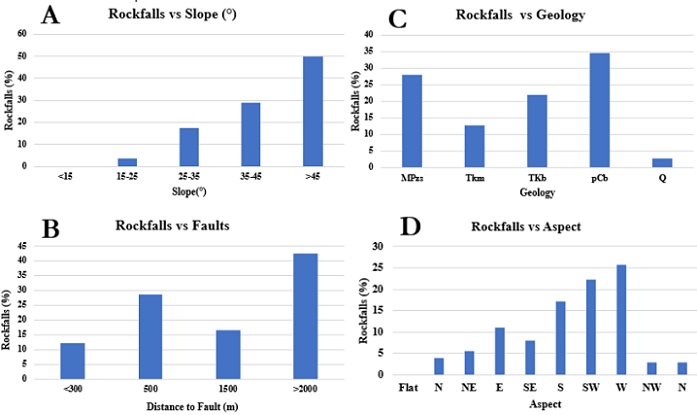
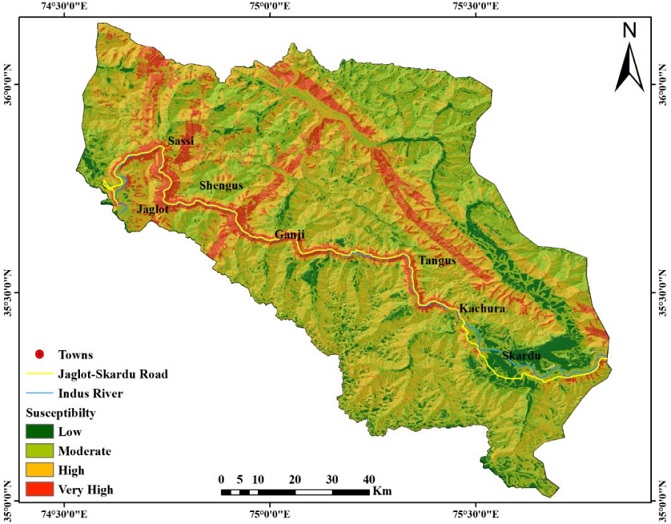
Geological factors that contribute to the rockfalls are the rock type and the fault zones in the area. In the present study the maximum number of the rockfalls are in area which consists of Diorite, granodiorite, granite, pegmatite and aplites. (Kohistan Batholith) and are near to fault 
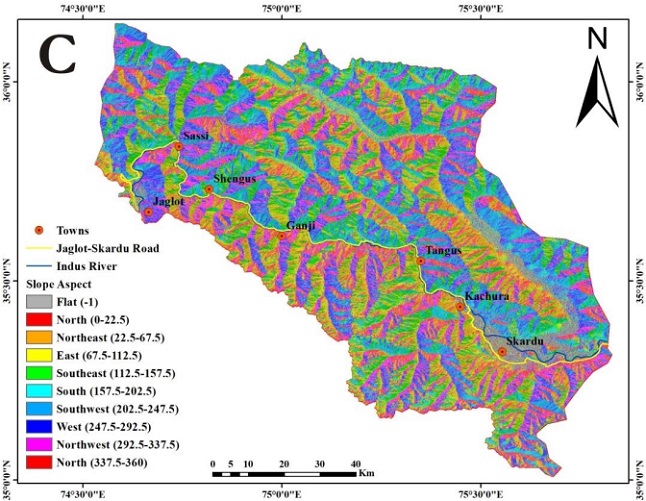
zones. Slope is also a major factor that is triggering the rockfalls in the areas which is also not neglectable.

Identifying and mapping rockfall-prone areas in mountainous terrain and landscape involves comprehensive geological study, advanced technology, and field surveys. Geological studies reveal underlying rock types, faults, and weathering patterns. High-resolution satellite imagery and Remote Sensing technology provide detailed terrain models. Aerial surveys using drones or helicopters capture essential data. Geographic Information Systems (GIS) integrate multiple data sources. On-site field surveys help identify hazards like loose rocks and unstable slopes. Monitoring equipment tracks slope movements, and climate data assesses weather influences. Machin-learning can also aid hazard prediction. Expert consultation and community input enhance accuracy. Regular updates ensure maps remain relevant and informative. Rockfall prone areas can be marked of by different topographic recognition keys such as crenulated contours, isolated knobs, divergent contours, parallel and converging drainage patterns that is obtained from contour map of the area which can be generated through Digital Elevation Models and Google Earth Pro. For this a regional topographic contour map with a 30m contour interval can be generated and combined with the hill shade map of the area to make a stitched topographic map using ArcGIS. The expression of a minimum five consecutive contour intervals is required for the identification of Rockfalls with more confidence [19]. We can also visualize the head scraps and deposits of the rockfalls easily using Google Earth Pro.

In order to improve safety in areas vulnerable to these risks, monitoring and early warning systems for rockfall occurrences use a range of techniques and technology. These include GNSS technology, wireless sensor networks, machine learning, early warning systems, communication systems, GIS platforms, and risk assessment models. They also include LiDAR technology, acoustic sensors, seismic sensors, weather and climate monitoring, visual inspection and surveys, and visual inspection and surveys. Together, these systems offer thorough coverage and prompt alarms, assisting in the protection of people and property in areas vulnerable to rockfall. The particular geological and environmental parameters of the area being monitored determine the technology to be used.

Climate change and weather patterns have varying effects on rockfall hazards across different regions. The risk of rockfalls can increase as soil and rocks get saturated due to increased precipitation, a result of climate change. Warmer winters can alter freeze-thaw cycles, which can affect rock fracture and stability. Rockfall risk is increased in mountainous areas when glacial retreat exposes unstable slopes. On the other hand, in some places, increased vegetation growth can help to stabilize slopes and reduce risks. Landslides and rockfalls are caused by extreme weather events that are exacerbated by climate change, especially in geologically sensitive areas. Rockfall is more likely as a result of slopes becoming unstable due to permafrost thawing. Changes in weather patterns, such as high winds, can dislodge rocks, and sea level rise can erode coastal cliffs, increasing the risk of rockfall.

Rockfall protection structures aim to capture a rock or to control it once it has fallen. These structures catch areas, rigid or flexible barriers, attenuator systems, drapes, rock sheds and others. Catchment areas are specially constructed ditches that are intended stop and catch falling rocks before they damage the vulnerable structure. To stop fallen boulders from bouncing, the bottom of the ditch is frequently filled with loose, non-cohesive soil. They are frequently used beside vehicle corridors and may be connected with barriers, particularly when there is little space. Structures that restrict or deflect the falling pieces are known as rigid barriers. The building is sturdy enough to withstand the force of the falling boulder. Rigid structures bend relatively little as a result of impact, allowing them to be placed close to the assets they protect. Flexible barriers are lightweight structures that aim to contain the falling rock by significantly deforming to dissipate the energy of the rock block. A fence consists of a net panel that is suspended from a series of posts and cables that are anchored into the ground. Many others geotechnical structure can be built to reduce the effect of risk.

Data collection, stakeholder engagement, land use and transportation planning, structural mitigation, early warning systems, emergency response planning, education, regulatory frameworks, and collaboration are all necessary to ensure comprehensive risk reduction when integrating risk assessments into urban and regional planning to lessen the impact of rockfall events on communities and transportation networks. A typical regulatory framework and set of guidelines for land use planning and construction in rockfall-prone areas includes zoning regulations that designate hazardous zones, building codes that specify construction standards, geological and engineering assessments, setback requirements, recommendations for protective measures like rockfall barriers, vegetation management, land acquisition in high-risk zones, environmental impact assessments, monitoring and maintenance requirements, and PUDs. These extensive efforts seek to balance responsible development with reducing the effects of rockfall dangers on infrastructure and communities. Local and national authorities are normally in charge of oversight and enforcement, ensuring that safety procedures are followed in susceptible locations.

Conclusions and Recommendations

This research study was done to generate a comprehensive rock fall hazard map for the Jaglot-Skardu Road, Gilgit-Baltistan, Pakistan. For this purpose, remote sensing and Geographic Information System data was utilized for creation of rock fall inventory and susceptibility maps of the Area. Firstly, Rock fall inventory map was prepared using the topographic expressions related to Rock fall activities on the hill shade map. The inventory map of the rock falls shows 200 Rock falls that were identified in Google Earth Pro along Jaglot-Skardu Road. From this 30 % of marked rock falls were validated along the Road, out of which only 5 % were not confirmed due to local issues. Overall, success rate was found very efficient for the rock fall inventory map. Spatial analysis showed that more than 100 mapped rock falls along the Jaglot-Skardu Road occurred at the slope greater than 45 and the rate of rock fall activity is higher near to the faults. More than 70 rock falls occurred in Hazara-kashmir basement complex rocks. This shows the role of tectonics, geology of the area and slope of the area had great impact on triggering rock falls.

Secondly, the susceptibility map was generated using weighted overlay technique in GIS environment. This shows the likelihood of the rock falls in the study area. The area is divided in to four zones i.e., low, moderate, high and very high susceptible zone. The areas which are present low and moderate susceptible zone are somehow safe and suitable for future planning and development and for high to very high susceptible zones large scale geotechnical investigations are required before any development and construction. The AUC curves indicate that our results of the study area fall in good category and these maps can be used to protect life, structure and property loss

Conflict of Interest: The authors declare no conflict of interest in publishing this manuscript in IJIST.

Reference

[1] D. J. Varnes, “Slope movement types and processes,” Spec. Rep., vol. 176, pp. 11–33, 1978.

[2] C. Chalkias, M. Ferentinou, and C. Polykretis, “GIS-Based Landslide Susceptibility Mapping on the Peloponnese Peninsula, Greece,” Geosci. 2014, Vol. 4, Pages 176-190, vol. 4, no. 3, pp. 176–190, Aug. 2014, doi: 10.3390/GEOSCIENCES4030176.

[3] P. Budetta, “Assessment of rockfall risk along roads,” Nat. Hazards Earth Syst. Sci., vol. 4, no. 1, pp. 71–81, Mar. 2004, doi: 10.5194/NHESS-4-71-2004.

[4] F. Nadim, O. Kjekstad, P. Peduzzi, C. Herold, and C. Jaedicke, “Global landslide and avalanche hotspots,” Landslides, vol. 3, no. 2, pp. 159–173, May 2006, doi: 10.1007/S10346-006-0036-1/METRICS.

[5] W. Ho, “Integrated analytic hierarchy process and its applications–A literature review,” Eur. J. Oper. Res., vol. 186, no. 1, pp. 211–228, 2008.

[6] U. Kamp, B. J. Growley, G. A. Khattak, and L. A. Owen, “GIS-based landslide susceptibility mapping for the 2005 Kashmir earthquake region,” Geomorphology, vol. 101, no. 4, pp. 631–642, Nov. 2008, doi: 10.1016/J.GEOMORPH.2008.03.003.

[7] M. Calvello, M. N. Papa, J. Pratschke, and M. Nacchia Crescenzo, “Landslide risk perception: a case study in Southern Italy,” Landslides, vol. 13, no. 2, pp. 349–360, Apr. 2016, doi: 10.1007/S10346-015-0572-7/METRICS.

[8] N. Matsuoka and H. Sakai, “Rockfall activity from an alpine cliff during thawing periods,” Geomorphology, vol. 28, no. 3–4, pp. 309–328, Jul. 1999, doi: 10.1016/S0169- 555X(98)00116-0.

[9] S. Ahmed, S. H. Solangi, M. Saeed Khan Jadoon, and A. Nazeer, “Tectonic evolution of structures in Southern Sindh Monocline, Indus Basin, Pakistan formed in multiextensional tectonic episodes of Indian Plate,” Geod. Geodyn., vol. 9, no. 5, pp. 358– 366, Sep. 2018, doi: 10.1016/J.GEOG.2018.03.004.

[10] S. Ali, R. Haider, W. Abbas, M. Basharat, and K. Reicherter, “Empirical assessment of rockfall and debris flow risk along the Karakoram Highway, Pakistan,” Nat. Hazards, vol. 106, no. 3, pp. 2437–2460, Apr. 2021, doi: 10.1007/S11069-021-04549- 4/TABLES/4.

[11] S. Ali, P. Biermanns, R. Haider, and K. Reicherter, “LANDSLIDE SUSCEPTIBILITY MAPPING BY USING GIS ALONG THE CHINA PAKISTAN ECONOMIC CORRIDOR (KARAKORAM HIGHWAY), PAKISTAN”, doi: 10.5194/nhess-2018- 39.

[12] M. Basharat, H. R. Shah, and N. Hameed, “Landslide susceptibility mapping using GIS and weighted overlay method: a case study from NW Himalayas, Pakistan,” Arab. J. Geosci., vol. 9, no. 4, pp. 1–19, Apr. 2016, doi: 10.1007/S12517-016-2308- Y/METRICS.

[13] S. Javed, “Landslide hazard mapping of Bagh district in Azad Kashmir,” Int. J. Econ. Environ. Geol., pp. 47–50, 2019.

[14] A. S. Bacha, M. Shafique, and H. van der Werff, “Landslide inventory and susceptibility modelling using geospatial tools, in Hunza-Nagar valley, northern Pakistan,” J. Mt. Sci., vol. 15, no. 6, pp. 1354–1370, 2018, doi: 10.1007/s11629-017-4697-0.

[15] J. F. Dewey and S. H. Lamb, “Active tectonics of the Andes,” Tectonophysics, vol. 205, no. 1–3, pp. 79–95, Apr. 1992, doi: 10.1016/0040-1951(92)90419-7.

[16] M. F. Ahmed, J. D. Rogers, and E. H. Ismail, “Historic Landslide Dams along the Upper Indus River, Northern Pakistan,” Nat. Hazards Rev., vol. 16, no. 3, p. 04014029, Nov. 2014, doi: 10.1061/(ASCE)NH.1527-6996.0000165.

[17] H. T. Rib, T. Liang, R. L. Schuster, and R. J. Krizek, “Landslides: Analysis and control,” Recognit. Identif., pp. 34–80, 1978.

[18] H. Fujisada, M. Urai, and A. Iwasaki, “Technical methodology for ASTER global DEM,” IEEE Trans. Geosci. Remote Sens., vol. 50, no. 10, pp. 3725–3736, 2012.

[19] C. Chalkias, M. Ferentinou, and C. Polykretis, “GIS supported landslide susceptibility modeling at regional scale: An expert-based fuzzy weighting method,” ISPRS Int. J. Geo-Information, vol. 3, no. 2, pp. 523–539, 2014.

[20] M. F. Ahmed, J. D. Rogers, and E. H. Ismail, “A regional level preliminary landslide susceptibility study of the upper Indus river basin,” Eur. J. Remote Sens., vol. 47, no. 1, pp. 343–373, 2014.

[21] L. Ayalew, H. Yamagishi, H. Marui, and T. Kanno, “Landslides in Sado Island of Japan: Part II. GIS-based susceptibility mapping with comparisons of results from two methods and verifications,” Eng. Geol., vol. 81, no. 4, pp. 432–445, Nov. 2005, doi: 10.1016/J.ENGGEO.2005.08.004.

[22] P. Tarolli, M. Borga, K.-T. Chang, and S.-H. Chiang, “Modeling shallow landsliding susceptibility by incorporating heavy rainfall statistical properties,” Geomorphology, vol. 133, no. 3–4, pp. 199–211, 2011.

[23] A. Rashid, Aspect-oriented database systems. Springer Science & Business Media, 2004.

[24] A. Yalcin, “GIS-based landslide susceptibility mapping using analytical hierarchy process and bivariate statistics in Ardesen (Turkey): Comparisons of results and confirmations,” CATENA, vol. 72, no. 1, pp. 1–12, Jan. 2008, doi: 10.1016/J.CATENA.2007.01.003.

[25] “Comparison the AHP and FUZZY-AHP Decision Making Methods in Underground DAM Site Selection in Taleghan Basin.” https://www.researchgate.net/publication/275637280_Comparison_the_AHP_and_F UZZYAHP_Decision_Making_Methods_in_Underground_DAM_Site_Selection_in_Talegha n_Basin (accessed Sep. 19, 2023).

[26] S. Peruccacci, M. T. Brunetti, S. Luciani, C. Vennari, and F. Guzzetti, “Lithological and seasonal control on rainfall thresholds for the possible initiation of landslides in central Italy,” Geomorphology, vol. 139–140, pp. 79–90, Feb. 2012, doi: 10.1016/J.GEOMORPH.2011.10.005.

[27] K. J. Beven and M. J. Kirkby, “A physically based, variable contributing area model of basin hydrology/Un modèle à base physique de zone d’appel variable de l’hydrologie du bassin versant,” Hydrol. Sci. J., vol. 24, no. 1, pp. 43–69, 1979.

[28] H. Hong et al., “Landslide susceptibility assessment in the Anfu County, China: comparing different statistical and probabilistic models considering the new topohydrological factor (HAND),” Earth Sci. Informatics, vol. 11, no. 4, pp. 605–622, Dec. 2018, doi: 10.1007/S12145-018-0352-8/METRICS.

[29] C. Xu, X. Xu, F. Dai, J. Xiao, X. Tan, and R. Yuan, “Landslide hazard mapping using GIS and weight of evidence model in Qingshui River watershed of 2008 Wenchuan earthquake struck region,” J. Earth Sci., vol. 23, no. 1, pp. 97–120, Feb. 2012, doi: 10.1007/S12583-012-0236-7/METRICS.

[30] A. M. Youssef, M. Al-Kathery, and B. Pradhan, “Landslide susceptibility mapping at AlHasher area, Jizan (Saudi Arabia) using GIS-based frequency ratio and index of entropy models,” Geosci. J., vol. 19, no. 1, pp. 113–134, Mar. 2015, doi: 10.1007/S12303-014- 0032-8/METRICS.

[31] B. Pradhan, “A comparative study on the predictive ability of the decision tree, support vector machine and neuro-fuzzy models in landslide susceptibility mapping using GIS,” Comput. Geosci., vol. 51, pp. 350–365, Feb. 2013, doi: 10.1016/J.CAGEO.2012.08.023.

[32] “(PDF) Landslide hazard assessment using analytic hierarchy processing (AHP) and geographic information system in Kaligesing mountain area of Central Java Province Indonesia.” https://www.researchgate.net/publication/303582492_Landslide_hazard_assessment_ using_analytic_hierarchy_processing_AHP_and_geographic_information_system_in_ Kaligesing_mountain_area_of_Central_Java_Province_Indonesia (accessed Sep. 19, 2023).

[33] M. Cardinali et al., “A geomorphological approach to the estimation of landslide hazards and risks in Umbria, Central Italy,” Nat. Hazards Earth Syst. Sci., vol. 2, no. 1/2, pp. 57–72, Jun. 2002, doi: 10.5194/NHESS-2-57-2002.

[34] T. L. Saaty, “How to make a decision: The analytic hierarchy process,” Eur. J. Oper. Res., vol. 48, no. 1, pp. 9–26, Sep. 1990, doi: 10.1016/0377-2217(90)90057-I.

[35] J. D. Rogers, “Report accompanying map of landslides and other surficial deposits of the City of Orinda,” CA Rogers/Pacific, Inc. City Orinda Public Work. Dep, 1994.