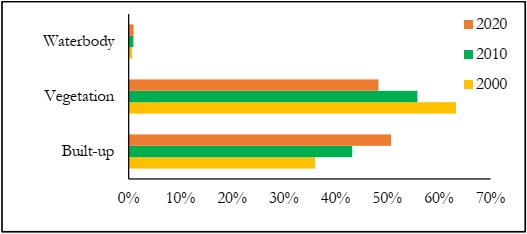
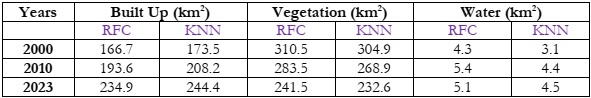
The LULC classification executed through KNN indicates that in 2000, approximately
36.04% (173.5 km2) of the area was built up, while 63.31% (304.9 km2) was categorized as green
spaces, and 0.65% (3.1 km2) consisted of water bodies. RFC based ML technique was used to
classify the satellite image of 2010, the built-up area had increased to about 43.24% (208.2 km2),
while green spaces decreased to 55.84% (268.9 km2), and water bodies made up 0.92% (4.4 km2)
of the land cover. This data reveals a 7.2% (34.6 km2) increase in built-up areas, a -7.47% (35.9
km2) decrease in green spaces, and a 0.27% (1.3 km2) increase in water bodies during this period.
In 2023, the built-up area further expanded to approximately 50.76% (244.4 km2), while
green spaces decreased to 48.30% (232.6 km2), and water bodies slightly increased to 0.94% (4.5
km2). This indicates a 7.52% (36.2 km2) growth in built-up areas, a -7.54% (36.304 km2) decrease
in green spaces, and a minimal change of 0.02% (0.041 km2) in water bodies.
Figure 2 and Table 2 clearly illustrates these significant changes observed in LUCL
patterns over the years 2000, 2010, and 2023.
The comparison map of LULC shows that the built-up area increases with a high ratio,
the green spaces decrease, and water bodies have an insignificant change, as shown in Figure 3.
The extent of sprawl was estimated and it was appraised that RFC based ML technique provided
promising results that were near to statistics by various administrative authorities.
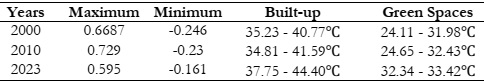
The comparative analysis of NDVI, as depicted in the comparison map, clearly indicates
a reduction in both the maximum and minimum values, as illustrated in Figure 4.
The transformation of natural vegetation, such as forests and green spaces, into built-up
surfaces composed of concrete, stone, metal, and asphalt can result in elevated surface radiant
temperatures. However, despite the significant increase in built-up areas, the surface
temperatures remain relatively lower. This could be attributed to the substantial presence of
green spaces in the study area. Table 3 underscores that the maximum LST value has experienced
an increase from 2000 to 2023, indicating a rise in temperature over this period. The comparison
map of Land Surface Temperature unmistakably reveals an increase in both the maximum and
minimum values, as evidenced in Figure 5.
The results of this study demonstrate that both the ML techniques are remarkably
effective in proactively predicting probable long-term effects of Urbanization on environmental
consequences. Consequently, this has led to detrimental consequences on natural systems. The
expansion of urban development would persist in the direction of the region where existing or
planned industrial ventures contravene local environmental standards, which are designed to
safeguard urban communities against environmental contamination.
ML offers a valuable contribution to the field of land use planning by providing an
effective means of validating and supporting decision-making processes, particularly in the
context of long-term land use planning. This stands in contrast to traditional and contemporary
techniques for LULC optimization and simulation. However, it is important to acknowledge the
merits of these advantages, even though their outcomes are frequently linked to a certain degree
of ambiguity. Nevertheless, the majority of these criteria are subject to dynamic spatial elements
that undergo temporal fluctuations as a result of the influence of urban development. The
omission of this change in land use optimization methodologies results in a gradual weakening
of choices made based on multicriteria.
While KNN has provided recognition from numerous scholars as the most efficient
technology however in case of urban area mapping RFC is proved efficient, the integration of
this approach with land use optimization methods to arrive at a sustainable decision for
identifying a suitable site for diverse activities is a complicated task. The selection of an
appropriate site for a certain activity necessitates the execution of many activities in a sequential
manner. Although key industrial projects, like oil refineries, power plants, and wastewater
treatment plants, are often built to operate for several decades, existing prediction
methodologies have limitations in accurately forecasting beyond a three-decade timeframe. To
address these disparities, a novel methodology was devised, utilizing ML and GIS. The findings
of this study confirm that the utilization of this innovative methodology can effectively mitigate
the likelihood of erroneous judgments that incur substantial expenses when their repercussions
necessitate rectification.
The methodology has capability to identify planning issues encountered in previously
completed projects, as well as forecast prospective environmental challenges in ongoing
construction projects and even planned planning project sites. Hence, the utilization of Decision Support Tools (DSTs) holds significant potential in the context of land use optimization,
particularly in the identification of suitable locations for projects that may contribute to
pollution. This technique is deemed essential for scholars and urban planners with an interest in
the pursuit of Sustainable Development Goals (SDGs).
The findings substantiate that random forest classifications approach is viable that
should be incorporated into Multi-Criteria decision-making processes to facilitate informed
decision-making and validate prior decisions. The process of urbanization often leads to an
increase in temperatures within cities due to factors such as reduced natural surroundings, higher
heat emissions, greater impermeable surfaces, and increased surface roughness. This
phenomenon is commonly represented as the Urban Heat Island (UHI) effect. The
consequences of UHI extend beyond altering the urban thermal environment; they encompass
a heightened risk of dangerous heat events, elevated air pollution levels, increased energy
utilization, and threats to human health.
The utilization of remote sensing and geospatial technology has played a pivotal role in
classifying satellite data through RFC based on ML classification. This approach has enabled the
tracking of changes over time, particularly the expansion of built-up areas and the decline of
vegetation. The analysis of land use change types has underscored the significant impact of
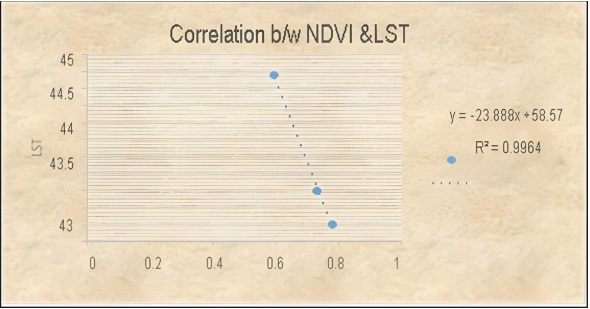
different land cover types on both NDVI and LST. It has been observed that built-up areas
consistently exhibit higher LST compared to areas with vegetation and water bodies. Moreover,
a robust negative correlation has been identified between NDVI and LST, indicating that an
increase in vegetation leads to a decrease in surface temperature. This highlights the crucial role
of vegetation in mitigating the UHI effect.
[1] T. Susca, S. R. Gaffin, and G. R. Dell’Osso, “Positive effects of vegetation: Urban heat
island and green roofs,” Environ. Pollut., vol. 159, no. 8–9, pp. 2119–2126, Aug. 2011,
doi: 10.1016/J.ENVPOL.2011.03.007.
[2] T. H. Son, Z. Weedon, T. Yigitcanlar, T. Sanchez, J. M. Corchado, and R. Mehmood,
“Algorithmic urban planning for smart and sustainable development: Systematic review
of the literature,” Sustain. Cities Soc., vol. 94, Jul. 2023, doi: 10.1016/J.SCS.2023.104562.
[3] T. Yigitcanlar, D. Agdas, and K. Degirmenci, “Artificial intelligence in local governments:
perceptions of city managers on prospects, constraints and choices,” AI Soc., vol. 38, no.
3, pp. 1135–1150, Jun. 2023, doi: 10.1007/S00146-022-01450-X.
[4] K. C. Seto, M. Fragkias, B. Güneralp, and M. K. Reilly, “A meta-analysis of global urban
land expansion,” PLoS One, vol. 6, no. 8, 2011, doi:
10.1371/JOURNAL.PONE.0023777.
[5] Z. Ren et al., “Estimation of the Relationship between Urban Park Characteristics and
Park Cool Island Intensity by Remote Sensing Data and Field Measurement,” For. 2013,
Vol. 4, Pages 868-886, vol. 4, no. 4, pp. 868–886, Oct. 2013, doi: 10.3390/F4040868.
[6] A. Aflaki et al., “Urban heat island mitigation strategies: A state-of-the-art review on
Kuala Lumpur, Singapore, and Hong Kong,” Cities, vol. 62, pp. 131–145, Feb. 2017, doi:10.1016/J.CITIES.2016.09.003.
[7] D. Triantakonstantis, G. Mountrakis, D. Triantakonstantis, and G. Mountrakis, “Urban
Growth Prediction: A Review of Computational Models and Human Perceptions,” J.
Geogr. Inf. Syst., vol. 4, no. 6, pp. 555–587, Dec. 2012, doi: 10.4236/JGIS.2012.46060.
[8] D. Gupta, D. Sethi, and R. Bathija, “A Review on Land-use and Land-change with
Machine Learning Algorithm,” IOP Conf. Ser. Mater. Sci. Eng., vol. 1119, no. 1, p.
012006, Mar. 2021, doi: 10.1088/1757-899X/1119/1/012006.
[9] E. J. Gago, J. Roldan, R. Pacheco-Torres, and J. Ordóñez, “The city and urban heat
islands: A review of strategies to mitigate adverse effects,” Renew. Sustain. Energy Rev.,
vol. 25, pp. 749–758, Sep. 2013, doi: 10.1016/J.RSER.2013.05.057.
[10] V. Chettry, “Geospatial measurement of urban sprawl using multi-temporal datasets from
1991 to 2021: case studies of four Indian medium-sized cities,” Environ. Monit. Assess.,
vol. 194, no. 12, Dec. 2022, doi: 10.1007/S10661-022-10542-6.
[11] D. E. Bowler, L. Buyung-Ali, T. M. Knight, and A. S. Pullin, “Urban greening to cool
towns and cities: A systematic review of the empirical evidence,” Landsc. Urban Plan.,
vol. 97, no. 3, pp. 147–155, Sep. 2010, doi: 10.1016/J.LANDURBPLAN.2010.05.006.
[12] S. Oliveira, H. Andrade, and T. Vaz, “The cooling effect of green spaces as a contribution
to the mitigation of urban heat: A case study in Lisbon,” Build. Environ., vol. 46, no. 11,
pp. 2186–2194, Nov. 2011, doi: 10.1016/J.BUILDENV.2011.04.034.
[13] A. G. Fontana, V. F. Nascimento, J. P. Ometto, and F. H. F. do Amaral, “Analysis of
past and future urban growth on a regional scale using remote sensing and machine
learning,” Front. Remote Sens., vol. 4, no. September, p. 1123254, Sep. 2023, doi:
10.3389/FRSEN.2023.1123254.
[14] C. W. Mackey, X. Lee, and R. B. Smith, “Remotely sensing the cooling effects of city
scale efforts to reduce urban heat island,” Build. Environ., vol. 49, no. 1, pp. 348–358,
Mar. 2012, doi: 10.1016/J.BUILDENV.2011.08.004.
[15] J. M. Kim, J. S. Park, C. Y. Lee, and S. G. Lee, “PREDICTING OF URBAN
EXPANSION USING CONVOLUTIONAL LSTM NETWORK MODEL: THE
CASE OF SEOUL METROPOLITAN AREA, KOREA”, doi: 10.5194/isprs-annalsX-4-W3-2022-113-2022.
[16] A. Rienow and A. Rienow, “The Future of Central European Cities – Optimization of a
Cellular Automaton for the Spatially Explicit Prediction of Urban Sprawl,” Optim.
Algorithms - Methods Appl., Sep. 2016, doi: 10.5772/62424.
[17] M. Jabbar, M. M. Yusoff, and A. Shafie, “Assessing the role of urban green spaces for
human well-being: a systematic review,” GeoJournal, vol. 87, no. 5, pp. 4405–4423, Oct.
2022, doi: 10.1007/S10708-021-10474-7/FIGURES/2.
[18] S. D. Nagappan and S. M. Daud, “Machine Learning Predictors for Sustainable Urban
Planning,” IJACSA) Int. J. Adv. Comput. Sci. Appl., vol. 12, no. 7, p. 2021, Accessed:
Sep. 27, 2023. [Online]. Available: www.ijacsa.thesai.org
[19] K. Kulkarni and P. A. Vijaya, “Measuring urban sprawl using machine learning,” Fundam.
Methods Mach. Deep Learn. Algorithms, Tools, Appl., pp. 327–340, Jan. 2022, doi:
10.1002/9781119821908.ch14.
[20] Jabbar and M. M. Yusoff, “Assessing The Spatiotemporal Urban Green Cover Changes
and Their Impact on Land Surface Temperature and Urban Heat Island in Lahore
(Pakistan),” Geogr. Environ. Sustain., vol. 15, no. 1, pp. 130–140, Mar. 2022, doi:
10.24057/2071-9388-2021-005.
[21] P. Ponukumati, M. Azharuddin, S. K. Regonda, P. Ponukumati, M. Azharuddin, and S.
K. Regonda, “Estimation of Urban Sprawl Using Machine Learning Methods for the city
Hyderabad, India,” AGUFM, vol. 2020, pp. H094-05, 2020, Accessed: Sep. 27, 2023. [Online]. Available:
https://ui.adsabs.harvard.edu/abs/2020AGUFMH094...05P/abstract
[22] S. C. Koumetio Tekouabou, E. B. Diop, R. Azmi, R. Jaligot, and J. Chenal, “Reviewing
the application of machine learning methods to model urban form indicators in planning
decision support systems: Potential, issues and challenges,” J. King Saud Univ. - Comput.
Inf. Sci., vol. 34, no. 8, pp. 5943–5967, Sep. 2022, doi: 10.1016/J.JKSUCI.2021.08.007.
[23] A. Khan and M. Sudheer, “Machine learning-based monitoring and modeling for spatiotemporal urban growth of Islamabad,” Egypt. J. Remote Sens. Sp. Sci., vol. 25, no. 2, pp.
541–550, Aug. 2022, doi: 10.1016/J.EJRS.2022.03.012.
[24] M. A. Siddique et al., “Assessment and simulation of land use and land cover change
impacts on the land surface temperature of Chaoyang District in Beijing, China,” PeerJ,
vol. 2020, no. 3, p. e9115, May 2020, doi: 10.7717/PEERJ.9115/SUPP-3.
[25] B. Stone et al., “Avoided Heat-Related Mortality through Climate Adaptation Strategies
in Three US Cities,” PLoS One, vol. 9, no. 6, p. e100852, Jun. 2014, doi:
10.1371/JOURNAL.PONE.0100852.
[26] K. R. Gunawardena, M. J. Wells, and T. Kershaw, “Utilising green and blue space to
mitigate urban heat island intensity,” Sci. Total Environ., vol. 584–585, pp. 1040–1055,
Apr. 2017, doi: 10.1016/J.SCITOTENV.2017.01.158.