This section provides an overview of the findings and analyses related to features
including stream order, stream length, mean stream length, stream length ratio, bifurcation ratio,
length of overland flow, basin length, and perimeter, constitutes the morphometric examination
of a basin.
The comprehension of stream order and stream numbers is of great significance within
the discipline of fluvial geomorphology. The drainage network is of paramount importance in
facilitating the conveyance of water and sediments from a specific basin via a solitary outlet. The
greatest rank of the basin is attributed to this distinctive outlet, therefore signifying its
classification as the basin's order. The dimensions of rivers and basins exhibit significant variety
by the hierarchical structure of the basin. The first step in basin analysis involves the arrangement
and structure of stream networks. To conduct a thorough examination of basin characteristics,
it is essential to undertake a rigorous investigation of the many aspects associated with stream
networks [18]. This study has conducted a stream rating assessment using the suggested
methodologies. The assessment of stream order was carried out in a comprehensive set of 21
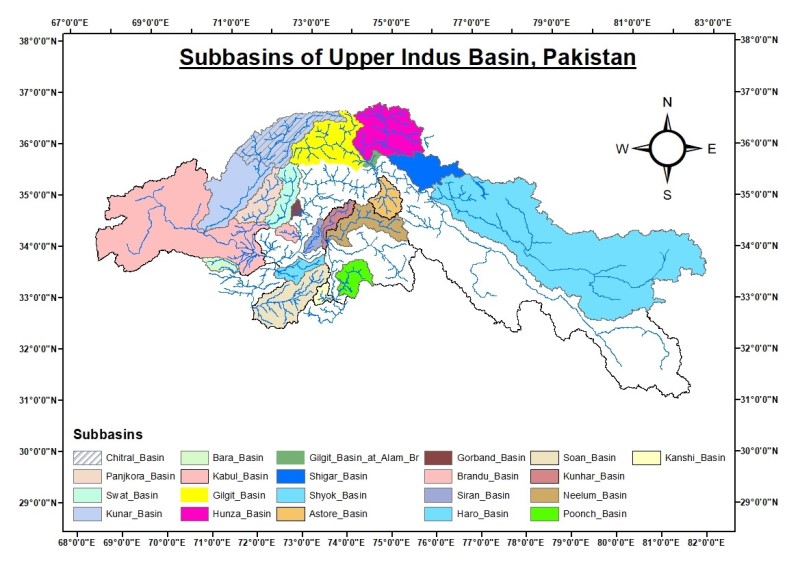
subbasins, wherein the observed stream orders exhibited a range spanning from 3 to 7. The
subbasins where the highest stream order, specifically defined as 7, is seen encompass the Shyok
River and the Gilgit River basin. This phenomenon occurs near the confluence where the Indus
River crosses with the Alam Bridge. In contrast, the Gorband basin exhibits the minimum
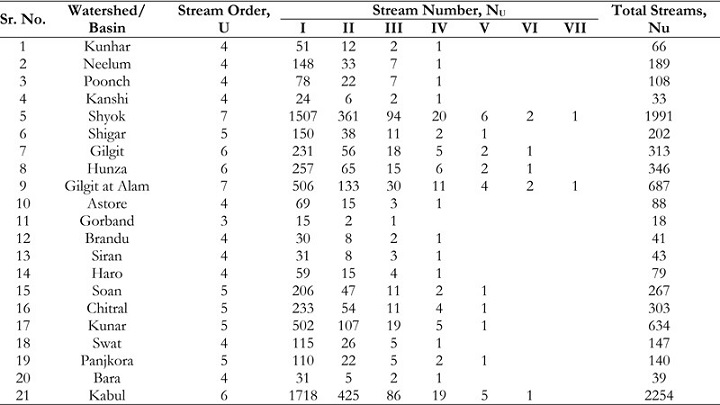
stream order, which is designated as 3. Table 2 presents the quantitative data about the streams
linked to each stream order within the 21 subbasins of the Indus basin. Although most basins
have a drainage pattern of the fourth order, the five studied basins had streams of the fifth order.
The streams located in the Hunza, Gilgit, and Kabul basins demonstrated a classification of the
6th order. The prevailing drainage patterns observed in all basins of the stream network are
commonly described as sub-dendritic to dendritic. The observation noted above suggests that
there is a uniform texture and a lack of structural influence, as depicted in Figure 2. The
prevalence of first-order streams is observed to be the highest among all stream orders.
Furthermore, Figure 3 (See at the end of Paper) illustrates a decrease in the overall number of
stream segments as the stream order increases. The discovery cited above suggests that the entire
region has a consistent lithological composition. Furthermore, from a geological perspective,
there are no observable signs of uplift occurring inside the basin. The Kabul basin exhibits the
highest number of streams, totaling 2,254.
The measurement of stream Length has been carried out utilizing the methodologies
proposed by Horton, which is a significant hydrological metric in a basin since it offers useful
insights on the characteristics of surface runoff. Watersheds characterized by effective drainage
often demonstrate the presence of permeable bedrock and formations, as seen by a scarcity of
elongated streams. Conversely, watersheds characterized by bedrock and formations with limited permeability display a higher prevalence of shorter streams. This claim is substantiated by prior scholarly investigations. Typically, stream segments demonstrate a higher overall length
in streams of first order, followed by a drop in length as stream order increases. The research
entailed the quantification of stream networks of varying orders within a certain watershed,
together with the computation of their respective lengths from the discharge point to the point
of drainage split. The accomplishment was achieved by the application of GIS software. Table
3 presents the findings about the lengths of streams in each of the 21 subbasins, arranged
sequentially. The data depicted in Figure 2 provides compelling and incontrovertible evidence
of a positive association between stream order and cumulative stream length. A positive link has
been observed between stream order and the characteristics displayed by first-order streams. As
the order of a stream increases, there is a tendency for these values to gradually decrease [19].
The Shyok basin displayed a notable discrepancy in the lengths of its streams of different orders,
specifically between the first-order and seventh-order streams. The former had a remarkable
span of 8400 km, and the latter possessed a relatively shorter extent of 320 km. The Kabul basin
demonstrated the highest aggregate stream length, reaching a total of 17,528 km.
Table 2: Stream order and stream number of mountainous watersheds of UIB, Pakistan.
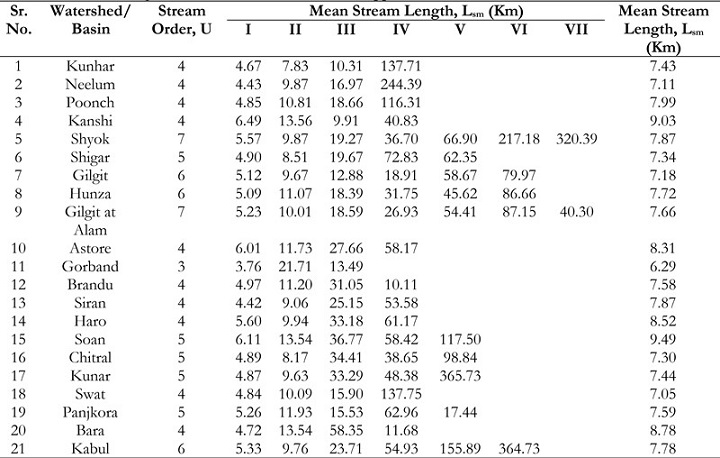
The Mean Stream Length (SLm) is an essential attribute that is linked to the drainage
network and the landforms it contains (15). The SLm values for all 21 subbasins demonstrate a
range of 3.76 to 365.73 km, with variances seen within various stream orders. The Soan basin
exhibits the most elevated SLm, at 9.49 km. Table 4 presents a comprehensive comparative
analysis of the Land Surface Models (LSMs) about each subbasin. A positive association has
been shown between stream order and the average length of streams, suggesting that a rise in
stream order is associated with a corresponding increase in the average length of streams.
Previous studies have noted that the SLm value of a stream order consistently displays a greater
magnitude in comparison to that of a lower order. Conversely, the SLm value of a lower order
consistently exhibits a smaller magnitude when compared to that of a higher order. The variety
observed in the SLm values across various subbasins can be attributed to their close correlation
with the size and terrain of these subbasins [20].
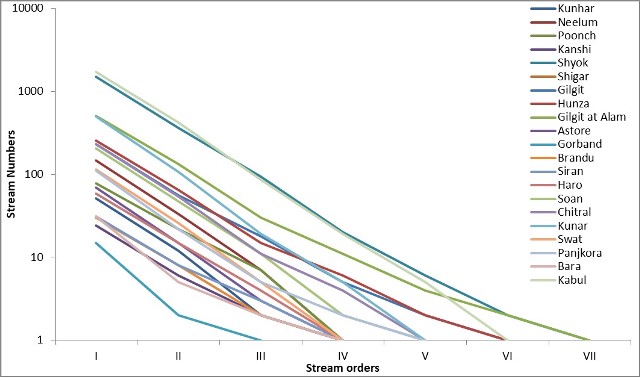
Figure 2:
Relationship between stream order and number of streams for 21 sub-watersheds.
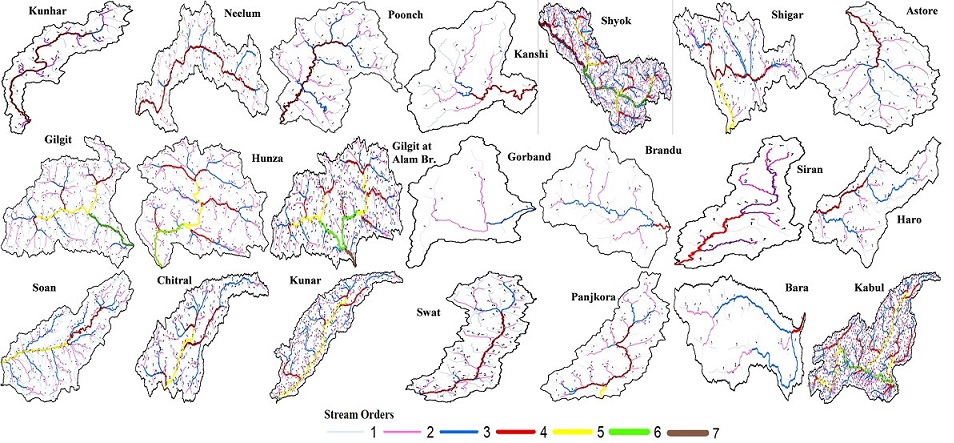
Figure 3: Stream order of sub-watersheds of UIB, Pakistan.
Table 3: Stream lengths of mountainous watersheds of UIB, Pakistan.
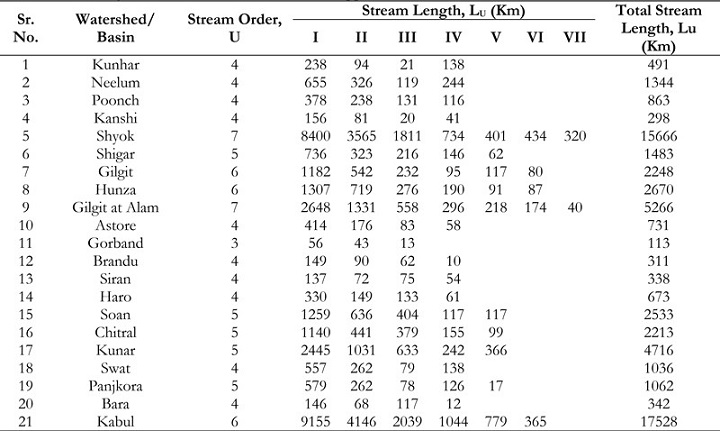
Table 4: SLm of mountainous watersheds of UIB, Pakistan.
The Stream Length Ratio (SLR) is a statistical measure used to objectively evaluate the
relationship between the lengths of different streams. The SLR values are displayed in Table 5.
The variability in stream lengths across streams of varying orders within each subbasin is
observed within each specific subwatershed. The observed alteration can be ascribed to
fluctuations in the incline and topography, suggesting that the streams are presently in a phase
of advanced youth with regards to geomorphic evolution [21].
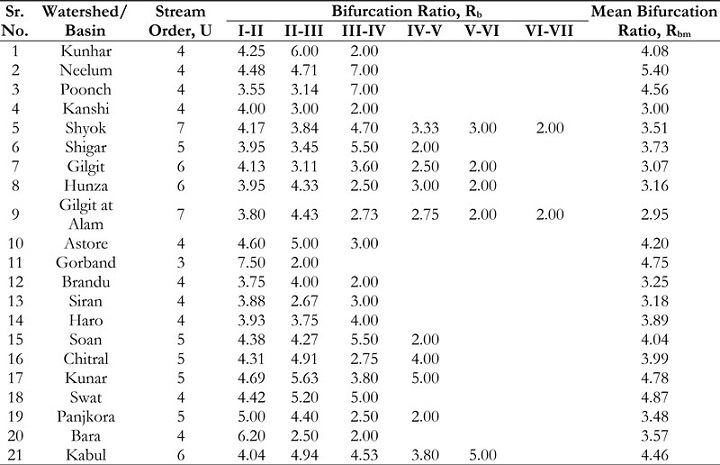
The Bifurcation Ratio, denoted as BR, is a quantitative measure utilized in several
academic disciplines to assess the branching pattern of a certain system. The dimensionless
quantity under consideration functions as a measure of the level of connectivity between streams
of different orders within a certain drainage basin. The data reported in Table 6 demonstrates
that the Rb values observed in all 21 subbasins display a variation ranging from 2.00 to 6.20. The
Mean Bifurcation Ratio (MBR) displays a spectrum of values ranging from 3.00 to 5.40. The
Neelum watershed demonstrates the highest values of MBR, specifically 5.40, indicating an early
peak in the hydrograph and a reduced lag time within the basin. The aforementioned observation
suggests that the structural variables have a substantial impact on the establishment of drainage
patterns within this watershed. The regions of Kanshi and Shigar exhibit the lowest MBR levels,
specifically at 3.0 and 3.07, respectively. The aforementioned numerical values suggest a delayed
occurrence of the peak in the hydrograph. Based on the research conducted by Strahler in 1964,
it was observed that the bifurcation ratio often falls within the range of 3.0 to 5.0 in drainage
basins that have not undergone any geological alterations [22]. All subbasins encompassed
within this range exhibit geologically favorable formations that do not exert any discernible
impact on the drainage pattern. The provided MBR values presented in Table 6 illustrate an
immediate peak observed in the hydrograph, indicating a relatively shorter lag period for the
basin.
Table 5: Stream length ratios of mountainous watersheds of UIB, Pakistan
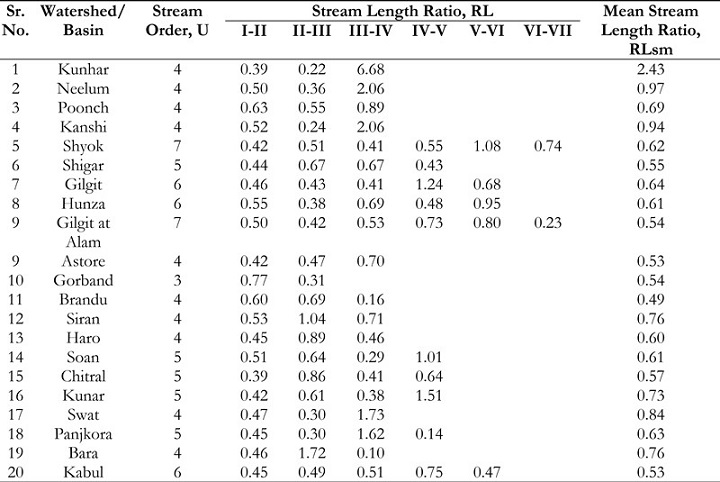
Table 6: BR of mountainous watersheds of UIB, Pakistan.
The determination of the perimeter of a basin, denoted as P, is achieved through the
measurement of the cumulative length along the boundaries that delineate separate watersheds.
The aforementioned metric possesses the capacity to serve as an evaluative tool for analyzing the many aspects and structures of a particular watershed. The various perimeters of the
subbasins within the UIB are presented in Table 7, ranging from 180 km to 3138 km. The Kabul
basin exhibits the largest diameter, measuring 3138 km in length [23].
The Length of Overland Flow (LOF) refers to the distance that water travels across the
land surface before it converges into a well-defined stream channel. The Landform variable,
often known as LOF, plays a significant role in shaping the hydrologic and physiographic
characteristics of drainage basins. The estimation of length of overland flow can be estimated as
approximately 0.5 times the inverse of DD [24]. The aforementioned element demonstrates a
negative link with the average gradient of the channel and displays a significant association with
the magnitude of sheet flow. The research domain exhibits a range of LOF values, varying from
2.16 to 2.95 km, as illustrated in Table 7.
Table 7: Area, perimeter, longest flow path, and length of overland flow of mountainous
watersheds of UIB, Pakistan.
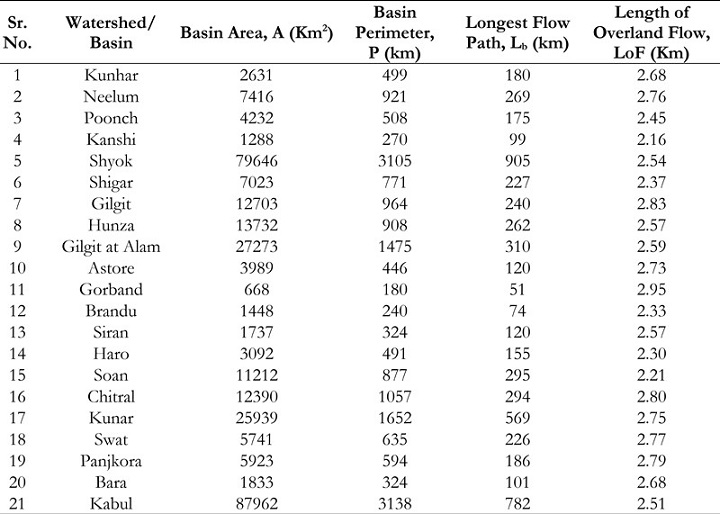
Table 7 illustrates the considerable disparity in the Longest Flow Path (LFP) among the
subbasins of the UIB, with a range of values spanning from 51 km to 905 km. The Shyok basin
exhibits a considerable perimeter, measuring 905 km [25].
Key Attributes of Aerial Phenomena:
The morphometric analysis of a basin revealed that a positive correlation has been seen
between the size of a watershed and the rates of runoff volume [26]. The evaluation of the
maximum rate at which runoff occurs holds substantial significance in the development of
erosion control structures and channels designed to accept the highest possible volume of
runoff. The drainage areas of the subbasins within UIB exhibit significant variation, with values
ranging from 668 km2 to 87,962 km2, as documented in Table 7. The Kabul basin exhibits a
substantial extent in terms of its geographical dimensions. All 21 subbasins have been classified
into four distinct groups based on their respective sizes. The classification of these groups is as follows: the watershed group, which contains areas up to 1,000 km2; the sub-catchment group,
which ranges from 1,000 to 7,000 km2; the catchment group, spanning from 7,000 to 30,000
km2; and the basin group, which includes territories between 30,000 and 95,000 km2. Based on
the aforementioned criteria, it is apparent that two basins have been identified within the
watershed, whilst ten basins have been classified as sub-catchments. Moreover, a comprehensive
analysis has revealed a total of eight basins as catchments, with two basins being explicitly
designated as basins, as depicted in Figure 4. The Shyok and Kabul River basins are situated
within the encompassing basin [27].
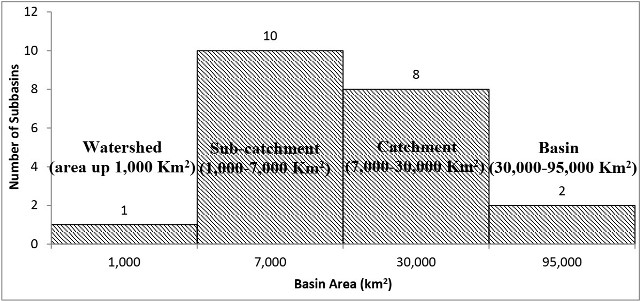
Figure 4: Number of basins by drainage basin area.
The concept of DD pertains to the proximity of channel spacing and serves as a
quantitative measure of landscape fragmentation and the probability of surface runoff. The
density factor is subject to the influence of multiple factors, such as climate, rock composition,
topography, infiltration capacity, vegetation density, and run-off intensity index. The computed
values of DD within the UIB region is shown in Table 8, which demonstrates a variation ranging
from 0.170 to 0.231 km-1. The numbers given above are indicative of the presence of regions
characterized by the existence of resilient permeable material, abundant vegetation, and minimal
topographic variation. Consequently, these areas exhibit a greater propensity for infiltration and
might be considered favorable sites for groundwater recharge when compared to watersheds
characterized by high DD values. Based on the variable DD, it can be inferred that Gilgit will
exhibit the longest basin lag time, while Soan will have the smallest lag time [28].
A positive association has been observed between the Frequency of Streams (FS) and
the DD within the watershed. This suggested that an increase in DD is associated with a greater
number of streams. The recorded values of Fs in each subbasin are displayed in Table 8,
exhibiting a range spanning from 0.021 to 0.029. The data demonstrated suggests a noteworthy
occurrence of markedly low Fs values. The analysis of stream frequency data revealed a very
sparse distribution of streams inside the subbasins. Furthermore, this observation implied that
the basin exhibits a restricted quantity of drainage outlets or conduits. The rationale behind this
phenomenon can be attributed to the sedimentary geology of the particular study site. This
suggested that there are constraints on the availability of storm runoff, which could potentially
lead to the occurrence of a devastating flood event. The probability of flooding escalates when
the capacity of a limited number of water outlets is rapidly surpassed, both during and following
a storm event.
The importance of the Texture Ratio (TR) in evaluating drainage morphometrics has
been highlighted. The significance of Drainage Texture (DT) is highly relevant in the field of geomorphology as it pertains to the spatial organization of drainage lines. The attributes of
drainage are subject to the effect of lithology, infiltration capacity, and topographic
characteristics of the terrain. This study presents a taxonomy for characterizing DT, which
encompasses five distinct classifications: very coarse (less than 2), coarse (2 to 4), moderate (4
to 6), fine (6 to 8), and very fine (more than 8). The findings of the study are presented in Table
8, indicating that the values for all basins are below 2. This suggested that the drainage texture
of these basins can be classified as very coarse [18].
The concept of Drainage Intensity (DI) suggests that when the DI value is low, the
impact of DD and stream frequency on the degree of surface erosion caused by denudation
agents is minimal or negligible. The findings shown in Table 8 demonstrate a correlation
between the values of DI and a decrease in DD, stream frequency, and drainage intensity. These
factors, when combined, work together to result in a reduced rate of surface runoff removal
within the watershed. Consequently, this particular situation renders the watershed more
vulnerable to the incidence of flooding, gully erosion, and landslides [13].
Table 8: SF, DD, TR, DT, DI, and IN of Mountain Watersheds in Pakistan's UIB.
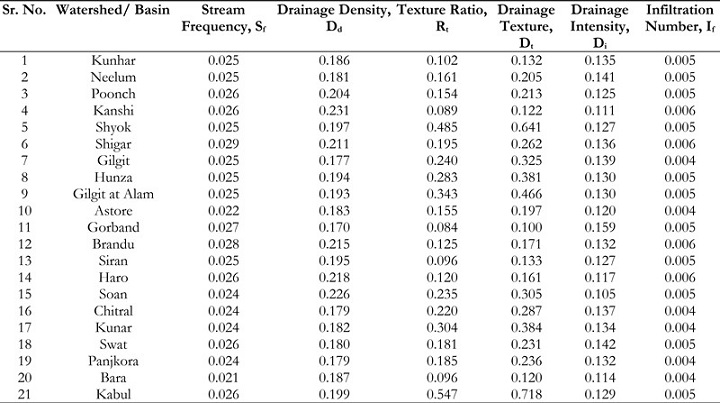
The Infiltration Number (IN) is seen to vary within the range of 0.004 and 0.006, as
reported in Table 8 of the current research. Within the specific environment being considered,
the presence of low values may indicate a heightened level of infiltration and a diminished level
of run-off. The present analysis provides significant insights into the infiltration features of the
watershed. The Form Factor (FF) is a numerical metric that regularly exhibits values below
0.754, indicating the existence of a watershed with a perfectly circular morphology. Basins
characterized by high FF are correlated with elevated peak flows of relatively shorter periods,
while extended subwatersheds with low form factors exhibit reduced peak flow rates that persist
for longer durations. The FF values for each of the 21 subbasins are displayed in Table 8. These values indicate elongated shapes and imply the existence of prolonged periods with flat
hydrograph peaks.
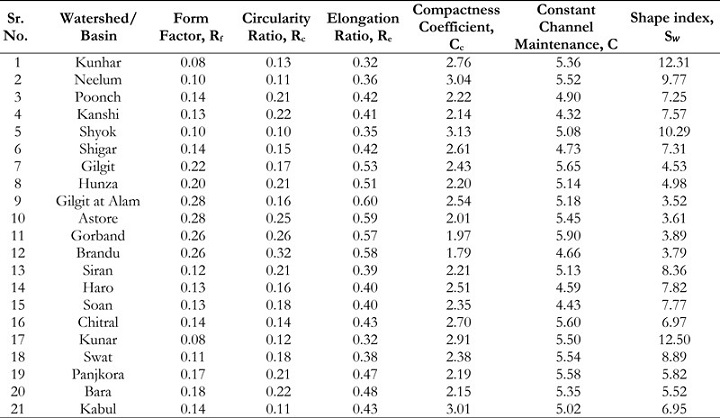
The Circularity Ratio (CR) has been shown in Table 8 which displays the range of Rc
values for various sub-watersheds located within the UIB, with a variability ranging from 0.10
to 0.32. The Elongation Ratio, denoted as ER, is a quantitative measure used to evaluate the
extent of elongation or deformation experienced by a material under external stress. According
to Strahler, the aforementioned ratio has a range of values spanning from 0.6 to 1.0 across
different climatic and geologic categorizations. The improvement of watershed slope
classification can be achieved through the utilization of the elongation ratio index. The current
index categorizes slopes based on their elongation values, including circular slopes (0.9-0.10),
oval slopes (0.8-0.9), less elongated slopes (0.7-0.8), elongated slopes (0.5-0.7), and very
elongated slopes (< 0.5). Table 9 contains the statistical data regarding the elongation ratio. The
Reynolds Number (RN) of the subbasins in Gilgit, Hunza, Gorband, Brandu, Panjkora, and
Bara is less than 0.7. This observation suggested that the subbasins being studied exhibit an
elongated shape with significant differences in elevation and steep slopes. The research findings
indicate that there will be a reduction in travel time, enhanced concentration levels, decreased
setbacks, and a decrease in the frequency of flood peaks. The subbasins that remain exhibit
values below 0.5, indicating their elongated nature and vulnerability to erosion and the
accumulation of silt.
The Compactness Coefficient, denoted as C, is a quantitative measure employed to
assess the circularity of a basin. The observation of a circular basin exhibiting the minimum time
of concentration before the initiation of peak flow within the basin has been documented. A
Coefficient of Circularity (CC) equal to 1 signifies that the basin exhibits optimal circular
attributes. A credit card number that exceeds 1 signifies an increased degree of departure from
the circular characteristics of the basin. The assigned values for each subwatershed exhibit
variation, ranging from 1.79 for Brandu to 3.13 for Shyok, as illustrated in Table 9. Consequently,
it may be inferred that the Shyok subbasin exhibits the most pronounced departure from a
circular morphology, suggesting that it will experience a more prolonged duration of
concentration before attaining its maximum flow rate in comparison to the remaining subbasins.
The mathematical definition of the constant denoting channel maintenance, sometimes
written as C, is the reciprocal of the Drainage Density (DD). This statistical measure calculates
the necessary extent of the drainage area to sustain a predetermined length of a canal. The results
of the current investigation demonstrated that variable C exhibits a variety of values, specifically
ranging from 4.32 for Kanshi to 5.65 for Gilgit, as depicted in Table 9. The Kanshi, Soan, and
Haro subbasins exhibit distinct features such as the presence of soils with poor resistivity, little
vegetation, and rugged topography.
The shape index, denoted as S𝑤, is a quantitative metric employed to evaluate the shape
characteristics of an object. The arrangement of a drainage basin is a significant factor in
influencing the extent of water and sediment flow, as well as the size and topographic variations
of the basin. The form index values for the sub-watersheds within the research region exhibit a
notable disparity, with Gilgit recording a value of 3.52 and Kunar registering a value of 12.50, as
depicted in Table 9. Within the context of surface water, it is apparent that Gilgit demonstrates
a comparatively lower basin lag time, whereas Kunar exhibits a greater basin lag time.
Table 9: Shape characteristics (areal aspects) of mountainous watersheds of UIB, Pakistan.
Relief Dimensions:
The morphometric examination of a basin encompasses the evaluation of several relief
characteristics, such as topography, relief ratio, relative relief, and roughness number. Table 10
displays the relief characteristics of each subbasin. The subject matter under consideration refers
to the discipline of topography. The UIB exhibits an elevation variation spanning from 215m to
8566m above Mean Sea Level (MSL). The influence of altitude on meteorological variables,
particularly temperature and snow accumulation, is widely acknowledged in scholarly
discussions. The impact of changes in elevation on the processes of snowmelt and snow
accumulation within mountainous watersheds has considerable importance. One potential
strategy for enhancing simulation efficiency involves the subdivision of watersheds into distinct
height bands, particularly in cases where there are notable changes in elevation and complex
topographical features. The assessment of the distribution of the basin's area across different
elevation classes among the 21 sub-basins was conducted and visually depicted in Figure 5.
Figure 6 (See at the end of Paper) illustrates the geographical attributes of each subbasin.
The RR is a quantitative measure that assesses the vertical disparity between the
maximum elevation observed inside a specific hydrological basin and the minimum height
situated on the valley bottom. The topographic variation of the river basin, ranging from 0.53
km to 7.22 km, is a crucial factor to consider in this particular situation. The concept pertains to
the quantitative assessment of the collective magnitude of incline shown by a hydrological basin.
Moreover, it serves as a dependable indicator of the magnitude of erosion phenomena taking
place on the inclines of the basin. There is typically a positive relationship between the Hydraulic
Radius (HR) and the decrease in drainage area and size of a given drainage basin. The results of
the current investigation indicate that the Rh values, as presented in Table 10, display variation
across different geographic regions. In the Shyok region, the least observed value of HR is
recorded as 0.01, while the highest reported value is documented as 0.074 in Gorband. Elevated
levels of HR values indicate the existence of significant erosion processes. The findings of this
study suggest that Gorband and Astore exhibit a higher vulnerability to erosion relative to Shyok, based on a single criterion used to assess erosion severity in the subwatersheds of the studied
area.
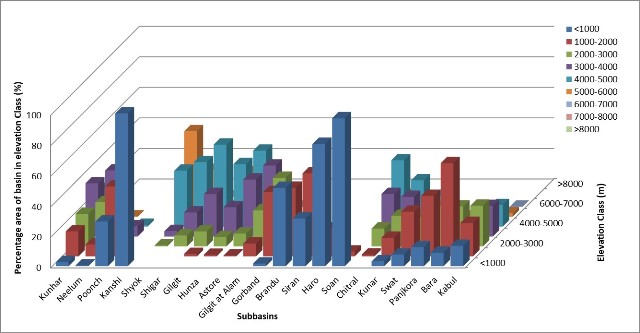
Figure 5:
Percentage area of subbasins in various elevation classes.
Table 10: Maximum & minimum elevation, basin relief, relief ratio, relative relief, and
ruggedness numbers of mountainous watersheds of UIB, Pakistan.
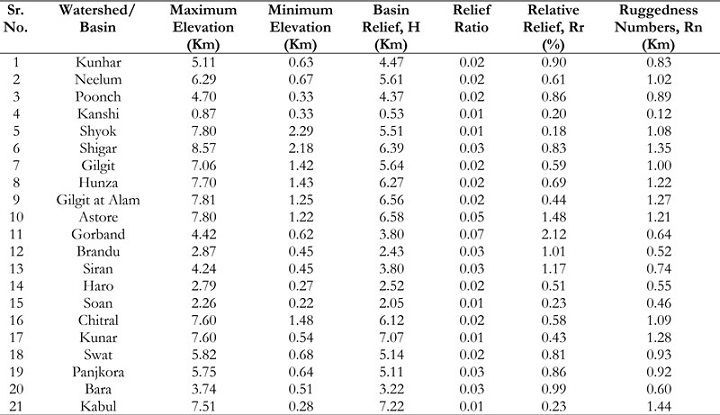
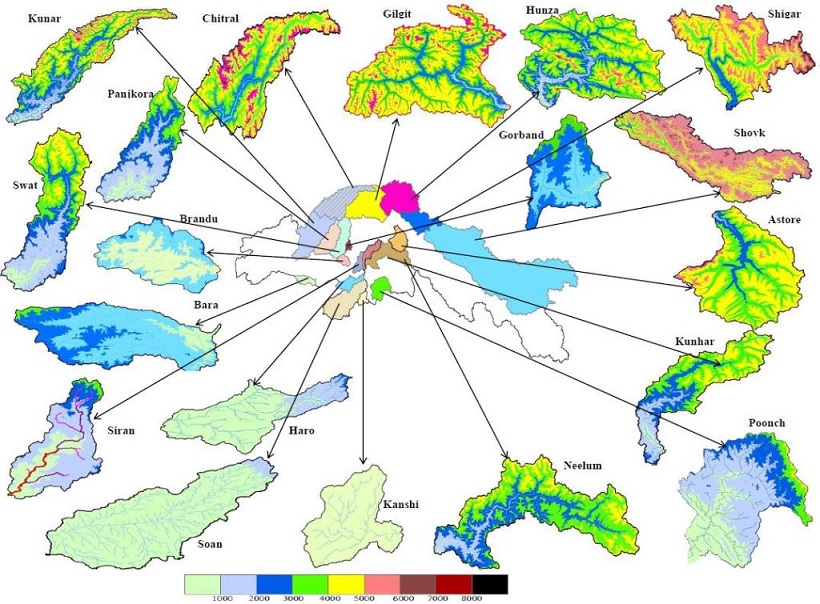
Figure 6:
Topography of subbasins of Indus Bain Basin (IBB), Pakistan. (Elevation is in meter unit from above MSL)
The Ruggedness Number (Rn) is a quantitative metric employed to evaluate the level of
structural complexity exhibited by a specific topography, taking into account factors such as
variations in elevation and the density of water channels. Furthermore, this suggested that the
region is prone to soil erosion. The results reported in Table 10 of the current study revealed
that Kanshi and Soan display the lowest roughness values (𝑅𝑛 = 0.12 and 0.46, respectively),
while Kabul exhibits the highest roughness value (𝑅𝑛 = 1.44). The findings suggest that the subwatershed of Soan exhibits the lowest susceptibility to erosion, whereas the subwatershed of
Kabul demonstrates the highest vulnerability relative to all other sub-watersheds within the
examined region.
Discussion
The analysis of geomorphometric characteristics associated with the drainage network
is an essential requirement for conducting hydrological investigations. Hence, the analysis of the
dynamics and interrelationships of stream networks plays a crucial role in many water resourcesrelated research endeavors. The utilization of remote sensing satellite data and (GIS
methodologies have the potential to enhance the efficiency of drainage delineation. Through the
integration of recently updated datasets with pre-existing ones, geomorphologists can attain
positive outcomes that facilitate the formulation of decisive findings about the drainage basin.
The current study involves doing a geomorphometric analysis on 21 subbasins situated in the
mountainous area of the UIB in Pakistan. The current study is based on several drainage
characteristics and utilizes satellite data from remote sensing, along with advanced GIS
methodologies. It can be deduced that subbasins characterized by challenging topography are
classified as seventh-order basins. The primary distinguishing feature of subbasins is the
predominance of streams with lower orders. The morphometric analysis involved the
quantification and evaluation of many characteristics of basins, including linear, areal, and relief
properties. A thorough examination of the morphometric characteristics of all sub-watersheds
uncovers the existence of dendritic to sub-dendritic drainage patterns. These patterns suggest a
significant level of lithological uniformity within the designated study region. Moreover, the
variations in Rb values seen throughout the sub-watersheds can be ascribed to differences in
topography and the geometric attributes of each specific sub-watershed. The frequency of
stream order occurrence is highest in first-order streams, followed by second-order streams. The
available empirical evidence about stream frequency reveals a noteworthy association between
sub-basins and the proliferation of stream population, particularly about the increase in DD.
The DD values of the subbasins are less than five, indicating that the subsurface area
exhibits permeability, which is a prominent characteristic of coarse drainage. The observed
variations in stream length ratios can be attributed to the variety in slope and topographic
characteristics of the region. The available empirical data about stream frequency values
suggested a direct relationship between the number of stream segments and the DD in all
subwatersheds. A notable fraction of subbasins exhibited a greater degree of elongation, while
the remaining subbasins also displayed elongation. Greater elongation ratio measurements
indicated a heightened capacity for infiltration and a diminished inclination for runoff.
Conversely, lower Reynolds numbers indicated a heightened vulnerability to erosion and silt
deposition. The database information and knowledge generated from the study possess the
potential to make a valuable contribution towards the effective implementation of the integrated
watershed project. The primary objective of this project is to enhance the facilitation of water
resource development and management in the UIB region in the foreseeable future.
Conclusion
In conclusion, it can be inferred that the presented evidence substantiates the stated hypothesis.
The findings from this investigation have resulted in the formulation of specific conclusions.
• It may be deduced that subbasins characterized by rugged topography are consistently
classified as basins of the seventh order. The primary distinguishing feature of subbasins
is the prevalence of lower-order streams.
• The available empirical data on stream frequency suggests that there is a positive
relationship between the number of streams and the density of drainage within all subbasins.
• The DD values of the subbasins are found to be less than five, indicating that the
subsurface area exhibits permeability, a trait commonly associated with coarse drainage.
• A considerable fraction of subbasins display elongated configurations, characterized by
notable variations in elevation and severe gradients. As a result, the subbasins undergo
reduced trip durations, increased levels of concentration, prolonged lag times, and
extended periods of flood peaks.
• Higher values of the elongation ratio are indicative of a greater infiltration potential and a
reduced amount of runoff. Conversely, lower Reynolds (Re) values exhibit a positive
correlation with an augmented vulnerability to erosion and the accumulation of silt.
Reference
[1] K. J. Gregory, “Drainage networks and climate. Chapter 10 in Geomorphology and Climate
(E, Derbyshire ed.).,” London John Wiley, 1976.
[2] P. H. Pinchmel, “Densities de drainage et densities et densities des Valles.,” Tijol ker Ned
Ard-Kun. Genoots, pp. 373-376., 1957.
[3] R. P. C. Morgan, “The role of climate in the denudation system: A case study from west
Malaysia. Chapter II in Geomorphology and Climate (Derbyshire, E ed.).,” London John Wiley
Sons, 1976.
[4] S. DE Chorley RJ, Schumm SA, “Geomorphology. Methuen, London. GIS techniques.,”
Int. J. Eng. Sci. Technol., vol. 2, no. 12, pp. 7763–7770, 1984.
[5] S. S, “Quantitative analysis of watershed geomorphology using remote sensing techniques.,”
Ann Arid Zo., vol. 34, no. 4, pp. 243–251, 1995.
[6] P. E. Potter, “ A Quantitative Geomorphic Study of Drainage Basin Characteristics in the
Clinch Mountain Area, Virginia and Tennessee. V. C. Miller ,”
https://doi.org/10.1086/626413, vol. 65, no. 1, pp. 112–113, Jan. 1957, doi: 10.1086/626413.
[7] “Faniran, A. (1968) The Index of Drainage Intensity—A Provisional New Drainage Factor.
Australian Journal of Science, 31, 328-330. - References - Scientific Research Publishing.”
https://www.scirp.org/(S(351jmbntvnsjt1aadkposzje))/reference/ReferencesPapers.aspx?
ReferenceID=1845498 (accessed Oct. 10, 2023).
[8] “Schumm, S.A. (1956) Evolution of Drainage Systems and Slopes in Badlands at Perth
Amboy, New Jersey. Geological Society of America Bulletin, 67, 597-646. - References -
Scientific Research Publishing.”
https://www.scirp.org/(S(351jmbntvnsjt1aadkposzje))/reference/ReferencesPapers.aspx?
ReferenceID=1768382 (accessed Oct. 10, 2023).
[9] R. Chorley, “Horton, R.E. 1945: Erosional development of streams and their drainage
basins: Hydrophysical approach to quantitative morphology. Bulletin of the Geological
Society of America 56, 2 75-370,” Prog. Phys. Geogr., vol. 19, no. 4, pp. 533–554, Dec. 1995,
doi: 10.1177/030913339501900406/ASSET/030913339501900406.FP.PNG_V03.
[10] “Melton, M. (1957) An Analysis of the Relations Among Elements of Climate, Surface
Properties and Geomorphology. Department of Geology, Columbia University, Technical
Report, 11, Project NR 389-042. Office of Navy Research, New York. - References -
Scientific Research Publishing.”
https://www.scirp.org/(S(i43dyn45teexjx455qlt3d2q))/reference/ReferencesPapers.aspx?
ReferenceID=2029733 (accessed Oct. 10, 2023).
[11] W. Liu and C. Shi, “Analysis of University Science Research Capability Elements and
Evaluation Based on BP Neural Network,” J. Serv. Sci. Manag., vol. 01, no. 03, pp. 266–271,
2008, doi: 10.4236/JSSM.2008.13030.
[12] B. Víg et al., “Morphometric analysis of low mountains for mapping flash flood susceptibility
in headwaters,” Nat. Hazards, vol. 114, no. 3, pp. 3235–3254, Dec. 2022, doi:
10.1007/S11069-022-05513-6/FIGURES/11.
[13] A. Al-Hurban, F. Al-Ruwaih, and A. Al-Dughairi, “Quantitative Geomorphological and
Hydromorphometric Analysis of Drainage Basins of As Sabriyah (Kuwait) Using GIS Techniques,” J. Geogr. Inf. Syst., vol. 13, no. 02, pp. 166–193, 2021, doi:
10.4236/JGIS.2021.132010.
[14] N. Hadadin, Z. Tarawneh, K. Shatanawi, Q. Banihani, and M. R. Hamdi, “Hydrological
Analysis for Floodplain Hazard of Jeddah’s Drainage Basin, Saudi Arabia,” Arab. J. Sci. Eng.,
vol. 38, no. 12, pp. 3275–3287, Oct. 2013, doi: 10.1007/S13369-013-0812-X/METRICS.
[15] C. I. Ikhile, “Geomorphology and Hydrology of the Benin Region, Edo State, Nigeria,” Int.
J. Geosci., vol. 07, no. 02, pp. 144–157, 2016, doi: 10.4236/IJG.2016.72012.
[16] A. N. Strahler, “Quantitative Gemorphology of Drainage Basin and chanel Networks
Chapter 4 in Tech. Mem. 66/5.,” Handb. Appl. Hydrol. (e V. T. Chow (ed)). New York MC Graw
Hill., 1964.
[17] R. E. Horton, “Erosional Development of Streams and their Drainage Basins, Bulletin of
the Geological Society of America,” vol. 56, pp. 275–370, 1945.
[18] J. Krishnamurthy, G. Srinivas, V. Jayaraman, and M. Chandrasekhar, “Influence of rock
types and structures in the development of drainage networks in typical hardrock terrain,”
1996.
[19] O. YILDIZ, “An investigation of the effect of drainage density on hydrologic response,”
Turkish J. Eng. Environ. Sci., vol. 28, no. 2, pp. 85–94, 2004, Accessed: Oct. 10, 2023. [Online].
Available: http://search/yayin/detay/1268
[20] “Singh, S. (1992) Quantitative Geomorphology of the Drainage Basin. In Chouhan T.S., and
Joshi, K.N., Eds., Readings on Remote Sensing Applications, Scientific Publishers, Jodhpur.
- References - Scientific Research Publishing.”
https://www.scirp.org/(S(lz5mqp453edsnp55rrgjct55.))/reference/referencespapers.aspx?
referenceid=2163426 (accessed Oct. 10, 2023).
[21] R. V. Ruhe, “Topographic discontinuities of the Des Moines lobe [Iowa-Minnesota],” Am.
J. Sci., vol. 250, no. 1, pp. 46–56, Jan. 1952, doi: 10.2475/AJS.250.1.46.
[22] R. E. Horton, “Drainage-basin characteristics,” Eos, Trans. Am. Geophys. Union, vol. 13, no.
1, pp. 350–361, Jun. 1932, doi: 10.1029/TR013I001P00350.
[23] P. K. Rai, K. Mohan, S. Mishra, A. Ahmad, and V. N. Mishra, “A GIS-based approach in
drainage morphometric analysis of Kanhar River Basin, India,” Appl. Water Sci., vol. 7, no.
1, pp. 217–232, Mar. 2017, doi: 10.1007/S13201-014-0238-Y/FIGURES/7.
[24] I. RodrÍguez-Iturbe and L. A. Escobar, “The dependence of drainage density on climate and
geomorphology,” Hydrol. Sci. J., vol. 27, no. 2, pp. 129–137, 1982, doi:
10.1080/02626668209491095.
[25] Z. R. Ansari, L. A. K. Rao, and A. Yusuf, “Gis based morphometric analysis of yamuna
drainage network in parts of fatehabad area of agra district, Uttar Pradesh,” J. Geol. Soc. India,
vol. 79, no. 5, pp. 505–514, May 2012, doi: 10.1007/S12594-012-0075-2/METRICS.
[26] K. P. Berger and D. Entekhabi, “Basin hydrologic response relations to distributed
physiographic descriptors and climate,” J. Hydrol., vol. 247, no. 3–4, pp. 169–182, Jul. 2001,
doi: 10.1016/S0022-1694(01)00383-3.
[27] R. A. Dar, R. Chandra, and S. A. Romshoo, “Morphotectonic and lithostratigraphic analysis
of intermontane Karewa Basin of Kashmir Himalayas, India,” J. Mt. Sci., vol. 10, no. 1, pp.
1–15, Feb. 2013, doi: 10.1007/S11629-013-2494-Y/METRICS.
[28] D. Sindhu, Sadashivappa, A. S. Ravikumar, and B. L. Shivakumar, “Quantitative Analysis of
Catchment Using Remote Sensing and Geographic Information System,” Aquat. Procedia,
vol. 4, pp. 1421–1428, Jan. 2015, doi: 10.1016/J.AQPRO.2015.02.184.