This section aims to present the results and discuss the findings of the study in relation
to the research question and objectives. The primary objective of the research is to assess the
effectiveness of using Sentinel-1 and Sentinel-2 data for flood monitoring and mapping. The
research question focuses on the accuracy and reliability of these remote sensing techniques in
identifying flood inundation areas. Through the application of water indices, namely NDWI and
WRI, the study seeks to extract floodwater areas and generate flood inundation maps[14]. The
NDWI index utilizes the spectral characteristics of water and vegetation in the Near-Infrared
(NIR) and green bands, while the WRI index combines the green, red, and NIR bands to
estimate the extent of floodwater. These indices provide valuable information for detecting and
mapping flood events.
Indices Calculation:
Image Selection Based on Cloud Cover:
The selection of images with low cloud cover was driven by the need to obtain highquality and cloud-free imagery for accurate flood extent estimation. Cloud cover can significantly
hinder the visibility of the Earth's surface, particularly in optical satellite imagery such as
Sentinel-2 data, which relies on visible and near-infrared bands for water detection. By choosing
images with minimal cloud cover, the research aimed to minimize the potential for
misclassification or ambiguity in identifying flooded areas.
This selection strategy was based on historical cloud cover patterns and climatic
conditions specific to the study area. By selecting days with reduced cloud cover, the probability
of obtaining clear, high-quality images that accurately depict the magnitude of the floodwater
was heightened. The emphasis on obtaining images with minimal cloud cover aligns with the
objective of achieving accurate and reliable flood extent mapping. Clear imagery allows for better
discrimination between water and non-water areas, reducing uncertainties in the analysis. By
minimizing the impact of cloud cover, the research aimed to enhance the precision and quality
of the derived flood extent maps, thereby enabling more robust flood monitoring and
management [15]. It is worth noting that while selecting images with low cloud cover increases
the likelihood of capturing clear flood extent information, it is still important to consider the
limitations and potential influence of residual clouds or cloud shadows in the imagery. These
factors will be taken into account during the analysis and interpretation of the obtained flood
inundation maps.
The Normalized Difference Water Index (NDWI):
NDWI for July-2022:
The flood inundation maps based on the NDWI for the images captured on 17th July
and 27th July revealed important insights into the extent and intensity of the flooding in the
study area. Here is a summary of the findings based on the two images:
Image of 17th July:
• The image shows a total flooded area of approximately 2,634 hectares.
• Among the selected areas, the most affected regions are Charbagh, Manglor, Mangora,
Saidu Sharif, and Chakdara.
• These areas experienced significant flooding, indicating a substantial presence of water
bodies and potential damage to infrastructure and communities.
Image of 27th July:
• The image indicates a higher intensity of floodwater compared to the image from 17th
July.
• The total flooded area has increased to approximately 7565 hectares.
• With the exception of Kalam, all other nine areas experienced flooding.
• The areas most affected by the flood include Mangora and Saidu Sharif, followed by
Charbagh and Khwazakhela.
These findings suggest a progressive intensification of the flood event between the two
dates, with a larger area being affected by floodwaters on 27th July. The identified areas of
Charbagh, Mangora, Saidu Sharif, and Chakdara consistently showed high vulnerability to
flooding, indicating the need for focused flood management and mitigation measures in these
regions. The analysis of these images provided valuable information on the spatial distribution
of floodwaters, allowing for a better understanding of the extent and severity of the flooding in
the study area. Figure 1 shows spatial temporal flood area for the month of July using NDWI.
This knowledge can support decision-making processes related to emergency response, resource
allocation, and long-term flood mitigation strategies [16].
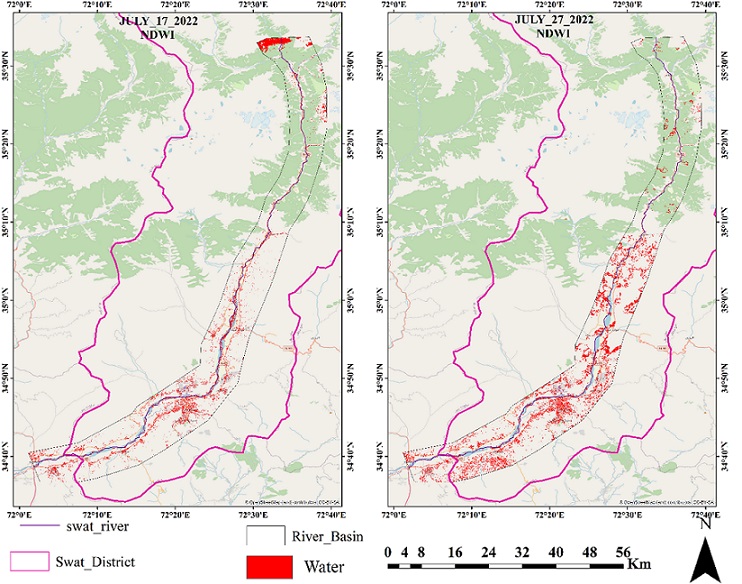
Figure 1: Spatial -temporal flood area extent for July month using the NDWI
NDWI for August-2022:
The analysis of Sentinel-2 satellite imagery for August 2022 provides valuable insights
into the extent of floodwater in the study area. Three images were obtained on different days:
5th August, 13th August, and 28th August. These specific days were selected to ensure the
acquisition of images with the lowest possible cloud cover, enhancing the quality and accuracy
of the results. The selection of specific days for imagery acquisition was based on the aim of
obtaining images with low cloud cover. Cloud cover can obstruct the visibility of floodwater and
affect the accuracy of the results. By selecting days with minimal cloud cover, the study aimed
to ensure clearer and more reliable floodwater mapping. This approach enhances the confidence
in the obtained results and facilitates a more comprehensive understanding of the spatial
distribution of flood extent in the study area [17]. On the 5th of August, the image revealed a
water extent of approximately 8,629 hectares, which accounts for about 8% of the overall basin
area. The most affected areas in this image were Mangora and Saidu Sharif, indicating localized
flooding in these regions.

Figure 2: Spatial -temporal flood area extent for August month using the NDWI
Moving to the 13th of August, the floodwater extent increased significantly. The image
showed an expanded water coverage of around 9,573 hectares, representing about 9% of the
total basin area. Mangora and Saidu Sharif remained highly affected, and the flood extent
expanded to other areas such as Charbagh, Manglor, Barikot, and Chakdara. The final image
acquired on the 28th of August depicted the highest water content among the three images. The
floodwater extent reached approximately 22,553 hectares, which accounts for about 21% of the
total basin area. The most heavily affected areas shifted to Kalam and Bahrain, with substantial
flooding observed in these regions. Additionally, all other districts in the study area exhibited a
high vulnerability to flood extent, except for Chakdara. These findings underscore the
progressive increase in the extent and intensity of the floodwater as the month of August
advanced. Mangora, Saidu Sharif, and Chakdara consistently experienced significant floodwater
presence, highlighting their high vulnerability to floods [18]. Moreover, the districts of Charbagh,
Manglor, Barikot, Kalam, and Bahrain were also significantly affected in various images,
indicating the need for targeted flood mitigation measures in these areas. Overall, the analysis of
Sentinel-2 imagery for August 2022 provides critical insights into the temporal variation and
spatial distribution of floodwater extent, enabling informed decision-making processes for
emergency response planning, resource allocation, and the implementation of effective flood
mitigation strategies in the study area.
NDWI for September-2022:
In the analysis of post-flood Sentinel-2 imagery for September, two images taken on the
6th and 16th of September were examined to assess the persistence of floodwater in the study
area. The purpose was to determine whether the floodwaters had receded or if any residual water
remained in the affected regions. The image acquired on the 6th of September indicated an
overall water extent of approximately 6,514 hectares, which accounts for around 6% of the total
basin area. The areas that were still affected by floodwaters were Mangora, Saidu Sharif, and
some parts of Mangora. The presence of water in these areas could be attributed to their
relatively fewer sloping surfaces, which may have caused water to accumulate and linger for a
longer duration compared to other parts of the river basin. Moving to the image obtained on
the 16th of September, it was observed that the affected areas still exhibited water presence.
However, the extent of the floodwater had decreased to approximately 2,520 hectares, which
accounts for about 2% of the total basin area. This reduction in the affected area suggests that
the floodwaters were gradually receding [8].
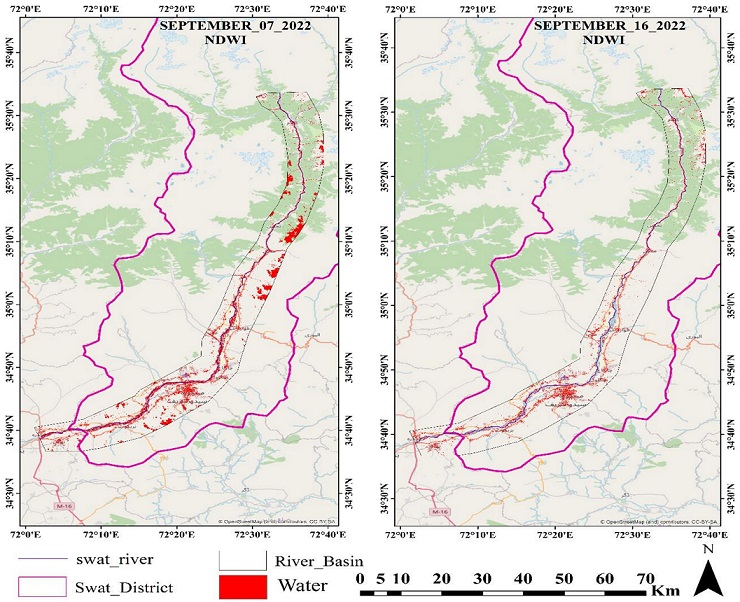
Figure 3: Spatial -temporal flood area extent for September month using the NDWI
These trends in the post-flood imagery demonstrate the effectiveness of using the
NDWI for water detection in flooded areas. The index successfully identified the presence of
water, even in the post-flood stage. However, it is important to note that the persistence of cloud cover and other factors can influence the accuracy and interpretation of the results. The
persistent presence of water in the areas of Mangora, Saidu Sharif, and parts of Manglor in both
images can be attributed to their topographical characteristics, such as flat or less sloping terrain.
These areas are more prone to water accumulation and slower drainage, resulting in a longer
duration of water presence. The analysis of September imagery highlights the importance of
considering post-flood water extent to assess the duration and persistence of floodwaters [19].
The NDWI index proved effective in identifying water presence, and the observed trends
provide valuable insights into the dynamics of the floodwaters in the study area. However, it is
crucial to acknowledge the influence of cloud cover and other factors that may affect the
accuracy and interpretation of the results. Figure 1, 2 and 3 illustrates the spatial temporal flood
area extent for the months of July, August and September respectively using NDWI.
The Water Ratio Index (WRI):
In addition to the NDWI , the WRI (Water Ratio Index) was also calculated and analyzed
to further assess the water extent and dynamics in the study area. The WRI index provides
valuable insights into the water distribution and variability, allowing for a more comprehensive
understanding of the flood event. The following sections present the results obtained from the
analysis of the WRI index, including the interpretation of the images and the identification of
water-affected areas [20].
WRI for July-2022:
In the analysis of the WRI images, it was observed that the water extent indicated by the
WRI index was generally higher than that of the NDWI. For the image acquired on the 17th of
July, the WRI index indicated a water extent of approximately 4,573 hectares, which is higher
than the water extent observed using the NDWI index. The most affected regions by the
floodwaters were Charbagh, Manglor, Mangora, Saidu Sharif, and Chakdara. Compared to the
NDWI index, the WRI index showed a higher water extent of around 2% of the total basin area.
Moving to the image obtained on the 27th of July, the water extent increased from 7,565 hectares
(as indicated by the NDWI index) to 9,432 hectares (9% of the total basin area) when using the
WRI index. The areas most affected by the floodwaters remained the same as observed in the
NDWI analysis, including Mangora and Saidu Sharif, followed by Charbagh and Khwazakhela
[21]. These findings suggested that the WRI index provides a more extensive representation of
the water extent compared to the NDWI index. The higher water extent observed in the WRI
analysis can be attributed to the inclusion of additional spectral bands (Green and Red) in the
calculation of the index. These bands contribute to a more comprehensive assessment of water
presence, especially in flood-affected regions.
The agreement between the affected areas identified by both the NDWI and WRI
indices further supports the reliability of these indices for flood mapping and water extent
analysis. The consistency in the most affected regions, such as Mangora, Saidu Sharif, Charbagh,
and Khwazakhela, underscores the reliability of the indices in capturing the spatial distribution
of floodwaters. The incorporation of the WRI index in the analysis enhances the assessment of
water extent during flood events [22]. The index demonstrates its effectiveness in identifying
and mapping flood-affected areas, with a larger water extent observed compared to the NDWI
index. The findings highlighted the importance of utilizing multiple indices for a comprehensive
understanding of flood dynamics and their impacts on the study area.
WRI for August-2022:
In the analysis of the WRI images for the month of August, which is known to be the
most flooded month, the results showed similar trends to those observed in the NDWI analysis.
For the image acquired on the 5th of August, both the WRI and NDWI indices indicated a water
extent of approximately 9,519 hectares, accounting for around 9% of the total basin area. The
most affected areas identified in this image were Mangora and Saidu Sharif, indicating localized flooding in these regions. The agreement between the WRI and NDWI results suggests the
consistency in identifying flood-affected areas during this period [23].
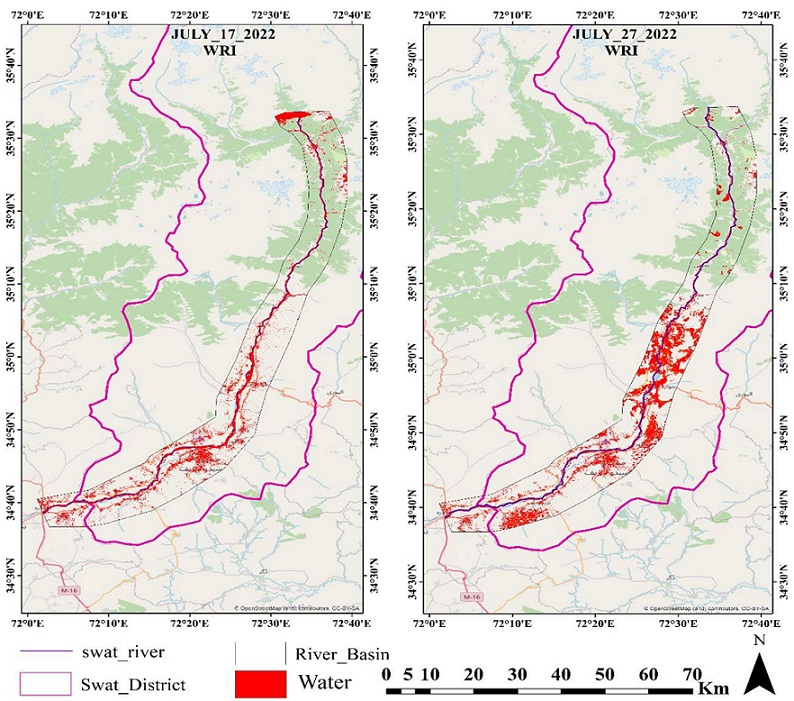
Figure 4: Spatial -temporal flood area extent for July month using the WRI.
Moving to the image acquired on the 13th of August, the water extent increased from
9,572 hectares (NDWI) to 12,962 hectares (3% increase) when using the WRI index. Mangora
and Saidu Sharif remained highly affected, and the flood extent expanded to other areas,
including Charbagh, Manglor, Barikot, and Chakdara. The WRI analysis captured the spatial
dynamics of floodwaters, demonstrating its effectiveness in identifying the expansion of floodaffected regions compared to the NDWI analysis. For the final image acquired on the 28th of
August, the water extent decreased from 22,602 hectares (21% of the total basin area) to 16,223
hectares (15% decrease) when using the WRI index. The most heavily affected areas shifted to
Kalam and Bahrain, with substantial flooding observed in these regions. It is worth noting that,
unlike the NDWI analysis, the WRI index also indicated the impact of flooding in Chakdara,
highlighting the importance of incorporating additional spectral bands in the index calculation
[24]. Figure 4 and 5 shows spatial-temporal flood are extent for the months of July and August
respectively using WRI.
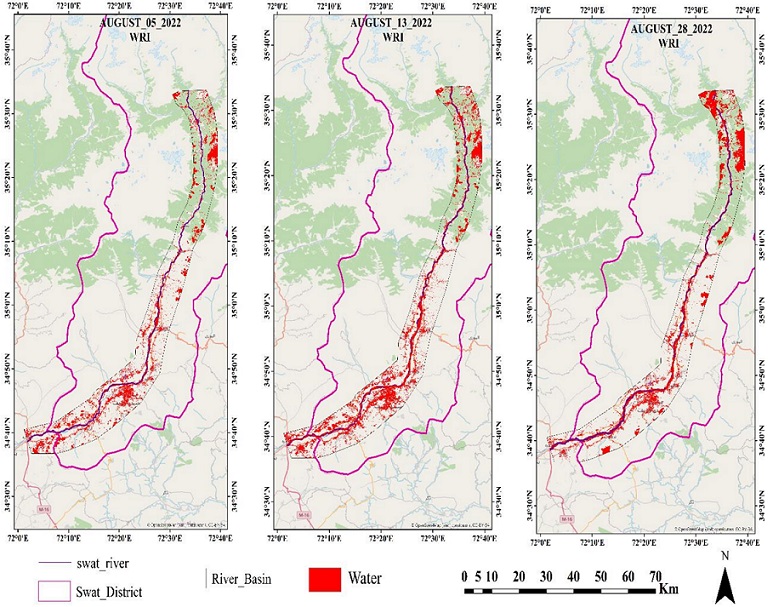
Figure 5: Spatial -temporal flood area extent for August month using the WRI
The results emphasized the capability of the WRI index in capturing the changes in flood
extent and identifying the most affected areas. The agreement between the WRI and NDWI
analyses confirms the reliability of both indices in mapping floodwaters. The observed
differences in the affected areas between the two indices highlighted the complementary nature
of the WRI index, which provides additional insights into the spatial distribution of floodwaters
and enhances the overall understanding of flood dynamics in the study area. In summary, the
WRI index proved valuable in assessing the water extent during the highly flooded month of
August. It effectively identified and mapped flood-affected areas, showing consistency with the
results obtained from the NDWI analysis. The inclusion of additional spectral bands in the WRI
index calculation contributed to a comprehensive assessment of flood dynamics, capturing
localized flooding and the expansion of flood extents in different regions [25].
WRI for post flood month (September-2022):
In September, the post-flood period, two images were obtained on the 6th and 16th of
the month to assess the persistence of floodwaters. The results obtained from the WRI analysis
revealed the presence of water in the study area, indicating the potential residual impacts of the
floods.
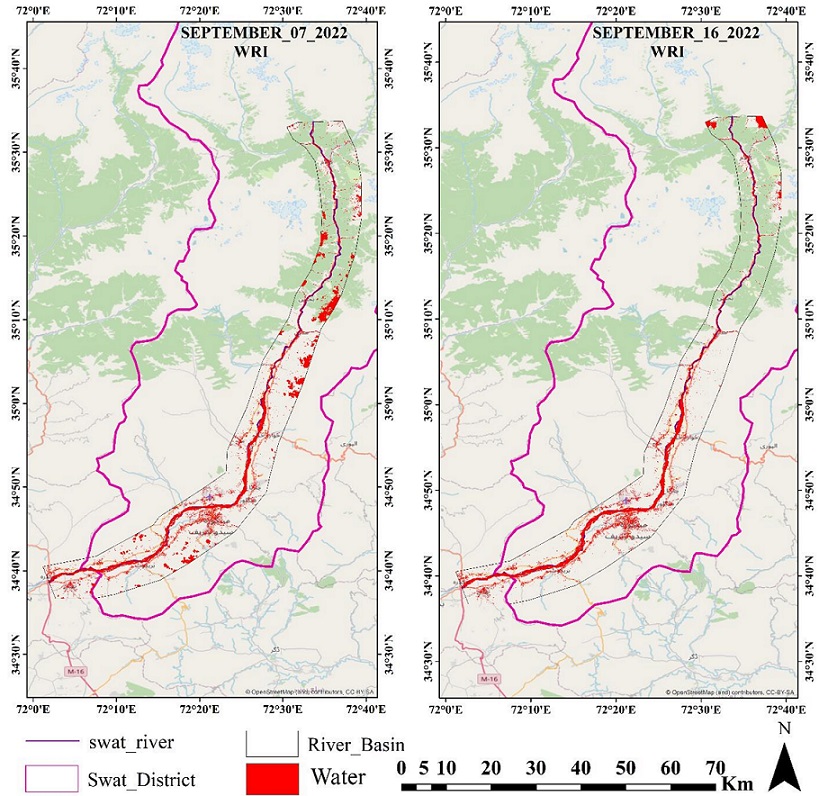
Figure 6: Spatial -temporal flood area extent for September month using the WRI
For the image acquired on the 6th of September, the WRI index identified an area of
approximately 7,834 hectares (7% of the total basin area) still covered by water. This was slightly
higher than the area identified using the NDWI, which was 6%. The areas that were still affected
by floodwaters included Mangora, Saidu Sharif, and some parts of Manglor. The persistence of
water in these areas could be attributed to their fewer sloping surfaces compared to other parts
of the river basin, which hindered the rapid drainage of floodwaters. Moving to the image
acquired on the 16th of September, it was observed that approximately 2,732 hectares (2.5%) of
the area were still affected by floodwaters according to the WRI analysis. This was higher than
the area identified using the NDWI analysis, which was 2,520 hectares. In above figure 6, it was
notable that some areas of Kalam, which were missing in the NDWI analysis, were still affected by floodwaters. Additionally, Mangora and Barikot were identified as the most affected areas
using this image.
The results of the WRI analysis in the post-flood period highlight the persistence of
floodwaters in certain areas, indicating the slower drainage and accumulation of water in regions
with less sloping terrain. The WRI index provided valuable information on the extent of water
coverage, supplementing the findings from the NDWI analysis. The differences observed in the
affected areas between the WRI and NDWI indices highlight the importance of considering
multiple indices to gain a comprehensive understanding of post-flood conditions. Overall, the
results demonstrated that the WRI index effectively captured the presence of water in the postflood period, allowing for the identification of areas still affected by floodwaters. This
information contributes to a better understanding of the long-lasting impacts of floods and helps
in assessing the recovery and resilience of the study area in the aftermath of flooding events.
Flood Inundation Using Sentinel-1:
In addition to the flood extent maps derived from Sentinel-2 data using the NDWI and
WRI indices, flood inundation maps were also generated using Sentinel-1 data. The Sentinel-1
data provides valuable information on flood conditions, especially in areas with high cloud cover
or during nighttime when optical sensors are limited. For the flood inundation mapping using
Sentinel-1 data, a total of 15 images were acquired for each month, including July, August, and
September. These images were processed and filtered using speckle filtering techniques to
reduce noise and enhance the visibility of flood signals. The filtered images were then combined
using the mosaic function to create a single image representing the flood extent for each month.
The mosaic function effectively merges multiple Sentinel-1 images to generate a composite
image that reflects the cumulative flood extent over the respective month. This approach allows
for a comprehensive representation of the flood conditions during the specific time periods.
The flood inundation maps generated from Sentinel-1 data provide additional insights
into the spatial distribution of floodwaters, complementing the information derived from
Sentinel-2 data. The inclusion of Sentinel-1 data enhances the accuracy and reliability of the
flood extent assessment, especially in challenging conditions such as high cloud cover or in areas
with dense vegetation. By integrating the flood inundation maps from both Sentinel-1 and
Sentinel-2 data, a more comprehensive understanding of the flood dynamics and the extent of
water coverage can be obtained. This multi-sensor approach improves the reliability and
robustness of the flood mapping results, enabling better-informed decision-making and flood
management strategies.
The flood inundation maps generated from Sentinel-1 data, in combination with the
NDWI and WRI indices derived from Sentinel-2 data, provided a comprehensive assessment of
the flood conditions in the study area. These maps contribute to the understanding of the spatial
and temporal variations in flood extent, helping to identify the most affected areas and assess
the overall impact of the floods on the region. It is worth noting that the utilization of both
Sentinel-1 and Sentinel-2 data sets and the integration of various indices and flood mapping
techniques contribute to a more accurate and comprehensive analysis of the flood events. This
multi-sensor and multi-index approach enhances the reliability and effectiveness of flood
monitoring and assessment, supporting decision-makers and stakeholders in implementing
appropriate mitigation and adaptation measures.
Flood Inundation Extant for July-2022:
The flood inundation mapping using Sentinel-1 data for the month of July revealed a
total flood area of approximately 12982 hectares, accounting for approximately 12% of the study
area as indicated in figure 7. This information was obtained by creating a mosaic of all 15
available images from Sentinel-1 and utilizing the IW (Interferometric Wide) and VH
(Vertical/Horizontal) polarization bands in Google Earth Engine. The analysis of the flood inundation map indicated that the areas most affected by the floods were Kalam, Bahrain,
Mangora, Saidu Sharif, Barikot and Madyan. These regions are characterized by high altitudes,
which can contribute to increased susceptibility to flooding due to steep terrain and higher water
runoff. Conversely, the lower altitude areas within the study area were relatively less affected by
the floods. By incorporating the Sentinel-1 data, which is based on radar technology, the flood
extent mapping provides additional insights into the areas affected by the floods. Radar data is
less influenced by atmospheric conditions, such as cloud cover, and can penetrate through
vegetation, allowing for a more accurate assessment of flood extent.
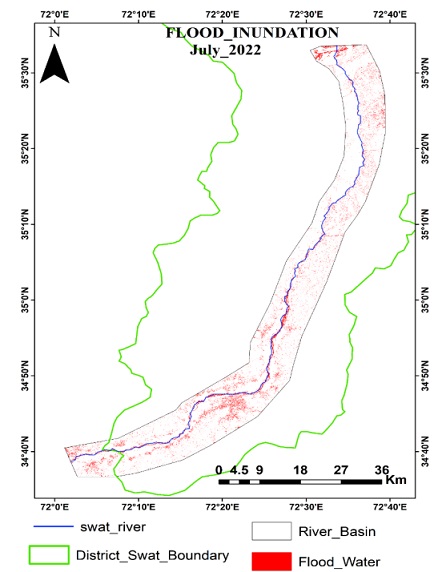
Figure 7: Sentinel-1 Flood Inundation Map for July-200
The inclusion of high-altitude areas, such as Kalam, Bahrain, and Madyan, among the
most affected regions highlights the role of topography in influencing flood dynamics. The steep
slopes and narrow valleys in these areas can exacerbate the flow of water, leading to increased
flood inundation. Overall, the integration of Sentinel-1 data in the flood inundation mapping
enhances the understanding of the spatial distribution of floodwaters and helps identify the areas
that are most susceptible to flooding. This information can be valuable for disaster management
and planning authorities to implement appropriate measures for flood mitigation and
preparedness in the affected regions.
Flood Inundation Extant for August-2022:
In the case of flood inundation mapping for the month of August, the mosaic of all the
available images from Sentinel-1 revealed a significant extent of flooding. The analysis of this
map indicates that approximately 40% of the study area, accounting for about 43,126 hectares,
was experiencing floods during this period. The flood extent map clearly depicts the severity of
the floods, with many locations experiencing severe to extreme flood conditions. Among the most affected areas, Kalam stands out as the region experiencing the highest flood extent.
Following Kalam, areas such as Bahrain, Madyan, Mangora, Saidu Sharif, and Barikot also
experienced high flood events.
The high flood levels in Kalam, Bahrain, and Madyan highlight the vulnerability of these
regions to intense flooding. Factors such as steep terrain, narrow valleys, and high rainfall
intensity contribute to the heightened flood risk in these areas. The presence of such severe
flood conditions indicates the potential for significant damage to infrastructure, agriculture, and
livelihoods in these regions. The flood extent in Mangora, Saidu Sharif, and Barikot also reached
significant levels, indicating widespread inundation in these areas. The severity of the floods
underscores the importance of comprehensive flood management strategies and early warning
systems to mitigate the potential impacts on communities and infrastructure. Figure 8 shows
Sentinel 1 flood induction map for August 2002.
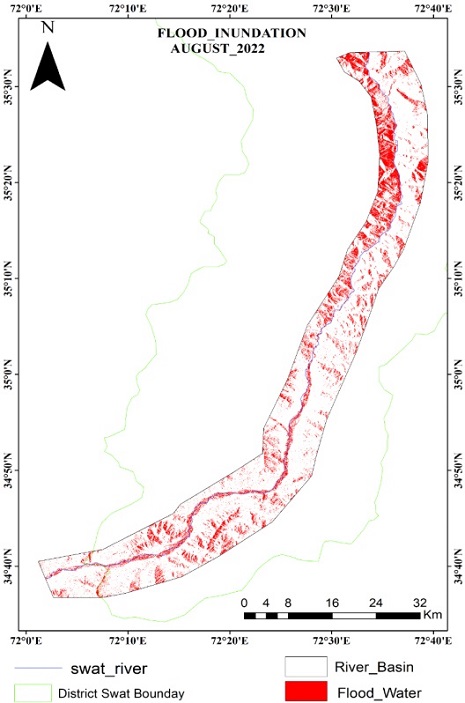
Figure 8: Sentinel-1 Flood Inundation Map for August-2002
By utilizing the Sentinel-1 data and generating the flood inundation map for August, a
detailed understanding of the spatial distribution and severity of the floods can be obtained. This
information is crucial for disaster response and recovery efforts, as it enables targeted
interventions and resource allocation to the most affected areas. Overall, the flood inundation
mapping for August highlights the widespread nature of the floods, with a significant portion of
the study area experiencing severe inundation. This information can support decision-makers and disaster management authorities in developing effective strategies for flood mitigation,
preparedness, and response in the affected regions.
Flood Inundation Extant for September-2022:
In the month of September, which is the post-flood period, the flood inundation
mapping using Sentinel-1 data indicated that an area of approximately 6,624 hectares, accounting
for approximately 6% of the total study area, remained under flood extent as indicated in figure
9. This information was obtained by analyzing a mosaic image generated from the 15 available
Sentinel-1 images for the month of September. The analysis of the flood extent in the post-flood
month provides insights into the persistence of floodwaters and the areas that are still affected.
High-altitude regions such as Kalam, Bahrain, and Madyan were observed to still have
floodwaters, indicating the slow receding process in these areas. On the other hand, low-lying
areas experienced a relatively lower impact and were less affected by the floodwaters during this
period.
The inclusion of Sentinel-1 data in the flood inundation mapping allows for the
identification and monitoring of post-flood water bodies, aiding in the assessment of the flood
recovery process. This information is valuable for understanding the long-term impacts of
flooding and facilitating appropriate measures for rehabilitation and mitigation efforts in the
affected areas. By combining the flood inundation maps from different months and sources, a
comprehensive understanding of the flood dynamics and their impacts on different regions can
be obtained. This integrated approach facilitates a better assessment of the flood situation and
aids in decision-making processes for effective flood management and mitigation strategies.
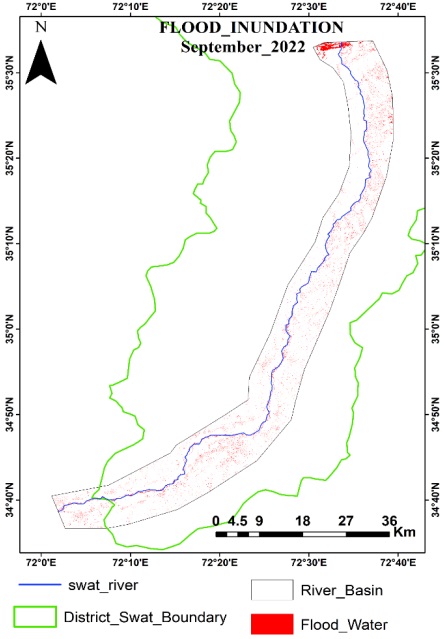
Figure 9: Sentinel-1 Flood Inundation Map for September-2002
The discussion section aims to interpret and analyze the obtained results in relation to
the research question and objectives. The primary objective of the study was to assess the
effectiveness of using Sentinel-1 and Sentinel-2 data for flood monitoring and mapping, specifically focusing on the accuracy and reliability of these remote sensing techniques in
identifying flood inundation areas. The analysis was conducted using water indices, including
NDWI and WRI, to extract floodwater areas and generate flood inundation maps. The selection
of images with low cloud cover was crucial to ensure high-quality and cloud-free imagery for
accurate flood extent estimation. The strategy of selecting days with minimal cloud cover based
on historical patterns and climatic conditions specific to the study area aimed to minimize
misclassification and ambiguity in identifying flooded areas. By minimizing the impact of cloud
cover, the research aimed to enhance the precision and quality of the derived flood extent maps,
enabling more robust flood monitoring and management. The results obtained from the NDWI
analysis for July 2022 revealed important insights into the extent and intensity of flooding in the
study area. The images captured on 17th July and 27th July showed a progressive intensification
of the flood event, with a larger area being affected by floodwaters on 27th July. The identified
areas of Charbagh, Mangora, Saidu Sharif, and Chakdara consistently showed high vulnerability
to flooding, indicating the need for focused flood management and mitigation measures in these
regions.
Moving to the analysis of the NDWI images for August 2022, the results demonstrated
the temporal variation and spatial distribution of floodwater extent. The images captured on 5th
August, 13th August, and 28th August provided valuable insights into the increasing water extent
and the most affected areas. The analysis showed that Mangora and Saidu Sharif remained highly
affected throughout the month, while the flood extent expanded to other areas such as
Charbagh, Manglor, Barikot, and Chakdara. The progressive increase in the extent and intensity
of the floodwaters emphasized the need for targeted flood mitigation measures in these areas.
In September 2022, the post-flood period, the analysis of NDWI images on 6th September and
16th September indicated the persistence of floodwaters in certain areas. Mangora, Saidu Sharif,
and some parts of Manglor were still affected, suggesting the slower drainage and accumulation
of water in regions with less sloping terrain. The findings highlighted the effectiveness of the
NDWI index in identifying water presence, even in the post-flood stage, but acknowledged the
influence of cloud cover and other factors on the accuracy and interpretation of the results. The
results obtained from the WRI analysis complemented the findings from the NDWI analysis,
providing additional insights into the water distribution and variability. The WRI index showed
a higher water extent compared to the NDWI index, indicating its effectiveness in capturing the
spatial dynamics of floodwaters. The agreement between the affected areas identified by both
indices further supported their reliability for flood mapping and water extent analysis.
The flood inundation maps generated from Sentinel-1 data using IW and VH
polarization bands provided additional insights into the spatial distribution of floodwaters. The
analysis revealed significant flood extents in July, August, and September 2022, with highaltitude areas such as Kalam, Bahrain, and Madyan experiencing the highest flood levels. The
integration of Sentinel-1 data enhanced the accuracy and reliability of the flood extent
assessment, particularly in challenging conditions such as high cloud cover or dense vegetation.
In conclusion, the results obtained from the analysis of Sentinel-2 and Sentinel-1 data using
NDWI, WRI, and flood inundation mapping techniques provided valuable information on the
extent, intensity, and spatial distribution of floodwaters in the study area. The findings
demonstrated the effectiveness of remote sensing techniques in flood monitoring and mapping,
allowing for better-informed decision-making processes related to emergency response, resource
allocation, and long-term flood mitigation strategies. The study highlighted the importance of
considering multiple indices and satellite data sources for a comprehensive understanding of
flood dynamics, while acknowledging the influence of cloud cover and other factors on the
accuracy of the results.
Conclusion
This research aimed to assess the effectiveness ofSentinel-1 and Sentinel-2 data for flood
monitoring and mapping. Through the application of water indices such as NDWI and WRI,
combined with the analysis of flood inundation maps, generated from Sentinel-1 data, valuable
insights into the spatial distribution and extent of floodwaters were obtained. The results of the
study indicated that both Sentinel-1 and Sentinel-2 data are reliable and effective sources for
flood monitoring and mapping. The NDWI and WRI indices derived from Sentinel-2 data
successfully identified and mapped flood-affected areas, providing valuable information on the
extent and intensity of flooding events. The inclusion of Sentinel-1 data enhanced the accuracy
and reliability of the flood extent assessments, particularly in challenging conditions such as high
cloud cover or dense vegetation.
The analysis of the flood extent maps revealed specific areas that are highly vulnerable
to intense flooding. Regions such as Kalam, Bahrain, Madyan, Mangora, Saidu Sharif, and
Barikot consistently experienced significant flood extents, indicating the need for focused flood
management and mitigation measures in these areas. The topographical characteristics of steep
terrain, narrow valleys, and high rainfall intensity contribute to the heightened flood risk in these
regions. The findings from this research contribute to a better understanding of flood dynamics
and their impacts on the study area. The integration of multiple indices and satellite data sets
allows for a comprehensive assessment of flood events, enabling informed decision-making
processes for emergency response planning, resource allocation, and the implementation of
effective flood mitigation strategies.
Reference
[1] R. Sivanpillai, K. M. Jacobs, C. M. Mattilio, and E. V Piskorski, “Rapid flood inundation
mapping by differencing water indices from pre- and post-flood Landsat images,” Front.
Earth Sci., vol. 15, no. 1, pp. 1–11, 2021, doi: 10.1007/s11707-020-0818-0.
[2] P. Zhang et al., “Hydrodynamic and Inundation Modeling of China’s Largest Freshwater
Lake Aided by Remote Sensing Data,” Remote Sens., vol. 7, no. 4, pp. 4858–4879, 2015,
doi: 10.3390/rs70404858.
[3] B. Khalid et al., “Riverine flood assessment in Jhang district in connection with ENSO
and summer monsoon rainfall over Upper Indus Basin for 2010,” Nat. Hazards, vol. 92,
no. 2, pp. 971–993, 2018, doi: 10.1007/s11069-018-3234-y.
[4] A. Refice et al., “SAR and InSAR for flood monitoring: Examples with
COSMO/SkyMed data,” Sel. Top. Appl. Earth Obs. Remote Sensing, IEEE J., vol. 7,
2014, doi: 10.1109/JSTARS.2014.2305165.
[5] N. W. Arnell and S. N. Gosling, “The impacts of climate change on river flood risk at
the global scale,” Clim. Change, vol. 134, no. 3, pp. 387–401, 2016, doi: 10.1007/s10584-
014-1084-5.
[6] S. M. El-Hadidy and S. M. Morsy, “Expected spatio-temporal variation of groundwater
deficit by integrating groundwater modeling, remote sensing, and GIS techniques,”
Egypt. J. Remote Sens. Sp. Sci., vol. 25, no. 1, pp. 97–111, 2022, doi:
https://doi.org/10.1016/j.ejrs.2022.01.001.
[7] D. S. Williams, M. Máñez Costa, L. Celliers, and C. Sutherland, “Informal Settlements
and Flooding: Identifying Strengths and Weaknesses in Local Governance for Water
Management,” Water, vol. 10, no. 7, 2018, doi: 10.3390/w10070871.
[8] L. Tascón-González, M. Ferrer-Julià, M. Ruiz, and E. García-Meléndez, “Social
Vulnerability Assessment for Flood Risk Analysis,” Water, vol. 12, no. 2. 2020. doi:
10.3390/w12020558.
[9] K. Uddin, M. A. Matin, and F. J. Meyer, “Operational Flood Mapping Using MultiTemporal Sentinel-1 SAR Images: A Case Study from Bangladesh,” Remote Sens., vol 11, no. 13, 2019, doi: 10.3390/rs11131581.
[10] V. Scotti, M. Giannini, and F. Cioffi, “Enhanced flood mapping using synthetic aperture
radar (SAR) images, hydraulic modelling, and social media: A case study of Hurricane
Harvey (Houston, TX),” J. Flood Risk Manag., vol. 13, no. 4, p. e12647, Dec. 2020, doi:
10.1111/JFR3.12647.
[11] C. Șerban, C. Maftei, and G. Dobrică, “Surface Water Change Detection via Water
Indices and Predictive Modeling Using Remote Sensing Imagery: A Case Study of
Nuntasi-Tuzla Lake, Romania,” Water 2022, Vol. 14, Page 556, vol. 14, no. 4, p. 556,
Feb. 2022, doi: 10.3390/W14040556.
[12] R. O. Salami, J. K. von Meding, and H. Giggins, “Vulnerability of human settlements to
flood risk in the core area of Ibadan metropolis, Nigeria.,” Jamba (Potchefstroom,
South Africa), vol. 9, no. 1, p. 371, 2017, doi: 10.4102/jamba.v9i1.371.
[13] J. Serrano, S. Shahidian, and J. M. da Silva, “Evaluation of Normalized Difference Water
Index as a Tool for Monitoring Pasture Seasonal and Inter-Annual Variability in a
Mediterranean Agro-Silvo-Pastoral System,” Water 2019, Vol. 11, Page 62, vol. 11, no.
1, p. 62, Jan. 2019, doi: 10.3390/W11010062.
[14] Q. Shenming, L. Xiang, and G. Zhihua, “A new hyperspectral image classification
method based on spatial-spectral features,” Sci. Reports 2022 121, vol. 12, no. 1, pp. 1–
16, Jan. 2022, doi: 10.1038/s41598-022-05422-5.
[15] A. Rahadiati, M. Munawaroh, and E. Suryanegara, “The Impact of Flooding on
Settlement Along the Jangkok River Mataram, Indonesia,” IOP Conf. Ser. Earth
Environ. Sci., vol. 750, p. 12003, 2021, doi: 10.1088/1755-1315/750/1/012003.
[16] Q. Sholihah, W. Kuncoro, S. Wahyuni, S. Puni Suwandi, and E. Dwi Feditasari, “The
analysis of the causes of flood disasters and their impacts in the perspective of
environmental law,” IOP Conf. Ser. Earth Environ. Sci., vol. 437, no. 1, p. 012056, Feb.
2020, doi: 10.1088/1755-1315/437/1/012056.
[17] R. Sivanpillai, K. M. Jacobs, C. M. Mattilio, and E. V. Piskorski, “Rapid flood inundation
mapping by differencing water indices from pre- and post-flood Landsat images,” Front.
Earth Sci., vol. 15, no. 1, pp. 1–11, Mar. 2021, doi: 10.1007/S11707-020-0818-
0/METRICS.
[18] Syam’Ani, “Capability of Sentinel-1 Synthetic Aperture Radar polarimetric change
detection for burned area extraction in South Kalimantan, Indonesia,” IOP Conf. Ser.
Earth Environ. Sci., vol. 500, no. 1, p. 012004, Jun. 2020, doi: 10.1088/1755-
1315/500/1/012004.
[19] C. W. J. Tay, S. H. Yun, S. T. Chin, A. Bhardwaj, J. Jung, and E. M. Hill, “Rapid flood
and damage mapping using synthetic aperture radar in response to Typhoon Hagibis,
Japan,” Sci. Data 2020 71, vol. 7, no. 1, pp. 1–9, Mar. 2020, doi: 10.1038/s41597-020-
0443-5.
[20] A. Sharifi, H. Mahdipour, E. Moradi, and A. Tariq, “Agricultural Field Extraction with
Deep Learning Algorithm and Satellite Imagery,” J. Indian Soc. Remote Sens., vol. 50,
no. 2, pp. 417–423, Feb. 2022, doi: 10.1007/S12524-021-01475-7/METRICS.
[21] K. Uddin, M. A. Matin, and F. J. Meyer, “Operational Flood Mapping Using MultiTemporal Sentinel-1 SAR Images: A Case Study from Bangladesh,” Remote Sens. 2019,
Vol. 11, Page 1581, vol. 11, no. 13, p. 1581, Jul. 2019, doi: 10.3390/RS11131581.
[22] A. Verhegghen et al., “The Potential of Sentinel Satellites for Burnt Area Mapping and
Monitoring in the Congo Basin Forests,” Remote Sens. 2016, Vol. 8, Page 986, vol. 8,
no. 12, p. 986, Nov. 2016, doi: 10.3390/RS8120986.
[23] W. Nigel, “Integrated river basin management: A case for collaboration,” Int. J. River
Basin Manag., vol. 2, no. 4, pp. 243–257, 2004, doi: 10.1080/15715124.2004.9635235.
[24] H. Waqas et al., “Flash Flood Susceptibility Assessment and Zonation Using an
Integrating Analytic Hierarchy Process and Frequency Ratio Model for the Chitral
District, Khyber Pakhtunkhwa, Pakistan,” Water 2021, Vol. 13, Page 1650, vol. 13, no.
12, p. 1650, Jun. 2021, doi: 10.3390/W13121650.
[25] D. S. Williams, M. M. Costa, L. Celliers, and C. Sutherland, “Informal Settlements and
Flooding: Identifying Strengths and Weaknesses in Local Governance for Water
Management,” Water 2018, Vol. 10, Page 871, vol. 10, no. 7, p. 871, Jun. 2018, doi:
10.3390/W10070871.
