Findings of the DEM analysis conducted in our designated study area indicate a
notable variation in elevation, encompassing a range of 677 meters to 6,000 meters above the
mean sea level (Figure 2). The considerable range in land elevation plays a pivotal role in the
consideration and implementation of dam selection and construction. The DEM data offers
valuable insights into the topographical attributes of the area, facilitating a comprehensive
evaluation of the appropriateness of potential dam locations.
The comprehension of the elevation profile of the study area is crucial in the process
of dam selection. Dams are commonly built in river valleys or canyons, and the utilization of
elevation data aids in the identification of appropriate sites where the natural topography aligns
with the engineering specifications for dam establishment. The presence of diverse elevation
values in the study area enables us to evaluate the viability of various dam types, such as smallscale reservoirs in areas with low elevation or high-head dams in mountainous terrains.
Rainfall Datasets:
In the context of our study on dam selection, we utilized mean annual rainfall data
collected from multiple weather stations to create a comprehensive rainfall map for the Swat
district. The rainfall values across the entire study area were estimated and interpolated using
the IDW interpolation technique. The procedure enabled the development of comprehensive
rainfall cartography, which effectively illustrates the geographical dispersion of yearly
precipitation. The distribution of annual rainfall values across the Swat district is visually
depicted in Figure 3, showcasing a range that extends from a minimum of 690 mm to a
maximum of 994 mm. The map successfully conveys the diversity in yearly precipitation,
providing valuable insights into the differential rainfall patterns experienced across different
locations within the study area. The provided information holds significant importance in our
dam selection process, as it aids in the identification of potential dam sites by considering both
technical feasibility and the accessibility of water resources. An essential aspect in the
optimization of dam design and operation for various purposes, such as water supply, flood
control, and hydropower generation, is the comprehension of local rainfall patterns. This understanding ensures that the chosen dam sites are in alignment with the hydrological
conditions and land management objectives of the region, thereby promoting harmonious
integration.

Figure 3: Elevation profile of the study area
Land use Land Cover:
Figure 4 depicts a visual representation of the LULC classification in the Swat region.
The classification system demonstrates a high level of efficacy in effectively organizing the
landscape into seven discrete categories, each of which provides valuable and distinct
perspectives on the land utilization patterns within the given region. The classes that have
been identified include bare land, built-up areas, water bodies, natural trees, cropland, snow,
and grassland. The presented figure effectively illustrates the spatial distribution of the
categories, highlighting their relative proportions within the designated study region. It is
worth mentioning that the Swat region consists of various land cover categories. Specifically,
bare land accounts for 12% of the region, while built-up areas occupy 11%. Water bodies
comprise 1% of the region, while natural trees flourish across 16%. Cropland constitutes 3%
of the region, and snow is observed on 1% of the land. Notably, the dominant land cover
category in the Swat region is grassland, encompassing a significant 43% of the entire area.
The comprehensive LULC classification holds significant significance in the context
of our dam selection process. The utilization of remote sensing techniques facilitates the
identification of appropriate dam sites by offering essential information regarding the land
cover attributes of the area. Comprehending the distribution of LULC categories holds
significant importance in evaluating various factors, including land availability, potential
environmental consequences, and the appropriateness of the adjacent topography for the
construction and functioning of dams. Furthermore, it aids in the assessment of the
prospective consequences on indigenous ecosystems and habitats, guaranteeing that the chosen locations for dam construction are in accordance with sustainable land management
goals. The LULC classification plays a fundamental role in the optimization of dam selection,
encompassing technical feasibility and environmental factors.
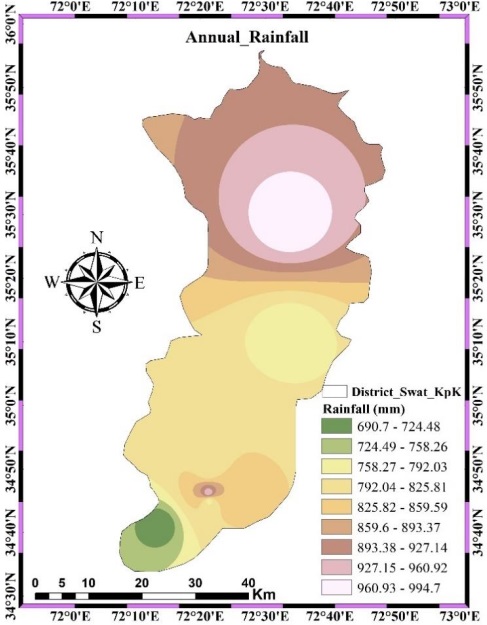
Figure 4: Mean annual rainfall for the study area.

Figure 5: LULC for the study area
The evaluation of the accuracy of the land cover classification was performed by
employing the Kappa coefficient as a standard measure. By utilizing the SVM algorithm in the
classification procedure, an impressive overall accuracy rate of 89% was attained. The
observed high level of accuracy demonstrates a strong concurrence between the classified
pixels and the ground truth samples, thereby validating the reliability of our classification
outcomes. In addition, it is worth noting that the Kappa coefficient, which goes beyond
random agreement, demonstrates a significant value of 0.87. The high value of the Kappa
coefficient provides strong support for the accuracy of our classification results and increases
confidence in the methodology used.
Soil Analysis:
Distinct colors have been employed in our map to visually depict the various soil types
that are prevalent in the Swat district. Gleysol soils are characterized by a black coloration,
lithosol soils are distinguished by a red coloration, and eutric cambisol soils are identified by a
green coloration. The various soil types are significant in the process of selecting an
appropriate dam site. The selection of a dam site is heavily influenced by soil characteristics,
as the diverse types of soil possess distinct capacities to sustain dam infrastructure and
efficiently regulate water resources. Gleysol soils, characterized by their dark color, frequently
signify elevated levels of moisture and necessitate specific precautions during dam
construction to ensure structural integrity and mitigate seepage. Lithosol soils, illustrated in
red, are commonly characterized by their shallow depth and rocky composition, thereby
exerting potential implications on the design of dam foundations and excavation endeavors. Eutric Cambisol soils, depicted in green, are commonly regarded as highly suitable for the
construction of dams owing to their advantageous characteristics that facilitate strong
foundation support (Figure 5).
A comprehensive understanding of the distribution and characteristics of these soil
types within the Swat district plays a crucial role in the identification of appropriate dam
locations that possess both technical viability and enduring stability. A thorough examination
of soil properties is imperative for minimizing potential hazards and maximizing the
effectiveness of dam design and construction, particularly about water supply, flood
management, and hydropower production.

Figure 6: Soil types in SWAT
Elevation Area Capacity Curve:
The EAC Curve is a visual depiction that elucidates the correlation between the
elevation of a reservoir's water surface, the corresponding storage volume of water contained
in the reservoir, and the area encompassed by the reservoir at that elevation. The curve serves
as a pivotal instrument for evaluating the viability of dam locations and comprehending the
variations in reservoir storage capacity resulting from fluctuations in water level caused by
inflow, outflow, and additional factors. In the present study, a total of five distinct potential
dam sites, denoted as R1, R2, R3, R4, and R5, have been identified and are visually represented
in Figure 6. The chosen sites within the study area are strategically positioned, with their
selection being influenced by a range of factors such as topography, hydrology, geology, and
land use. The EAC Curve plays a crucial role in assessing the appropriateness of these locations
for the purpose of constructing dams.
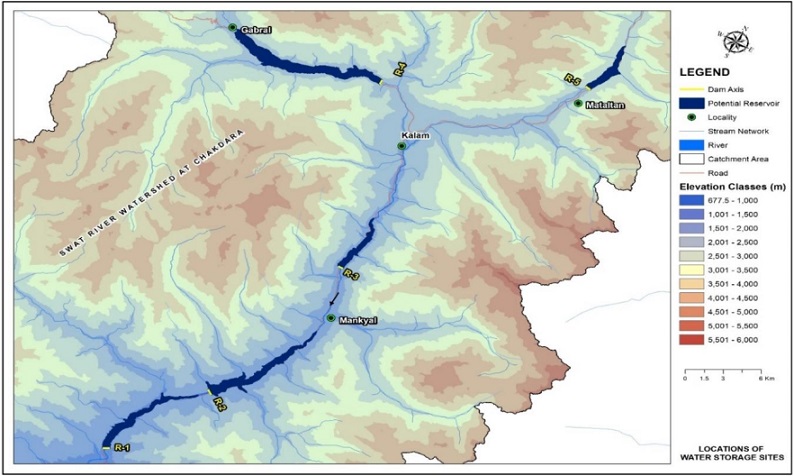
Figure 7: Potential Dam Sites for the study area
Characteristic of Dam Site R1:
Table 1 provides a comprehensive overview of the characteristics of dam reservoirs at
different elevations. The data presented in this study was obtained using accurate calculations
employing the 3D analyst tool applied to the DEM. The presented table illustrates the
relationship between the elevation of a reservoir, measured in meters above sea level, and the
corresponding alterations in both surface area and storage capacity. As an illustration, situated
at an altitude of 1345m above sea level, the reservoir encompasses an expanse of 9.40 x1000
m² and exhibits a storage capacity of 10.62 m³. Significantly, a rise in altitude from 1345 to
1450ms above sea level results in a considerable enlargement of the reservoir's surface area,
which expands to 3271 x 1000m², accompanied by a noteworthy augmentation in storage
capacity to 121,346 m³. The dataset presented provides significant insights into the direct
influence of various elevations on the physical attributes of the reservoir. These findings can
greatly contribute to informed decision-making processes regarding the planning, design, and
operation of dams.
Figure 7 visually depicts the significant correlation between elevation and the
corresponding area and storage capacity of the dam reservoir. The presented graphical
representation offers a conscious and intuitive comprehension of the impact of variations in
elevation on the physical characteristics of the reservoir. The provided figure visually illustrates
the gradual increase in both the area and capacity of the reservoir as its elevation increases.
For example, it demonstrates the substantial increase in both surface area and storage capacity
that occurs when raising the reservoir's elevation from 1345 to 1450 m above sea level. This
visual aid facilitates the understanding of the direct correlation between elevation and reservoir
characteristics, thereby assisting in the decision-making process for dam design and
management.
Table 1: Reservoir characteristics at dam site R1 (Elevation vs. Area and Volume)
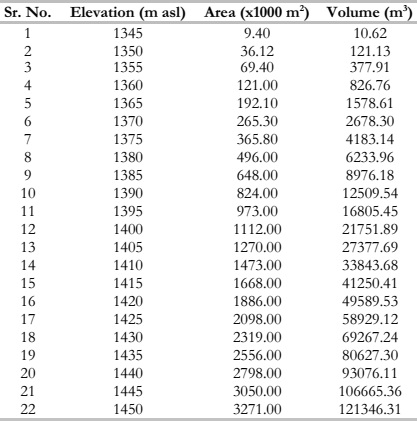

Figure 8: Correlation between elevation, area, and storage capacity for DAM site R1
Characteristic of Dam Site R2:
Table 2 and Figure 8 provide essential data pertaining to the reservoir characteristics
of dam site R2 at different elevations. As an illustration, the reservoir demonstrates an
elevation of 1455m above sea level, encompassing an area of 2.91 thousand square meters and
possessing a storage capacity of 2 m3. Significantly, when the elevation is raised to 1625m
above sea level, there is a noteworthy increase in both the area and storage capacity of the
reservoir. Specifically, the reservoir's area expands to 4321x1000 m2, while its storage capacity
experiences a substantial growth to 271,964 m3. These insights play a crucial role in facilitating
well-informed decision-making concerning the planning, design, and management of dam site
R2. They emphasize the direct impact of elevation variations on the physical attributes of the
reservoir.
Table 2: Reservoir characteristics at dam site R2 (Elevation vs. Area and Volume)

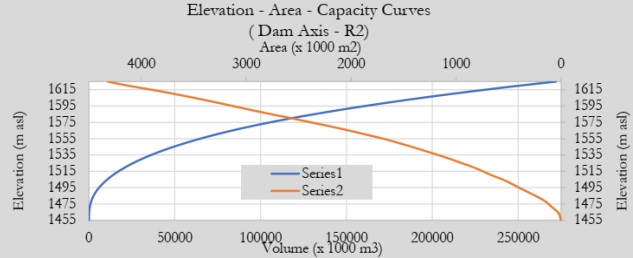
Figure 9: Correlation between elevation, area, and storage capacity for DAM site R2
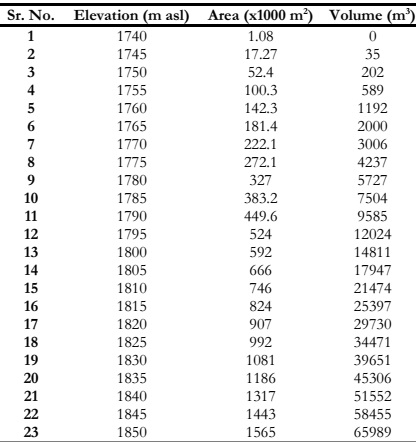
Characteristics of Dam Site R3:
Table 3 and Figure 9 offer significant insights pertaining to the reservoir characteristics
of dam site R3 across various elevations. The data play a crucial role in facilitating wellinformed decision-making processes pertaining to the planning, design, and management of
the site in question. The reservoir, situated at an altitude of 1740m above sea level, demonstrates an area of 1.08 x 1000 m2 and a storage capacity, suggesting a restricted ability
to retain water at this elevation. Nevertheless, when the elevation is raised to 1745m, a
significant transformation occurs. The area of the reservoir experiences a substantial increase,
reaching 17.27 x 1000 m2, while its storage capacity also undergoes growth, reaching 35 m3.
Notably, situated at an altitude of 1850 m above sea level, the reservoir exhibits a vast expanse
spanning 1565 x 1000 m2, accompanied by a noteworthy storage capacity of around 65,989
m3.
Table 3: Reservoir characteristics at dam site R3 (Elevation vs. Area and Volume)
Characteristics of Dam Site R4:
The role of elevation variations at dam site R4 is of great significance in determining
the characteristics of the reservoir, as demonstrated in Table 4 and Figure 10. The
comprehensive records offer a dynamic viewpoint on the reservoir's response to changes in
elevation. Beginning at an elevation of 2080m above sea level, the reservoir does not possess
any surface area or capacity for storing water. Nevertheless, as the altitude gradually increases
to 2085 m, a significant alteration takes place, characterized by the expansion of the reservoir's
surface area to 6.98 x 1000 m2 and an augmented storage capacity of 10 m3. Upon reaching an
elevation of 2200 m above sea level, the reservoir experiences an expansion in its surface area,
reaching a total of 1611 x 1000 m2. This expansion is accompanied by a significant increase in
the reservoir's storage capacity, which now amounts to 67,807 m3. The culmination of this
metamorphosis is witnessed at an altitude of 2275 m above the Earth's sea level, where the
dam site R4 reaches its utmost characteristics a substantial expanse of 7510 x 1000m2 and a
remarkable capacity for storing 358,237 m3.

Figure 10: Correlation between elevation, area, and storage capacity for DAM site R3
The results of this study emphasize the significant impact of changes in elevation on
the physical characteristics of the reservoir, highlighting the crucial significance of this
information in making well-informed decisions regarding the planning and management of
dam site R4.

Figure 11: Correlation between elevation, area, and storage capacity for DAM site R4
Table 4: Reservoir characteristics at dam site R4 (Elevation vs. Area and Volume)

Characteristics of Dam Site R4:
Dam site R5, with an elevation of 2395m above sea level, at first appears to have
neither an area coverage nor a capacity indicated by Figure 11 and Table 5. On the other hand,
significant shifts take place when it reaches its highest elevation of 2500m above sea level. The
storage capacity of the reservoir reaches 76,313 m3, and the area of the reservoir grows to be
1874 x 10000 m2. These data highlight the direct relationship between elevation and the
physical attributes of the reservoir at dam site R5, providing essential insights for the decisions
regarding site planning and management.
Table 5: Reservoir characteristics at dam site R5(Elevation vs. Area and Volume)

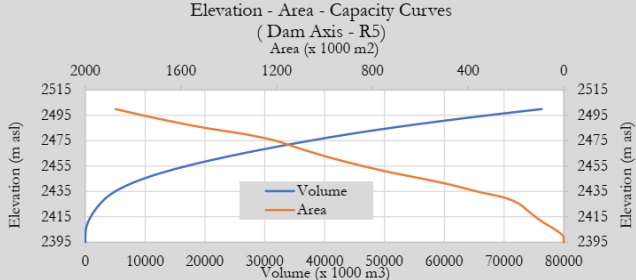
Figure 12: Correlation between elevation, area, and storage capacity for DAM site R5
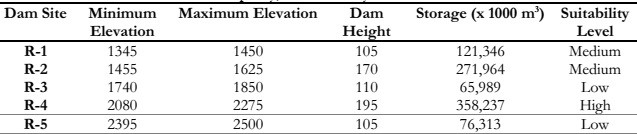
Comparison of Potential Dam Sites:
The comparison table (Table 6) offers a detailed assessment of five distinct dam sites
(R-1 through R-5), highlighting their suitability and potential for dam construction. Among
these sites, R-4 stands out as the most promising option. It boasts a wide elevation range from
2080 to 2275 m, resulting in a substantial dam height potential. What sets R-4 apart is its
remarkable storage capacity of 358,237,000 m3, categorizing it as having a "High" suitability
level. This site is exceptionally well-suited for multiple water resource management objectives,
including hydropower generation and flood control, making it the preferred choice among the
options presented. In contrast, the other sites (R-1, R-2, R-3, and R-5) exhibit narrower
elevation ranges and comparatively lower storage capacities, indicating varying degrees of
suitability for specific purposes.
Table 6: Comparison of dam sites (R-1 to R-5) based on elevation, dam Height, storage capacity, and suitability levels
Discussion:
The strategic placement of small dams in the Swat District, Pakistan, as identified in
this study, signifies a pivotal step toward addressing the region's pressing water and energy
challenges. The comprehensive analysis undertaken here melds technical precision, societal
considerations, and environmental consciousness to chart a course for sustainable resource
management. By leveraging advanced technologies such as RS and GIS, and combining these with expert knowledge, we meticulously examined the region's land use, soil profiles, and
precipitation trends.
The foundation of our analysis rested on the adept integration of diverse datasets,
meticulously woven together to create a robust decision-making framework. Through the
application of the priority index statistical method, we identified five distinct locations, each
varying in suitability, for the construction of small dams. Among these, R-1 and R-2 emerged
as sites with medium suitability, holding promise for meeting local water and energy demands
efficiently. R-4, characterized by its high suitability, stands out as a leading candidate for
optimized water resource utilization.

Figure 13: Dam axis profile showing crest level at 1625 m ASL.
The significance of these findings is underscored by the visual representation provided
in Figure 6, which serves as a guiding map for efficient water management in the region. This
map, highlighting top locations for small dam construction, offers clear directives for future
endeavors in water resource management. Looking forward, the implementation of these
identified sites bears the potential to usher in a new era for the Swat District. Through the
amalgamation of engineering expertise, active community involvement, and ecological
sensitivity, these small dams are poised not only to fulfill their immediate purpose but also to
foster regional growth and resilience. By empowering local communities and promoting
sustainable change, the construction of small dams in Pakistan's Swat District emerges as a
catalyst for transformative progress.
In light of these results, it is imperative for government bodies and policymakers to
heed the insights provided by this study. The identified sites offer a tangible course of action,
balancing the necessities of water and energy demands with the inherent opportunities present
in the region. The successful realization of these small dams hinges not only on their
construction but also on the ongoing commitment to ecological preservation and community
engagement. Therefore, it is recommended that future initiatives prioritize these aspects,
ensuring that the potential benefits of these small dams are maximized for the betterment of
the Swat District and its inhabitants.
Conclusion
The strategic placement of small dams offers a glimmer of hope for our region to meet
the evolving demands of our water and energy systems as we stand at the crossroads of
escalating water and energy challenges. The beautiful landscape of Swat District, Pakistan is
ripe with potential sites for multi-purpose small dams, and this study has been instrumental in
charting the course, identifying, and assessing those sites. We take a comprehensive view of
resource management by carefully balancing technical requirements, societal and economic
factors, and a firm dedication to protecting the natural world. The wise application of a diverse array of data sources formed the basis of our decision-making process. To decipher the
complexities of the Swat District's land use and land cover map, soil profiles, and precipitation
trends, we employed cutting-edge technology and expert knowledge. These masterfully woven
datasets were the bedrock upon which we based our site selection voyage. We used the
precision of a statistical method called the priority index to guide the use of RS and GIS
technologies to uncover these promising locations. Because of this method, water resource
managers and decision-makers now have a detailed suitability map at their disposal. Based on
the outcomes of this exhaustive assessment, five distinct geographical sites displaying diverse
levels of suitability have surfaced. Notably, locations R-1 and R-2 exhibit a moderate level of
appropriateness, suggesting their potential efficacy in satisfying local water and energy
requisites. Due to its high suitability, R-4 is a leading candidate for efficient use of water
resources. Low suitability, on the other hand, creates opportunities that strike a fine balance
between protecting the environment and making the most of the resources at hand in regions
R-3 and R-5.
Figure 6 map serves as a visual record of our efforts that highlights the top and
topnotch locations to build small dams, providing clear instructions for efficient water
management. Concluding our research, these five small dams, characterized by their individual
suitability profiles, hold the promise of efficiently mitigating the water and energy challenges
confronting the Swat District. The future is bright, thanks to engineering prowess, community
participation, and ecological sensitivity, and it will guarantee that these small dams not only
serve their immediate purpose but also contribute to the growth and resilience of the region.
Building small dams in Pakistan's Swat District is central to empowering local communities
and facilitating change. The findings of the study illuminate the path forward for government
officials and policymakers, providing a roadmap that strikes a balance between essential
requirements and available opportunities.
Conflicts of Interest: The authors declare no conflict of interest.
Ethical approval: All authors have read, understood, and have complied as applicable with
the statement on "Ethical responsibilities of Authors" as found in the Instructions for Authors
and are aware that with minor exceptions, no changes can be made to authorship once the
paper is submitted
Competing interests: The authors declare no competing interests.
Reference
[1] T. Kumar and D. Jhariya, “Identification of Rainwater Harvesting Sites using SCS-CN
Methodology, Remote Sensing and Geographical Information System Techniques,”
Geocarto Int., vol. 32, pp. 1–43, 2016, doi: 10.1080/10106049.2016.1213772.
[2] R. Agarwal, P. Garg, and R. Garg, “Remote Sensing and GIS Based Approach for
Identification of Artificial Recharge Sites,” Water Resour. Manag., vol. 27, 2013, doi:
10.1007/s11269-013-0310-7.
[3] J. Krois and A. Schulte, “GIS-based multi-criteria evaluation to identify potential sites
for soil and water conservation techniques in the Ronquillo watershed, northern Peru,”
Appl. Geogr., vol. 51, pp. 131–142, 2014, doi:
https://doi.org/10.1016/j.apgeog.2014.04.006.
[4] E. Blanc and E. Strobl, “Is Small Better? A Comparison of the Effect of Large and
Small Dams on Cropland Productivity in South Africa,” World Bank Econ. Rev., vol.
28, no. 3, pp. 545–576, 2014, doi: 10.1093/wber/lht026.
[5] G. Mugo and P. Odera, “Site selection for rainwater harvesting structures in Kiambu
County-Kenya,” Egypt. J. Remote Sens. Sp. Sci., vol. 22, pp. 155–164, 2019, doi:
10.1016/j.ejrs.2018.05.003.
[6] K. Balkhair and K. Rahman, “Development and assessment of rainwater harvesting suitability map using Analytical Hierarchy Process, GIS, and RS techniques,” Geocarto
Int., vol. 36, pp. 1–19, 2019, doi: 10.1080/10106049.2019.1608591.
[7] A. Adham, M. Riksen, R. Abed, S. Shadeed, and C. Ritsema, “Assessing Suitable
Techniques for Rainwater Harvesting Using Analytical Hierarchy Process ( AHP )
Methods and GIS Techniques,” 2022.
[8] D. Khan, A. Raziq, H. V. Young, T. Sardar, and Y. Liou, “Identifying Potential Sites
for Rainwater Harvesting Structures in Ghazi Tehsil , Khyber Pakhtunkhwa , Pakistan
, Using,” 2022.
[9] A. Hussain, “Investigating feasible sites for multi _ purpose small dams in Swat District
of Khyber Pakhtunkhwa Province , Pakistan : socioeconomic and environmental
considerations,” pp. 10852–10875, 2022, doi: 10.1007/s10668-021-01886-z.
[10] M. Kumar, A. Agarwal, and R. Bali, “Delineation of potential sites for water harvesting
structures using remote sensing and GIS,” J. Indian Soc. Remote Sens., vol. 36, pp.
323–334, 2008, doi: 10.1007/s12524-008-0033-z.
[11] T. Naseef and R. Thomas, “Identification of Suitable Sites for Water Harvesting
Structures in Kecheri River Basin,” Procedia Technol., vol. 24, pp. 7–14, 2016, doi:
10.1016/j.protcy.2016.05.003.
[12] S. Mahmoud and P. Alazba, “The potential of in situ rainwater harvesting in arid
regions: developing a methodology to identify suitable areas using GIS-based decision
support system,” Arab. J. Geosci., 2014, doi: 10.1007/s12517-014-1535-3.
[13] S. H. Mahmoud and A. A. Alazba, “The potential of in situ rainwater harvesting in arid
regions: developing a methodology to identify suitable areas using GIS-based decision
support system,” Arab. J. Geosci., vol. 8, no. 7, pp. 5167–5179, 2015, doi:
10.1007/s12517-014-1535-3.
[14] A. Adham et al., “International Soil and Water Conservation Research A GIS-based
approach for identifying potential sites for harvesting rainwater in the Western Desert
of Iraq,” Int. Soil Water Conserv. Res., vol. 6, no. 4, pp. 297–304, 2018, doi:
10.1016/j.iswcr.2018.07.003.
[15] S. H. M. X. Tang, “Monitoring prospective sites for rainwater harvesting and
stormwater management in the United Kingdom using a GIS-based decision support
system,” Environ. Earth Sci., pp. 8621–8638, 2015, doi: 10.1007/s12665-015-4026-2.
[16] A. Ochir, D. Boldbaatar, M. Zorigt, T. Solongo, and J. van Genderen, “Site selection
for water harvesting ponds using spatial multi criteria analysis in a region with
fluctuating climate,” Geocarto Int., vol. 33, pp. 1–33, 2017, doi:
10.1080/10106049.2017.1289563.
[17] M. Shahid, K. Rahman, K. Balkhair, and D. Nabi, “Impact assessment of land use and
climate changes on the variation of runoff in Margalla Hills watersheds, Pakistan,”
Arab. J. Geosci., vol. 13, 2020, doi: 10.1007/s12517-020-5231-1.
[18] K. Kochhar et al., “Is the Glass Half Empty or Half Full ? Issues in Managing Water
Challenges and Policy Instruments,” 2015.
[19] A. Hussain et al., “Observed trends and variability of seasonal and annual precipitation
in Pakistan during 1960–2016,” Int. J. Climatol., 2022, doi: 10.1002/joc.7709.
[20] M. Shahid and K. U. Rahman, “Identifying the Annual and Seasonal Trends of
Hydrological and Climatic Variables in the Indus Basin Pakistan,” Asia-Pacific J.
Atmos. Sci., vol. 57, no. 2, pp. 191–205, 2021, doi: 10.1007/s13143-020-00194-2.
[21] S. Bangash, “Socio-Economic Conditions of Post-Conflict Swat: A Critical Appraisal,”
Tigah A J. Peace Dev., vol. 2, no. December, pp. 66–79, 2012.
[22] Atta-ur-Rahman and A. N. Khan, “Analysis of flood causes and associated socioeconomic damages in the Hindukush region,” Nat. Hazards, vol. 59, no. 3, pp. 1239– 1260, Dec. 2011, doi: 10.1007/S11069-011-9830-8/METRICS.
[23] M. Qasim, K. Hubacek, M. Termansen, and L. Fleskens, “Modelling land use change
across elevation gradients in district Swat, Pakistan,” Reg. Environ. Chang., vol. 13, no.
3, pp. 567–581, 2013, doi: 10.1007/s10113-012-0395-1.
[24] A. Zamani, A. Sharifi, S. Felegari, A. Tariq, and N. Zhao, “Agro Climatic Zoning of
Saffron Culture in Miyaneh City by Using WLC Method and Remote Sensing Data,”
Agric. 2022, Vol. 12, Page 118, vol. 12, no. 1, p. 118, Jan. 2022, doi:
10.3390/AGRICULTURE12010118.
[25] A. S. A.-A. S. A.-H. M. A.-E. M. A.-A. Tariq, “Agricultural Field Extraction with Deep
Learning Algorithm and Satellite Imagery,” J. Indian Soc. Remote Sens., vol. v. 50, no.
2, pp. 417-423–2022 v.50 no.2, 2022, doi: 10.1007/s12524-021-01475-7.
[26] H. Waqas et al., “Flash Flood Susceptibility Assessment and Zonation Using an
Integrating Analytic Hierarchy Process and Frequency Ratio Model for the Chitral
District, Khyber Pakhtunkhwa, Pakistan,” Water 2021, Vol. 13, Page 1650, vol. 13, no.
12, p. 1650, Jun. 2021, doi: 10.3390/W13121650.
[27] F. Islam et al., “Landslide susceptibility mapping (LSM) of Swat District, Hindu Kush
Himalayan region of Pakistan, using GIS-based bivariate modeling,” Front. Environ.
Sci., vol. 10, no. October, pp. 1–18, 2022, doi: 10.3389/fenvs.2022.1027423.
[28] Z. H. Dahri, B. Ahmad, J. H. Leach, and S. Ahmad, “Satellite-based snowcover
distribution and associated snowmelt runoff modeling in Swat River Basin of Pakistan,”
Proc. Pakistan Acad. Sci., vol. 48, no. 1, pp. 19–32, 2011.
[29] F. Bazzani, “Atlas of the Natural Resources Evaluation in Swat Valley , Khyber
Pakhtunkhwa , Islamic Republic of Pakistan,” no. May, 2013.
[30] S. R. Khan and S. R. Khan, “Assessing poverty-deforestation links: Evidence from
Swat, Pakistan,” Ecol. Econ., vol. 68, no. 10, pp. 2607–2618, 2009, doi:
10.1016/j.ecolecon.2009.04.018.
[31] M. S. Bacha, M. Muhammad, Z. Kılıç, and M. Nafees, “The dynamics of public
perceptions and climate change in swat valley, khyber pakhtunkhwa, Pakistan,”
Sustain., vol. 13, no. 8, pp. 1–22, 2021, doi: 10.3390/su13084464.
[32] A. Sajjad et al., “Application of Remote Sensing and GIS in Forest Cover Change in
Tehsil Barawal, District Dir, Pakistan,” Am. J. Plant Sci., vol. 06, no. 09, pp. 1501–1508,
2015, doi: 10.4236/ajps.2015.69149.
[33] T. Adugna, W. Xu, and J. Fan, “Comparison of Random Forest and Support Vector
Machine Classifiers for Regional Land Cover Mapping Using Coarse Resolution FY-
3C Images,” Remote Sens., vol. 14, no. 3, pp. 1–22, 2022, doi: 10.3390/rs14030574.
[34] K. S. Balkhair and K. Ur Rahman, “Development and assessment of rainwater
harvesting suitability map using analytical hierarchy process, GIS and RS techniques,”
Geocarto Int., vol. 36, no. 4, pp. 421–448, 2021, doi: 10.1080/10106049.2019.1608591.
[35] Z. K. Motlagh, A. Lotfi, S. Pourmanafi, S. Ahmadizadeh, and A. Soffianian, “Spatial
modeling of land-use change in a rapidly urbanizing landscape in central Iran:
integration of remote sensing, CA-Markov, and landscape metrics,” Environ. Monit.
Assess., vol. 192, no. 11, 2020, doi: 10.1007/s10661-020-08647-x.
[36] B. R. Parida and S. P. Mandal, “Polarimetric decomposition methods for LULC
mapping using ALOS L-band PolSAR data in Western parts of Mizoram, Northeast
India,” SN Appl. Sci., vol. 2, no. 6, pp. 1–15, 2020, doi: 10.1007/s42452-020-2866-1.