An overview of the procedure is described in Figure 1, while the details are expounded
in the subsequent subsections:
Data Collection:
A dataset of brain MRIs, published by Kaggle [1][2], is utilized in this study. A total of
4082 MRIs, with 2795 images are used for training and 1287 used for testing purposes. The
dataset is organized into two classes: non-tumorous (0) and tumorous (1), allowing us to perform
binary classification tasks for brain tumor detection. Figure 2 showcases sample MRI scans
depicting glioma tumors, which are among the most dangerous types of brain tumors.
Conversely, Figure 3 displays samples of non-tumor MRI scans.
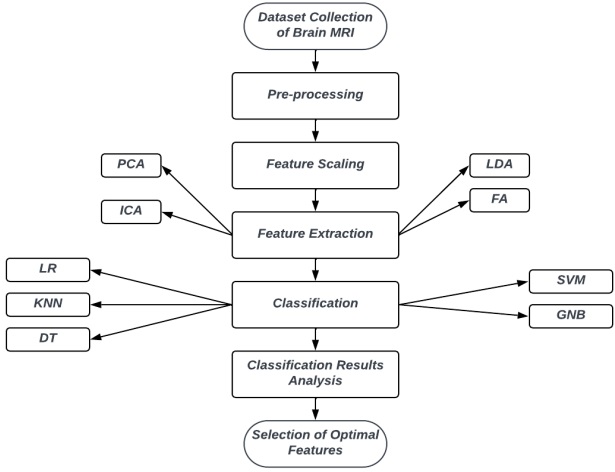
Figure 1: Block diagram of our research methodology.
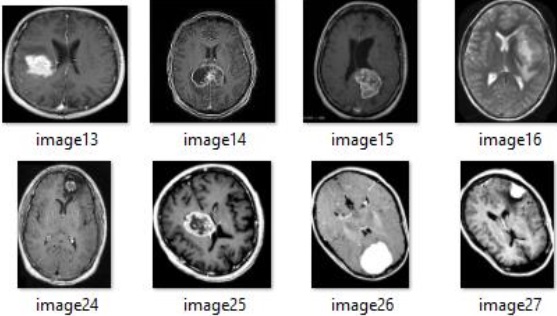
Figure 2: Samples of brain MRI scans with Glioma tumor.
Image Pre-processing:
The dataset contained images of various sizes, necessitating the resizing of all images to
a standardized dimension of 200x200 pixels. Furthermore, all images were converted to
grayscale.
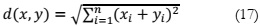
Feature Scaling:
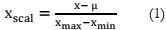
Feature scaling involves the standardization of independent variables or features within
the data. Mean normalization, in this context, is a step in which a dataset obtained from the
previous stage is processed as follows:
Feature Extraction:
Feature extraction is the procedure of converting unprocessed data into numerical
features. These numerical features are derived from the original dataset and can often yield superior results compared to the utilization of raw data in machine learning applications, as
emphasized in [11]. This research employs various feature extraction techniques, including PCA,
LDA, FA, ICA, and a combination of PCA and LDA.
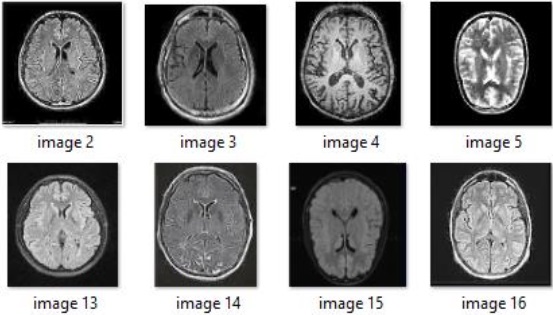
Figure 3: Samples of brain MRI scans without tumor.
Principal Component Analysis:
PCA [12] is recognized as one of the most potent feature extraction techniques. It
involves the utilization of eigenvalues from a covariance matrix to identify the corresponding
eigenvectors. This process begins by extracting the largest variance, which is added as the first
factor. Subsequently, the variance explained by the first factor is subtracted, allowing for the
extraction of the highest variance for the second component. This iterative process leads to the
final factor. PCA fundamentally converts a matrix with n features into a new dataset with fewer
than n features by extracting the most essential information from the original features. The steps
of PCA include:
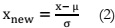
Apply equation (2) to standardize the dataset.
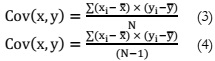
Calculation of the correlation matrix for both the population and sample using (3) and
(4) respectively.
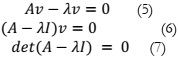
Calculation of eigenvalues and eigenvectors for the covariance matrix using (5), (6), and
(7).
1. Sorting eigenvalues based on the eigenvectors that they belong to.
2. Picking k eigenvalues from a matrix of eigenvectors.
3. Performing a transformation on the original matrix using (8).

Linear Discriminant Analysis:
In the realm of machine learning and pattern classification, LDA [13] is an essential
preprocessing step involves supervised dimensionality reduction. LDA reduce the number of
dimensions by transferring features from a higher-dimensional space to a lower-dimensional one, effectively eliminating redundant and interdependent features. To obtain linear
discriminants several sequential steps are executed.
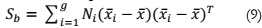
The first step involves calculating the between-class variance, representing the
separability between different classes, expressed as:
The second step is dedicated to determining the within-class variance, which quantifies
the difference between each class's mean and the individual data samples, defined as:

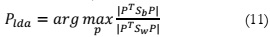
The final stage revolves around identifying the lower-dimensional space that maximizes
the variability among classes while reducing the variance within classes. This is achieved by
determining P, which represents the projection of the lower-dimensional space :
Independent Component Analysis:
ICA [14] is another dimensionality reduction approach. In ICA, data variables in the
model are linear combinations of latent variables that are not yet identified, referred to as
independent components, as they exhibit non-Gaussian characteristics and are mutually
independent. ICA serves two primary purposes: reducing information redundancy and
increasing non-Gaussianity. It plays a vital role in blind signal separation and finds numerous
real-world applications. ICA is intricately associated with the search for the fundamental data
representation. Binary ICA represents a specific variant, where both the sensors and signal
sources are binary, and the observations consist of disjunctive combinations of independent
binary sources. The mathematical representation for this is given as:

The reduction of eigenvalues in a signal's covariance matrix is essentially a process for
signal purification. The relevant mathematical equation is as follows:
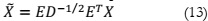
In this equation, E represents a matrix of eigenvectors, and D is a diagonal matrix of
eigenvalues. The steps involved in ICA are as follows:
1. Centering the data by subtracting the mean.
2. Applying whitening to the centered data using the mentioned technique.
3. Initializing the matrix w with random values.
4. Calculate the updated value of w.
5. Normalizing the updated value of w.
6. Returning to step 4 if the algorithm is not yet converged.
Factor Analysis:
FA [15] serves the purpose of reducing a large number of variables into a smaller, more
manageable set. It can be utilized in various tasks, including linear projection and matrix
factorization. By condensing the original variables into a reduced set referred to as factors, FA,
a linear modeling technique, seeks to capture the common variability among observed and
interconnected variables. In FA, a latent variable referred to as a factor explains the correlations
among observable variables. Each factor represents a distinct source of variation in the observed
variables. The process of factor analysis typically involves the following steps:
1. Checking the factorability of the data.
2. Determining the appropriate number of factors to retain.
3. Interpreting and understanding the meaning of the identified factors.
Training Classifiers:
A classifier is an algorithm designed to automatically categorize data into one or more
predefined sets of categories. Machine learning encompasses a variety of classifiers, and in this
research, the following classifiers are utilized, each with its respective description:
Logistic Regression:
Logistic regression, a classifier [16], is among the most commonly used machine learning
algorithms in the category of supervised learning. It is employed for predicting a categorical
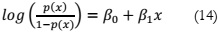
dependent variable based on a given set of independent variables. Logistic regression is
particularly useful when the objective is to forecast outcomes for a categorical dependent
variable. The expression for logistic regression is as follows:
Gaussian Naive Bays:
Naive Bayes is a probabilistic machine learning approach widely applied in various
classification tasks, built upon the foundation of Bayes' theorem [17]. An extension of Naive
Bayes known as Gaussian Naive Bayes is employed, with the Gaussian (or normal) distribution
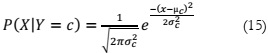
being the simplest to implement. In this approach, other functions are used to estimate data
distribution, necessitating the identification of mean and standard deviation values from the
training data. The formula for the GNB algorithm is as follows:
Support Vector Machine:
SVM, a supervised machine learning method [18], is employed for both classification
and regression tasks, although it is more commonly associated with classification. SVM operates
by partitioning data points into class attributes using a hyperplane. Each data point in this
algorithm is represented as a point in n-dimensional space defined by specific coordinate values.
The classification task involves identifying the hyperplane that effectively separates and
distinguishes between two classes. The formulation of the Lagrange SVM is expressed as:

K Nearest Neighbor:
KNN, a widely adopted supervised machine learning approach for classification tasks
[19], classifies data points based on the categorization of their nearest neighbors. The algorithm
uses a similarity index computed from previously classified instances to determine the category
of a new case. In essence, the method assesses an unknown item by examining the k closest
neighbors that share similar characteristics based on the attributes used to describe the items.
The neighbors' votes are then used to determine the classification. The mathematical
formulation of KNN is as follows:
Decision Tree:
DT is utilized for both classification and regression tasks [20]. In classification, it is
structured as tree-like models with discrete values for the target variable. DT employ diverse
criteria to determine whether a node should be split into two or more sub-nodes. The creation
of additional sub-nodes leads to an increase in their homogeneity or purity, with a focus on the
desired parameter. In the context of binary classification, where there are two classes in the
output, the first step involves calculating the probability of each class in the output (P(y+) and
P(y-)), followed by:

Evaluation Metrics:
In evaluating the performance of the model, four parameters are employed, namely
accuracy , precision , sensitivity , and Dice. Accuracy is the most commonly used metric for
assessing binary classification problems [21]. It is calculated as the percentage of correct
predictions out of the total outcomes and can be computed as (19). Precision, on the other hand,
quantifies how precise the classifier is in detecting true positive results and is given as (20).
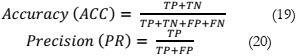
Sensitivity, as defined in (21), represents the rate of positive predictions. The F1 score,
expressed as (22), is a weighted harmonic average of precision and recall, with values ranging
between 0 and 1.
Result
Experiments and Results:
In this study, several experiments are performed on brain MRI scans, and the obtained
results are thoroughly analyzed. The primary aim of these analyses is to identify the optimal
feature extraction and classification techniques for accurately detecting brain tumors from MRI
images.
Performance Evaluation of Feature Extraction Methods:
After conducting experiments involving various feature extraction techniques in
combination with different classifiers, it became evident that the performance of these
techniques varies depending on the choice of classifier, resulting in different accuracy levels.
Notably, in our experimental evaluation, we observed that PCA, ICA, and FA, when used with
their default feature counts, did not yield satisfactory performance. To address this issue, we
decided to apply PCA, FA, and ICA with different feature counts: 50, 100, 200, 250, and 300.
Subsequently, we subjected all the classifiers to evaluation using the aforementioned sets of
extracted features. The results of these evaluations are detailed below, and they serve as the basis
for selecting the optimal feature extraction technique.
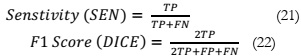
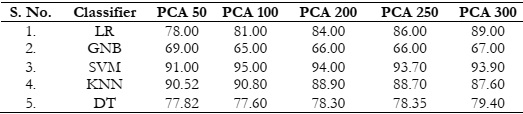
Results Comparison by Utilizing PCA:
The evaluation results are summarized in Table 1, revealing that the SVM and KNN
classifiers delivered satisfactory performance. However, it's worth noting that as the number of
features increased, the accuracy of SVM and KNN exhibited a declining trend, as depicted in
Figure 4 (a). In contrast, logistic regression demonstrated an increase in accuracy with the
growing number of features. It's important to highlight that not all classifiers were able to meet
our anticipated accuracy criteria,
Table 1: Accuracy (%) comparison of classifiers using PCA.
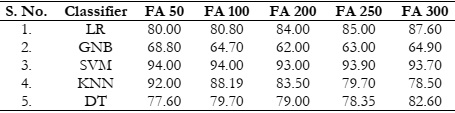
Results Comparison by Utilizing FA:
The utilization of FA with varying feature counts consistently resulted in favorable accuracy
levels, particularly when applied in conjunction with SVM and KNN classifiers, as depicted in
Figure 5 (a). It has the same issue, LR and GNB did not perform well in this scenario. Only
SVM and KNN achieved the expected accuracy as shown in Figure 5 (b). The overall results
comparison with FA is depicted in Table 2.
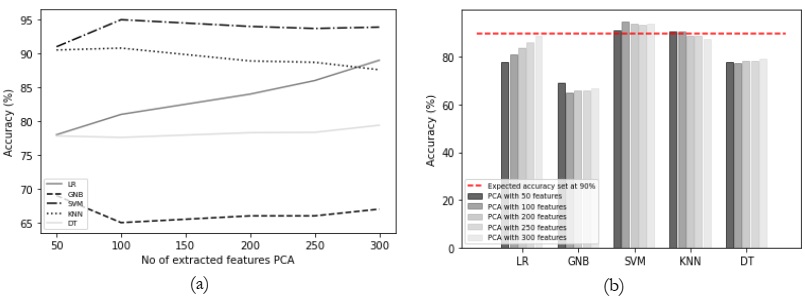
Figure 4: (a) Comparison between accuracy and number of extracted features using PCA and
(b) accuracy comparison with the different classifiers using PCA.
Table 2: Accuracy (%) comparison of classifiers using FA.
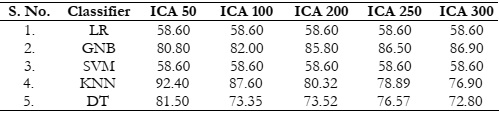
Results Comparison by Utilizing ICA:
ICA was employed with varying feature counts, and the associated results have been
summarized in Table 3. However, it's worth noting that ICA did not outperform PCA, FA, and
LDA in terms of achieving better results. Only the KNN classifier showed relatively good results
with ICA, but its performance also exhibited a decline as the number of features increased, as
indicated in Figure 6 (a). On the other hand, none of the other classifiers managed to attain
satisfactory results, consistently falling short of the expected performance, as visualized in Figure
6 (b).
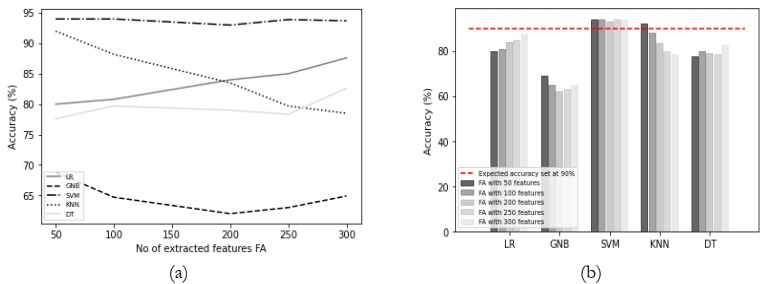
Figure 5: (a) Comparison between accuracy and number of extracted features using FA and
(b) accuracy comparison with the different classifiers using FA.
Table 3: Accuracy (%) comparison of classifiers using ICA.
Results Comparison by Utilizing LDA:
LDA is used with the default number of features. It uses different formulas to extract
features. When using LDA with default features, all classifiers achieve the expected accuracy, as
shown in Figure 7. Furthermore, there is a minimal difference observed among the accuracies
of the classifiers This demonstrates that it is an effective feature extraction technique capable of
yielding improved results with any of the classifiers. The corresponding results are also shown
in Table 4.
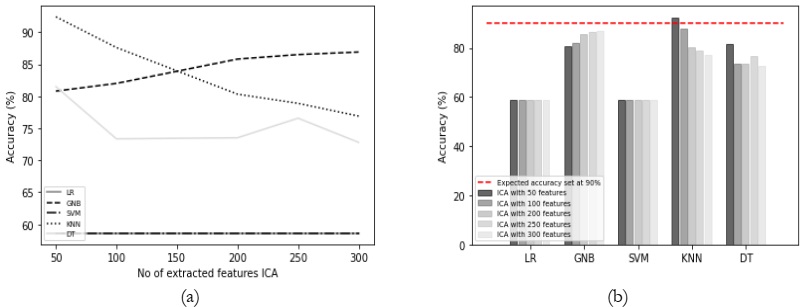
Figure 6: (a) Comparison between accuracy and number of extracted features using ICA and
(b) Accuracy comparison with the different classifiers using ICA.
"𝑁𝑜 𝑜𝑓 𝑓𝑒𝑎𝑡𝑢𝑟𝑒 = 𝑀𝑖𝑛 (𝑛𝑢𝑚𝑏𝑒𝑟 𝑜𝑓 𝑐𝑙𝑎𝑠𝑠𝑒𝑠 − 1, 𝑛𝑢𝑚𝑏𝑒𝑟 𝑜𝑓 𝑓𝑒𝑎𝑡𝑢𝑟𝑒𝑠) (23)"
Table 4: Accuracy (%) comparison of classifiers using LDA.
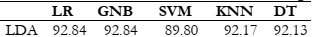
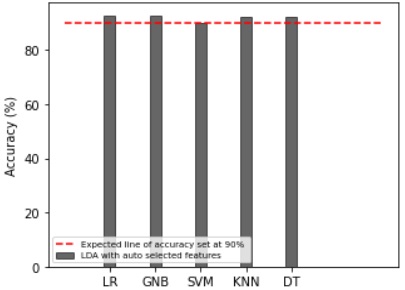
Figure 7: Accuracy comparison with the different classifiers using LDA.
Results Comparison by Utilizing Combined PCA and LDA:
In this approach, both PCA and LDA are combined, wherein PCA is applied with
varying numbers of features, while LDA retains its default feature selection. This technique
yielded the highest accuracy of 88.01%, with minimal variations among the accuracies of other
classifiers, as indicated in Table 5. As presented in Figure 8 (a), the accuracy improved as the
number of features increased. However, based on the results displayed in Figure 8 (b), it is noteworthy that LDA alone provides higher accuracy compared to the combined PCA and LDA
approach. Therefore, LDA is considered the optimal choice for these classification tasks.
Table 5: Accuracy (%) comparison of classifiers combined PCA and LDA.
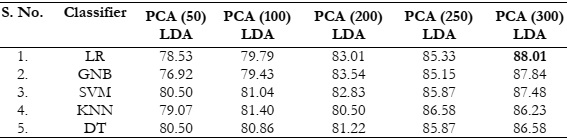
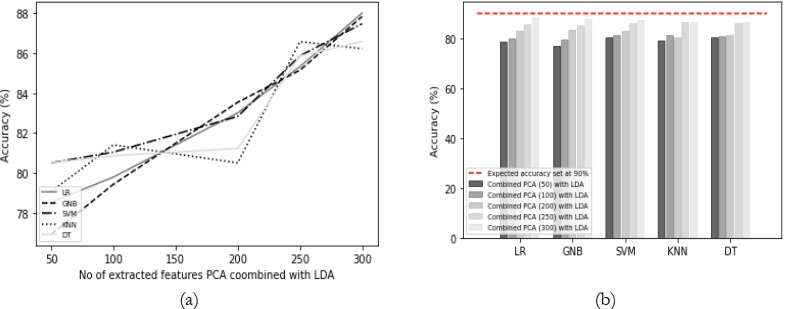
Figure 8: (a) Comparison between accuracy and number of extracted features using PCA
combined LDA and (b) Accuracy comparison with the different classifiers using PCA
combined LDA.
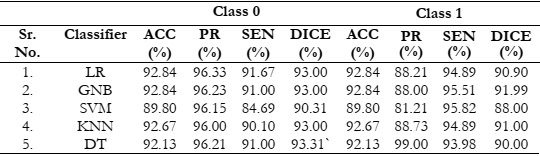
Table 6: Evaluation results of various classifiers with an optimal feature extraction technique
LDA.
Discussion
The results of the study demonstrate that LDA is the most effective feature extraction
technique, consistently yielding high-accuracy results in the classification of brain tumors,
covering a diverse spectrum of tumor types such as Gliomas, Pituitary, Meningioma, and
Glioblastoma. Glioma tumors are a group of primary brain tumors that originate from glial cells,
which provide support and protection for neurons in the central nervous system. Gliomas are
classified into various types and grades including low-grade (Grade I and II) and high-grade
(Grade III and IV) based on their histological features and behavior. Pituitary tumors, also
known as pituitary adenomas, are tumors that develop in the pituitary gland, a small gland
located at the base of the brain. These tumors can vary in terms of their size, hormone secretion,
and clinical features. Meningioma is a type of primary brain tumor that originates from the meninges, which are the protective membranes that surround the brain and spinal cord.
Meningiomas are typically slow-growing and benign, but they can occasionally be malignant.
Glioblastoma is the most invasive glial tumor because it grows rapidly and can damage other
tissues due to poor prognosis.
The MRIs employed in this study were gathered as segments or sections from various
sources of datasets. These chunks were based on both cancerous and non-cancerous images. A
total of 4082 MRIs, with 2795 images are used for training and 1287 used for testing purposes.
We standardized the image resolution by resizing all images to 200 by 200 pixels. Each image in
the dataset is typically associated with one label. These labels denote the specific tumor type
present (e.g., glioblastoma, meningioma, pituitary tumor, glioma tumor), or the absence of a
tumor (i.e., normal brain images). It's worth noting that patient age and gender-related
information is not available in the metadata utilized for our research.
We compared our proposed feature selection technique with state-of-the-art feature
selection techniques including PCA, ICA, FA, Combined PCA-LDA. Furthermore, we not only
obtained a varying number of features through extraction but also subjected these features to
analysis by five different classifiers in order to assess the classification results. The evaluation
results indicate that the proposed LDA technique extracted highly informative features, leading
to an impressive accuracy of 92.84%.
Our evaluation of the proposed technique focused exclusively on MRI scans, without
considering other imaging modalities such as ultrasound, X-rays, or CT scans. We employed a
set of five well-established classifiers, including logistic regression, support vector machine,
decision trees, Gaussian Naive Bayes, and K Nearest Neighbor, for the classification process.
The study concentrated on the classification of four specific tumor types: Gliomas, Pituitary
tumors, Meningioma, and Glioblastoma.
In real world, brain tumor classifiers are implemented in various healthcare settings,
including hospitals, cancer centers, and telemedicine applications, where they assist radiologists
and clinicians in diagnosing and managing brain tumors, ultimately improving patient care and
treatment planning. They are also used in clinical trials, educational platforms, and resourcelimited areas to enhance diagnostic accuracy. Additionally, these classifiers are integrated into
radiology software, medical imaging workstations, and teleradiology services, while research
institutions, startups, and government health initiatives utilize them for research, development,
and healthcare system improvement.
Looking ahead, this technique shows potential for more extensive applications,
encompassing the classification of diverse types of cancer, including lung, breast, and liver
cancer. This approach is expected to yield improved results across these diverse datasets,
potentially leading to earlier cancer diagnoses. Additionally, exploring the integration of LDA as
a feature extraction method in conjunction with other classifiers like convolutional neural
networks and Bayesian quadratic classifiers on brain MRI datasets could be a valuable avenue
for investigation and evaluation. Furthermore, it may be worthwhile to explore alternative
feature extraction techniques, such as local binary patterns and log Gabor algorithms. To
enhance the accuracy of this technique in future research, additional preprocessing steps on the
dataset can also be considered.
Conclusion
The objective of the study was to identify the most effective feature selection technique.
To accomplish this, several experiments were conducted using the Glioma tumor dataset
sourced from Kaggle. To improve the performance, we extracted several feature counts,
including 50, 100, 200, 250, and 300, and employed state-of-the-art classifiers. Unfortunately,
the results of the comparisons did not meet our expectations. However, the breakthrough came
when we employed LDA for feature extraction. All the classifiers exhibited exceptional performance and consistently achieved accuracy levels exceeding 90%, making them
indisputable frontrunners in this competition. Thus, we propose LDA as an optimal feature
selection technique for brain MRI classification.
Ethics approval and consent to participate:
Formal consent is not required in this type of study.
Availability of dataset and materials:
The data supporting the findings of the article is available at
https://www.kaggle.com/dsv/2645886 and https://www.kaggle.com/dsv/1183165 [1][2].
Acknowledgement:
The authors acknowledge all
the efforts of Nickparvar [1]
and Bhuavaji et al. [2] for
generously providing the datasets used in this study.
Their contribution has been
invaluable to the successful
completion of our research.
Project Detail: Nil
Conflict of Interest:
The authors declare that they
have no conflict of interest.
Reference
[1] “Brain Tumor MRI Dataset.”
https://www.kaggle.com/datasets/masoudnickparvar/brain-tumor-mri-dataset
(accessed Nov. 02, 2023).
[2] “Brain Tumor Classification (MRI).”
https://www.kaggle.com/datasets/sartajbhuvaji/brain-tumor-classification-mri
(accessed Nov. 02, 2023).
[3] B. Ilhan, P. Guneri, and P. Wilder-Smith, “The contribution of artificial intelligence to
reducing the diagnostic delay in oral cancer,” Oral Oncol., vol. 116, p. 105254, May 2021,
doi: 10.1016/J.ORALONCOLOGY.2021.105254.
[4] A. Osman and B. Alsabbagh, “Image-classification for Brain Tumor using Pre-trained
Convolutional Neural Network”.
[5] M. Westphal and K. Lamszus, “The neurobiology of gliomas: from cell biology to the
development of therapeutic approaches,” Nat. Rev. Neurosci. 2011 129, vol. 12, no. 9, pp.
495–508, Aug. 2011, doi: 10.1038/nrn3060.
[6] L. R. S. Charfi, R. Lahmyed, “A novel approach for brain tumor detection using neural
network,” Int. J. Res. Eng. Technol., vol. 2, no. 7, pp. 93–104, 2014.
[7] B. Ural, “A Computer-Based Brain Tumor Detection Approach with Advanced Image
Processing and Probabilistic Neural Network Methods,” J. Med. Biol. Eng., vol. 38, no.
6, pp. 867–879, Dec. 2018, doi: 10.1007/S40846-017-0353-Y/METRICS.
[8] K. Sudharani, T. C. Sarma, and K. S. Prasad, “Advanced Morphological Technique for
Automatic Brain Tumor Detection and Evaluation of Statistical Parameters,” Procedia
Technol., vol. 24, pp. 1374–1387, Jan. 2016, doi: 10.1016/J.PROTCY.2016.05.153.
[9] A. S. A. and P. Augustine, “Efficient brain tumor classification using PCA and SVM,”
Int. J. Res. Eng. IT Soc. Sci., vol. 7, pp. 1–7, 2017.
[10] “Deep learning for brain tumor classification.”
https://www.spiedigitallibrary.org/conference-proceedings-of-spie/10137/1/Deeplearning-for-brain-tumor-classification/10.1117/12.2254195.full (accessed Nov. 02,
2023).
[11] I. Guyon and A. Elisseefl, “An introduction to feature extraction,” Stud. Fuzziness Soft
Comput., vol. 207, pp. 1–25, 2006, doi: 10.1007/978-3-540-35488-8_1/COVER.
[12] R. Bro and A. K. Smilde, “Principal component analysis,” Anal. Methods, vol. 6, no. 9,
pp. 2812–2831, Apr. 2014, doi: 10.1039/C3AY41907J.
[13] P. Xanthopoulos, P. M. Pardalos, and T. B. Trafalis, “Linear Discriminant Analysis,”
pp. 27–33, 2013, doi: 10.1007/978-1-4419-9878-1_4.
[14] J. V. Stone, “Independent component analysis: an introduction,” Trends Cogn. Sci., vol. 6,
no. 2, pp. 59–64, 2002.
[15] N. Khosla, “Dimensionality reduction using factor analysis,” Griffith Univ. Aust., 2004.
[16] J. R. Lambert and E. Perumal, “Optimal Feature Selection Methods for Chronic Kidney
Disease Classification using Intelligent Optimization Algorithms,” Recent Adv. Comput.
Sci. Commun., vol. 14, no. 9, pp. 2886–2898, Aug. 2020, doi: 10.2174/2666255813999200818131835.
[17] H. Kamel, D. Abdulah, and J. M. Al-Tuwaijari, “Cancer Classification Using Gaussian
Naive Bayes Algorithm,” Proc. 5th Int. Eng. Conf. IEC 2019, pp. 165–170, Jun. 2019, doi:
10.1109/IEC47844.2019.8950650.
[18] W. S. Noble, “What is a support vector machine?,” Nat. Biotechnol., vol. 24, no. 12, pp.
1565–1567, Dec. 2006, doi: 10.1038/NBT1206-1565.
[19] Y. Liao and V. R. Vemuri, “Use of K-Nearest Neighbor classifier for intrusion
detection,” Comput. Secur., vol. 21, no. 5, pp. 439–448, Oct. 2002, doi: 10.1016/S0167-
4048(02)00514-X.
[20] A. J. Myles, R. N. Feudale, Y. Liu, N. A. Woody, and S. D. Brown, “An introduction to
decision tree modeling,” J. Chemom., vol. 18, no. 6, pp. 275–285, Jun. 2004, doi:
10.1002/CEM.873.
[21] M. Hossin and Sulaiman, “A REVIEW ON EVALUATION METRICS FOR DATA
CLASSIFICATION EVALUATIONS,” Int. J. Data Min. Knowl. Manag. Process, vol. 5,
no. 2, 2015, doi: 10.5121/ijdkp.2015.5201.
