E-ISSN:2709-6130
P-ISSN:2618-1630

Research Article

International Journal of Innovations in Science & Technology

2024 Volume 6 Number 1 Jan-Mar

Python-Based Land Suitability Analysis for Wheat Cultivation Using MCE and Google Earth Engine in Punjab-Pakistan

Ahmed. N1, Mahmood. S. A1, hazil, M.S1, Batool. S2

1 Department of Space Science, University of Punjab, 54780, Lahore, Pakistan.Center of Integrated Mountain Research, University of the Punjab.

2 Center of Integrated Mountain Research, University of the Punjab.

Abstract
The present study aims to examine the suitability of wheat crops in the four districts of Sheikhupura, Gujranwala, Hafizabad, and Nankana Sahib by conducting a thorough examination of various environmental parameters. The study utilizes the Google Earth Engine and advanced mapping techniques to employ a comprehensive Land Use and Land Cover (LULC) categorization, effectively capturing the prevailing terrain characteristics. The integration of temperature-based and soil-based suitability maps provides a comprehensive understanding of the intricate geographical patterns governing the growth circumstances of wheat. The study highlights a significant finding regarding the identification of very appropriate zones, which encompass around 28% of the total land area (4243 square kilometers) out of complete study site. These zones are particularly noteworthy as they emphasize places that are best for the growing of wheat. Approximately 45% (6819 square kilometers) of the overall land area is classified as moderately suitable, while 15% (2273 square kilometers) of the land area is categorized as less suitable. Furthermore, 16% of the total land area, encompassing 2444 square kilometers, is deemed unsuitable. The rigorous examination of soil parameters, such as pH, drainage, electrical conductivity, and soil type, contributes to a comprehensive comprehension of the soil-related elements that influence the adaptability of wheat crops. The study utilizes a Classification and Regression Tree (CART) methodology to classify crops, resulting in accurate outcomes with a ground truthing accuracy rate of 82%. This study employs a comprehensive approach by integrating temperature and soil-based data to provide a suitability map that enhances the identification of places suitable for wheat growing. Notwithstanding the accuracy of the findings, the research acknowledges certain constraints, including the necessity for heightened farmer consciousness and the incorporation of climate change ramifications. This study offers a comprehensive framework for sustainable agricultural planning, focusing on identifying certain regions that are most suitable for wheat growth. The findings of this research will serve as a valuable resource for guiding future initiatives and decision-making processes related to agricultural development in the studied area.

Keywords: Wheat, Land suitability, Google Earth Engine, Sustainable Planning, Remote sensing.

Corresponding Author How to Cite this Article
Nadeem Ahmed, Department of Space Science, University of Punjab, 54780, Lahore, Pakistan.
Nadeem Ahmed, Syed Amer Mahmood, Muhammad Shareef Shazil and Saira Batool , Python-Based Land Suitability Analysis for Wheat Cultivation Using MCE and Google Earth Engine in Punjab-Pakistan . IJIST. 2024 ;6(1):11-25 https://journal.50sea.com/index.php/IJIST/article/view/588

Introduction

According to the global population data sheet, the worldwide population reached a total of 8.1 billion individuals in the year 2023. Projections suggest that this figure is expected to rise to 9.9 billion by the year 2050 [1]. Consequently, there are increasing concerns regarding the escalating demand for food resources [1]. Within this particular framework, the expeditious transformation of agricultural land into urban regions is resulting in a reduction in food resources, presenting a significant obstacle to Pakistan's economy, which is primarily dependent on agriculture and accounts for 21% of the Gross Domestic Product (GDP) [2]. The significance of agricultural output in Pakistan is of utmost importance, given its direct influence on the livelihoods of around 70% of the nation's populace [3]. Agriculture has a pivotal role in providing both economic sustenance and livelihoods for a substantial segment of the population, underscoring its fundamental significance in bolstering rural communities and the broader economy [4].

Wheat is a prominent staple crop that plays a crucial part in fulfilling the dietary requirements of the nation. In addition to wheat, several other crucial crops, including rice, maize, corn, and sugarcane, jointly contribute to the rich agricultural panorama of Pakistan [5]. These agricultural commodities not only play a crucial role in the dietary patterns of the nation but also make a significant contribution to the economic productivity of the agricultural sector. Nevertheless, the exponential growth of metropolitan regions presents a substantial obstacle for the agricultural industry [6]. The rapid expansion of cities and urban infrastructure is resulting in the conversion of agricultural land into residential and commercial areas [7]. The phenomenon of urbanization has resulted in a decrease in the amount of land that is available for agricultural purposes, hence causing a drop in the overall productivity of the agricultural sector. The expansion of urban development into agricultural regions requires the use of meticulous and strategic resource management practices in order to alleviate the negative impacts on food production.

Due to these prevailing constraints, it is crucial for Pakistan to implement comprehensive plans that effectively address the demands of urban development while simultaneously safeguarding agricultural land [8]. The optimization of land usage, implementation of sustainable agriculture practices, and utilization of technical breakthroughs are key areas of focus for strategic resource management methods, with the aim of enhancing productivity. In order to effectively tackle the growing food demands, it is imperative to adopt a collaborative approach that encompasses the perspectives and expertise of several stakeholders, including government agencies, farmers, researchers, and urban planners. It is imperative for policymakers to establish and execute policies that endorse sustainable farming methods, safeguard fertile soil, and foster the advancement of rural areas. Furthermore, the implementation of programs aimed at fostering innovation in agricultural practices, efficient water resource utilization, and the integration of technological advancements can play a significant role in alleviating the adverse effects of urban sprawl on agricultural output [5].

Within the domain of agricultural productivity, the comprehension and effective management of ecological elements assume a crucial position in guaranteeing the attainment of maximum crop output. Various factors, including soil quality, temperature, moisture, and soil pH, have a substantial impact on the growth of plants and, subsequently, on the nutritional composition of crops [9]. Notwithstanding the indisputable influence of these parameters, there is a conspicuous deficiency in farmers' awareness concerning their significance in assessing wheat production per acre. Given the identified knowledge gap, it is imperative to undertake broad educational activities targeted towards farmers. Through the dissemination of information regarding the distinct characteristics of soil and the elucidation of the interrelationship between these ecological parameters and the productivity of wheat crops, farmers are empowered to make well-informed decisions that foster enhanced yields and promote agricultural sustainability on a broader scale [10][11].

In the endeavor to improve agricultural production, it is crucial to implement recommended measures that emphasize the significant importance of soil compatibility in attaining desired crop yields. An instrumental technique can be employed to classify soil into subclasses, thus facilitating a comprehensive comprehension of its characteristics and potential. The utilization of the Geographical Information System (GIS) has become increasingly significant in this context, as it facilitates the examination and depiction of soil suitability from a spatial standpoint [12]. The incorporation of Geographic Information Systems (GIS) with Multi-Criteria Evaluation (MCE) methodologies serves to augment the accuracy of delineating areas of appropriateness. The MCE framework takes into account various essential parameters such as soil quality, temperature, moisture, and pH [13]. This comprehensive approach aims to maximize crop yield while reducing any potential production losses. The utilization of analytical synergy provides agricultural stakeholders with significant insights into the complexities of the agricultural landscape, hence facilitating more efficient decision-making processes.

Moreover, the progress in technology has played a crucial role in enhancing the precision of these analytical procedures. The utilization of Google Earth Engine (GEE) has demonstrated its efficacy as a robust instrument for the production of comprehensive land-use and Land Surface Temperature (LST) cartography [14]. Utilizing the Google Earth Engine (GEE) platform for the purpose of mapping activities introduces a heightened level of complexity to the study, hence enabling a more dynamic and contemporaneous evaluation of the agricultural terrain. The integration of Generalized Estimating Equations (GEE) with Geographic Information Systems (GIS) not only enhances the efficiency of the mapping procedure but also enables a comprehensive exploration of the geographical and temporal factors that impact agricultural productivity [15].

Objectives:

This study represents a notable progression in the agricultural methodologies employed in the districts of Sheikhupura, Gujranwala, Hafizabad, and Nankana Sahib. The primary objective of this research is to evaluate the appropriateness of land for agricultural purposes by considering temperature patterns and soil attributes. In contrast to many modern approaches that employ Python-based techniques, this study chooses to apply well-established procedures for the analysis and improvement of agricultural practices in these places. This research deliberately employs a traditional method, taking into consideration the continuous development of agricultural technology and the widespread use of machine learning techniques. The main aim of this study is to utilize MCE methods within the framework of the GIS to discover optimal areas appropriate for wheat growing. The selection of this technique is predicated upon the distinct environmental and agricultural needs specific to the districts of Sheikhupura, Gujranwala, Hafizabad, and Nankana Sahib.

The research technique encompasses the careful examination of several variables that are essential for assessing wheat growth parameters. The assessment technique relies on critical components such as soil pH, drainage, electrical conductivity, soil type, and temperature data. By conducting a thorough examination of these factors, the study seeks to identify possible locations for the growing of wheat, so enhancing the ability to make well-informed decisions regarding agricultural practices at the local level. While acknowledging the practicality of Python-based methodologies in many settings, this research underscores the significance of a geographically targeted and traditional methodology. This highlights the importance of conducting temperature and soil-based analyses that are specifically designed to suit the unique conditions and intricacies of the districts of Sheikhupura, Gujranwala, Hafizabad, and Nankana Sahib. The implementation of proven procedures guarantees that the research findings are in accordance with the particular requirements and attributes of the study area, hence fostering sustainable agricultural growth in this region.

Study Area:

The research area comprises the administrative divisions of Sheikhupura, Gujranwala, Hafizabad, and Nankana Sahib, located in the agriculturally productive plains of Punjab, Pakistan. These regions collectively constitute an important agricultural belt, famous for their substantial contribution to Pakistan's wheat output. Situated in the central region of Punjab, the city of Sheikhupura is renowned for its vast and fertile agricultural terrains [16]. The district exhibits a wide variety of soil types, encompassing both alluvial and loamy soils. These soil characteristics have a significant impact on the cultivation of wheat in the region. The interdependence of the regional economy and agricultural activities necessitates the evaluation of wheat viability by considering many elements such as soil pH, drainage, and temperature. Gujranwala, renowned for its rich plains and thriving agricultural sector, holds a significant position in Pakistan's wheat output. The Chenab River exerts a significant influence on the fertility of the surrounding soils [17]. The suitability of wheat cultivation in Gujranwala is determined by various elements, including soil texture, moisture levels, and temperature fluctuations. An in-depth comprehension of these factors is crucial for maximizing wheat productivity in this geographical area.

The inclusion of Hafizabad, given its varied geography and agricultural techniques, is of paramount importance in this study. The soils within the district exhibit a range of characteristics, varying from loamy to clayey compositions, which in turn have implications for water retention and drainage capabilities [18]. In order to evaluate the appropriateness of wheat cultivation in Hafizabad, a comprehensive analysis of the region's agroecological characteristics is necessary. This assessment should encompass several elements such as soil composition, water availability, and temperature trends. Nankana Sahib, the location of origin of Guru Nanak, possesses substantial cultural importance and constitutes an integral component of the wheat-producing topography [2]. The soils within the area display a considerable degree of variety, which underscores the importance of conducting a thorough analysis of key characteristics such as soil pH, texture, and temperature in order to appropriately assess the viability of wheat cultivation. In the context of assessing the suitability of wheat production, it is important to carefully evaluate the commonalities and distinctions seen across different areas. The objective of this study is to investigate the complex interconnections of soil properties, temperature fluctuations, and other significant variables in order to offer specific knowledge for enhancing wheat farming techniques in the districts of Sheikhupura, Gujranwala, Hafizabad, and Nankana Sahib [19]. The results of this study will provide valuable insights for making well-informed decisions regarding sustainable and productive wheat cultivation in this crucial agricultural region.

Data Collection:

The data collection procedure employed in this study was conducted with great care and was a crucial element in obtaining thorough information for the assessment of wheat suitability in the districts of Sheikhupura, Gujranwala, Hafizabad, and Nankana Sahib. The data collection encompassed a variety of criteria, such as soil properties, satellite data, fluctuations in temperature, and patterns of land usage.

The collection of soil data from the Punjab Soil Survey is of utmost importance in comprehending the fundamental factors involved in wheat cultivation. The provided data encompassed details pertaining to soil pH levels, drainage properties, soil texture, and electrical conductivity. The process of collecting soil data entailed conducting sampling activities throughout the designated study region, with the aim of obtaining a comprehensive and varied selection of soil samples that accurately represented the area. These samples were then subjected to meticulous analysis.

Figure 1: Study Area map

Figure 2: Flow chart of methodology

Land Surface Temperature:

The assessment of wheat adaptability throughout its growth cycle involved the collection of data at five pivotal stages: germination, blooming, tillering, heading, and maturity. The collection of Land Surface Temperature (LST) data during these specified time intervals has yielded valuable insights into temperature fluctuations that are essential for the growth of wheat [20][21]. The utilization of a temporal method facilitated a thorough comprehension of temperature-dependent suitable points across the entire duration of wheat cultivation.

Land Use Land Cover (LULC) Classification:

The research utilized the Google Earth Engine platform to perform the categorization of Land Use and Land Cover (LULC). The methodology employed in this study encompassed the classification and spatial representation of several land utilization patterns within the designated research site, including agricultural plots, urbanized regions, and indigenous flora [20]. The utilization of LULC data provided significant insights into the existing land cover conditions, which had an impact on the overall evaluation of the suitability of wheat cultivation.

Data Integration:

Subsequently, the gathered data was amalgamated in order to generate a holistic perspective of the agricultural terrain. The analysis involved a comprehensive examination of soil data, temperature fluctuations, and land use patterns in order to ascertain the specific geographic areas that had the most favorable circumstances for the production of wheat. The integration of many parameters facilitated a comprehensive assessment of the variables that impact the appropriateness of wheat in the designated research region.

The data collection process was conducted in accordance with stringent criteria in order to guarantee precision and dependability. The study sought to offer a comprehensive and knowledgeable viewpoint on the adaptability of wheat in the particular districts under examination by integrating data on soil properties, temperature fluctuations throughout crucial growth phases, and land use patterns. The comprehensive dataset presented above is the fundamental basis for further studies and decision-making processes pertaining to sustainable agriculture practices within the designated study area.

Multicriteria Decision Analysis (MCDA):

The utilization of Multicriteria Decision Analysis (MCDA) was a fundamental component of the study's methodology, as it provided a structured framework for evaluating and incorporating several criteria that impact the appropriateness of wheat. The procedure encompassed the evaluation of several elements, such as soil properties, fluctuations in temperature, and patterns of land utilization, in order to make well-informed determinations of the most suitable areas for growing wheat [22]. In the present study, the utilization of Multi-Criteria Decision Analysis (MCDA) enabled the determination of appropriateness zones through the allocation of weights to various criteria, taking into account their respective levels of significance [23]. The utilization of a weighted scoring approach in the analysis facilitated a comprehensive evaluation of the various elements that impact the growth of wheat, so ensuring a fair and equitable assessment. By including these weighted criteria, it was possible to identify the places within the research area that are most suitable for wheat farming.

Table 1: Metadata offset light thermal bands to compute temperature in degrees Celsius

Table 2: Literature-based Optimum temperature and observed temperature for different stages of wheat Crop.

Table 3: Landsat image acquisition dates for LST estimation

Interpolation:

The utilization of interpolation techniques was important in the production of a comprehensive spatial representation of temperature-based suitability points throughout the designated study region. The study specifically concentrated on the interpolation of Land Surface Temperature (LST) data obtained at crucial stages of wheat growth, namely germination, blooming, tillering, heading, and maturity. Interpolation techniques were utilized to estimate temperature values at unobserved places, so offering a continuous and comprehensive depiction of temperature fluctuations [24]. A spatially explicit map was generated using interpolation techniques to illustrate temperature gradients and variations across the designated study region. The temperature map played a crucial role in identifying wheat suitability zones, enhancing our comprehension of the spatial arrangement of ideal circumstances for growing wheat [25].

Table 4: Soil suitability parameters

Table 5: Sensitivity Analysis for Analytical Hierarchy Process (AHP) to compute the weight of each parameter

Figure 3 illustrates the Land Use and Land Cover (LULC) map of the study area, employing the Google Earth Engine CART method. The study systematically divided the region into five distinct parts for comprehensive analysis. The results depict the predominant land cover classes, with Crops covering an extensive 14,699 square kilometers, emphasizing the substantial agricultural footprint in the area. Additionally, Built-up areas span 858 square kilometers, reflecting urban and developed regions. Other notable land cover classes include Bare land, Water Bodies, and Vegetation, each contributing to the overall landscape composition. This concise representation provides a visual overview of the land cover distribution in the study area, serving as a foundation for subsequent analyses and interpretations.

Result and Discussion

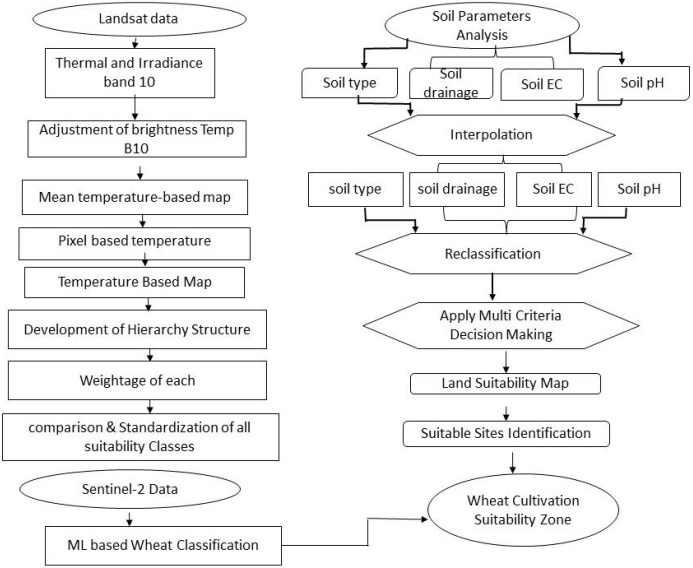
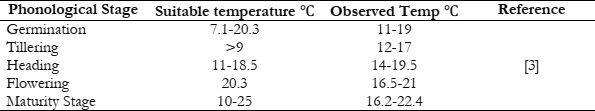
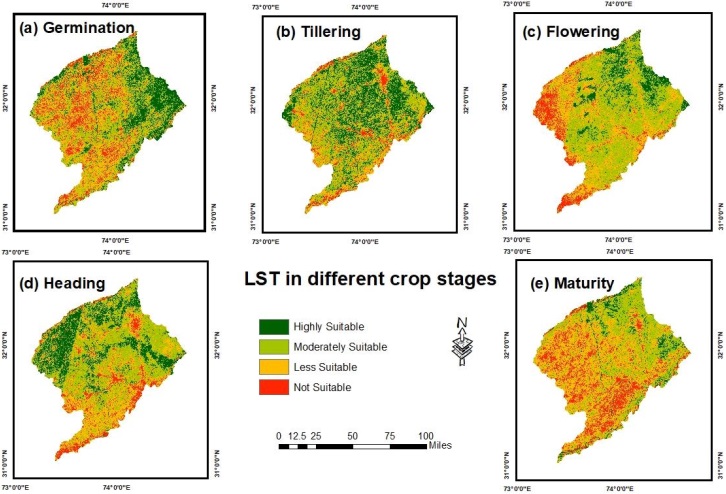
Figure 4 represents the Land Surface Temperature (LST) at five distinct stages in the study area, utilizing Google Earth Engine. The LST values, a key indicator of temperature variations across the landscape, are depicted during crucial wheat growth stages, including germination, flowering, tillering, heading, and maturity. The color variations on the map represent the intensity of temperature at each stage, offering insights into the thermal dynamics of the study area throughout the wheat cultivation cycle. This visual depiction aids in understanding the spatial distribution of temperature patterns, contributing valuable information for the subsequent assessment of wheat crop suitability.

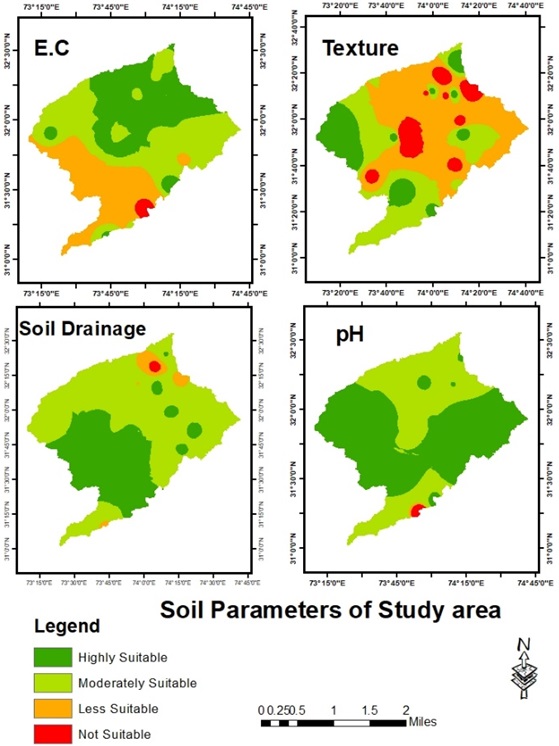
Figure 5 illustrates the soil parameters of the study area, focusing on four distinct key parameters critical for agricultural analysis. The visualization provides insights into the spatial distribution of these parameters across the landscape. The specific parameters may include but are not limited to soil pH, drainage characteristics, electrical conductivity, and soil type. By visually representing these soil attributes, Figure 5 aids in comprehending the heterogeneity of soil conditions within the study area. This visual insight is integral for understanding the diverse environmental factors that influence wheat crop suitability, further contributing to the overall interpretation of the research findings.

Figure 6 displays the integrated soil-based map of the study area, generated through a weighted overlay method. This method combines various soil parameters, assigning weights based on their respective significance in influencing wheat crop suitability. The map provides a spatial representation of the integrated soil parameters, offering a comprehensive view of the areas with optimal conditions for wheat cultivation. The weighted overlay approach considers the varying contributions of individual soil factors, such as pH, drainage, electrical conductivity, and soil type, resulting in a nuanced assessment of the overall soil-based suitability across the landscape. The visual output in Figure 6 serves as a valuable tool for decision-makers and researchers, aiding in the identification of regions with favorable soil conditions for sustainable wheat production.

Figure 3: Land use map of the study areaInterpolated maps of soil parameters

Figure 4: Interpolated maps of soil parameters

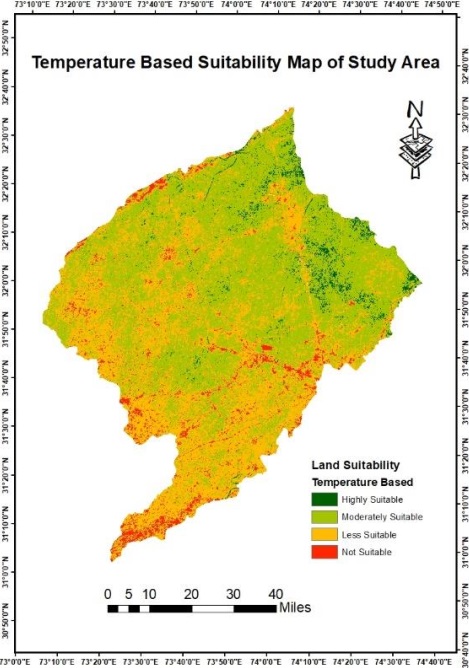
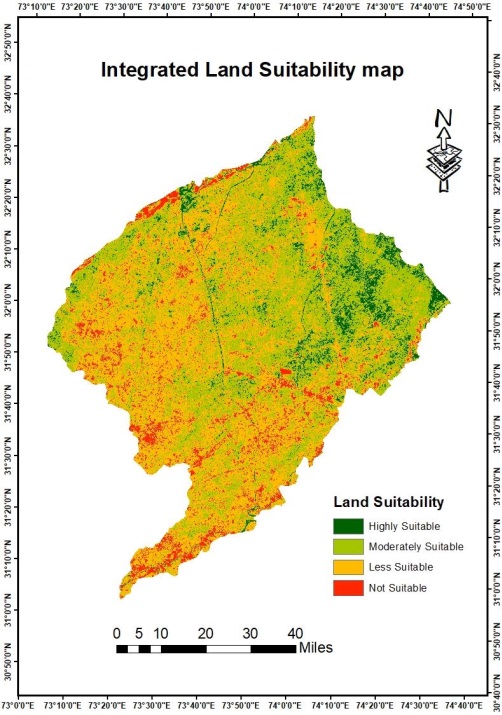
Figure 7 presents temperature-based suitability maps for the study area, capturing variations in temperature that influence wheat crop growth. These maps depict spatial patterns of temperature ranges, providing crucial information for identifying areas with optimal conditions for wheat cultivation. In Figure 8, an integrated map is showcased, combining both soil-based and temperature-based suitability maps. This comprehensive approach considers the interplay of environmental factors, including soil parameters and temperature variations, to generate a unified suitability map. The integration of these critical components enhances the precision of identifying regions highly suitable for wheat cultivation, offering a more holistic perspective for agricultural planning. Together, Figures 7 and 8 contribute valuable insights into the diverse factors influencing wheat crop suitability, providing a visual representation that aids in decision-making and resource allocation for sustainable agricultural practices in the study area.

Figure 5: Land surface temperature maps of the study area during the five stages of wheat growth

Discussion:

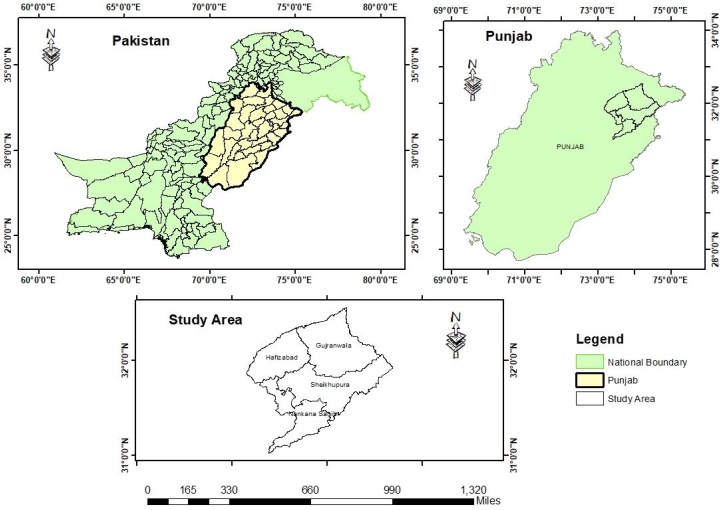
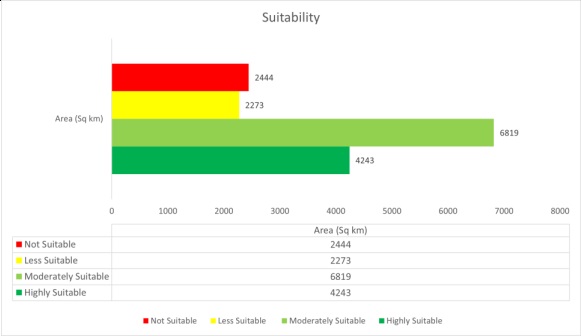
The study focused on assessing wheat crop suitability based on temperature ranges and soil characteristics, employing a classification system that categorized areas into less suitable, highly suitable, moderately suitable, and unsuitable classes.

Figure 6: Soil-based land suitability map

Figure 7: LST-based land suitability map

Figure 8: Integrated land suitability map

Figure 9: Area of each land use class

Figure 10: Land suitability zones and area-wise percentage

Notably, urban areas were identified as heat islands due to anthropogenic activities, emitting gases such as CO2, SO2, and particulate matter that trap heat. These elevated temperatures, exceeding the optimal range for wheat growth, adversely affect wheat plants near urban zones, resulting in shorter stature and heightened stress. Conversely, areas near water bodies were observed as less suitable for wheat plants due to lower temperatures, causing delayed growth. Spatially, sites within urban and water body areas were identified as highly and moderately suitable for wheat cultivation, falling within the optimal temperature range for wheat growth. The Electrical Conductivity (EC) map indicated elevated values near urban areas, potentially attributed to various household materials like iron, magnesium, cobalt, and calcium, though their impact on wheat crop growth was considered minimal.

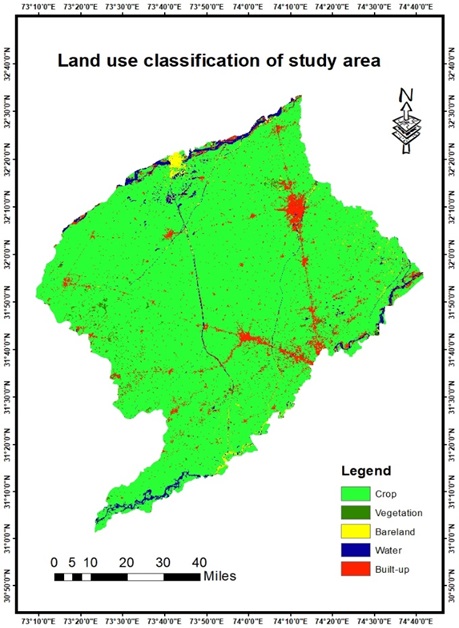
Within the studied landscape, the land use and land cover (LULC) classification results reveal distinctive characteristics of highly suitable zones for wheat cultivation. Among the identified land cover classes, the Crop category stands out prominently, covering an expansive 14,699 square kilometers. This vast expanse signifies areas highly conducive to agricultural activities, particularly wheat cultivation. The distribution of highly suitable zones constitutes 28% of the total land, showcasing regions where optimal conditions align with the temperature-based and soil-based suitability maps. These zones emerge as pivotal areas for wheat cultivation, providing a fertile environment for robust crop growth. The prevalence of such highly suitable zones underscores the agricultural significance of the studied districts, emphasizing the potential for optimizing wheat production in these specific areas. The detailed classification results contribute valuable insights for targeted agricultural planning and resource allocation, aiming to harness the full potential of the identified highly suitable zones for sustainable wheat cultivation.

The study also explored soil characteristics, highlighting the significance of soil type, pH, and drainage. Clayish soil was identified as the most conducive for wheat crop growth due to its high water-holding capacity, while silty and loamy soil types were considered suitable to a lesser extent. Areas under sandy soil were deemed unsuitable due to high water seepage, requiring frequent irrigation. The influence of soil drainage was considered less significant in the overall flat terrain of the study area. In terms of classification methods, the study employed classification and regression tree (CART), demonstrating its superiority over other available methods with a reliability of 82% during ground truthing. To enhance accuracy, the study meticulously identified and removed areas with vegetation types other than wheat, such as grass for cattle grazing. Despite the research's accuracy, a notable concern arises from the lack of awareness among local farmers regarding the application of the latest techniques. This knowledge gap is identified as a contributing factor to the overall decline in production within the study site. Addressing this awareness deficit among farmers is crucial for optimizing the benefits of advanced techniques and fostering sustainable agricultural practices in the region.

This research, while providing valuable insights into wheat crop suitability mapping in Sheikhupura, Gujranwala, Hafizabad, and Nankana Sahib districts, is subject to certain limitations that warrant consideration. The reliance on limited ground truthing data poses a potential constraint on the accuracy of the classification results, introducing uncertainties in the suitability maps. Additionally, the study's temperature-based suitability mapping simplifies the intricate relationship between temperature ranges and wheat growth, potentially overlooking the multifaceted environmental factors influencing crop suitability. The focus on key soil parameters, such as pH, drainage, and soil type, excludes other potentially impactful soil characteristics, necessitating a more comprehensive soil analysis. The research does not explicitly account for climate change effects, overlooking potential shifts in climate patterns that could significantly impact wheat crop suitability over time. The study also highlights a lack of awareness among local farmers regarding the latest techniques, posing a practical implementation challenge and limiting the potential benefits for the agricultural community. Moreover, the exclusion of socioeconomic factors and assumptions of homogeneity within land cover classes further shape the context of these limitations. Lastly, temporal constraints and the reliance on data from specific time periods may not fully capture seasonal variations and changing agricultural practices, potentially affecting the study's applicability over time. Recognizing and addressing these limitations is crucial for refining the research outcomes and guiding future studies in this agricultural context.

Conclusion

This study offers significant contributions to the understanding of wheat crop suitability in the districts of Sheikhupura, Gujranwala, Hafizabad, and Nankana Sahib. Leveraging advanced mapping techniques, including Google Earth Engine and the Analytical Hierarchy Process (AHP), the research provides a thorough examination of the environmental factors shaping wheat cultivation. The integration of temperature-based and soil-based suitability maps not only reveals distinct spatial patterns but also enhances the precision of identifying highly suitable zones, constituting 28% of the land area. Approximately 45% (6819 square kilometers) of the overall land area is classified as moderately suitable, while 15% (2273 square kilometers) of the land area is categorized as less suitable. Furthermore, 16% of the total land area, encompassing 2444 square kilometers, is deemed unsuitable. The analysis sheds light on the impact of urbanization, exposing urban heat islands and their consequential effects on nearby wheat crops. The meticulous consideration of soil parameters, such as pH, drainage, electrical conductivity, and soil type, adds depth to the investigation. Furthermore, the application of the CART for crop classification showcases a ground-truthing accuracy of 82%, attesting to the reliability of the results. The study utilizes the Analytical Hierarchy Process to assign weights to different environmental factors, contributing to a more nuanced understanding of their relative importance in determining wheat crop suitability. By combining temperature and soil-based maps through Google Earth Engine, this research generates a unified suitability map, refining the identification of regions optimal for sustainable wheat production. Despite these advancements, the study underscores the need for increased farmer awareness and emphasizes the importance of considering potential climate change impacts in future research and agricultural planning. In essence, this research not only deepens our understanding of wheat crop suitability but also highlights the pivotal role of advanced analytical tools in informing sustainable agricultural practices in the studied regions.

Reference

[1] F. Karimi, S. Sultana, A. Shirzadi Babakan, and D. Royall, “Land Suitability Evaluation for Organic Agriculture of Wheat Using GIS and Multicriteria Analysis,” Pap. Appl. Geogr., vol. 4, no. 3, pp. 326–342, Jul. 2018, doi: 10.1080/23754931.2018.1448715.

[2] S. Batool, S. A. Mahmood, and M. Muhammad Ali, “ASSESSMENT OF LAND SUITABILITY AND CAPABILITY BY INTEGRATING REMOTE SENSING AND GIS FOR AGRICULTURE IN POTWAR REGION PAKISTAN,” Int. Arch. Photogramm. Remote Sens. Spat. Inf. Sci., vol. XLVIII-M-1–2023, pp. 409–415, Jun. 2023, doi: 10.5194/ISPRS-ARCHIVES-XLVIII-M-1-2023-409-2023.

[3] R. M. A. Khan, S. A. Mahmood, Y. Miao, and M. Ur Rasheed, “Python Driven Pathways for Wheat Cultivation Incorporating Physico-Climatic Parameters of Growth,” J. Agric. Sci. Technol, vol. 25, no. 4, pp. 893–909, 2023, doi: 10.22034/jast.25.4.9.

[4] M. Dedeoğlu and O. Dengiz, “Generating of land suitability index for wheat with hybrid system aproach using AHP and GIS,” Comput. Electron. Agric., vol. 167, p. 105062, Dec. 2019, doi: 10.1016/J.COMPAG.2019.105062.

[5] N. Khubaib et al., “Predicting areas suitable for wheat and maize cultivation under future climate change scenarios in Pakistan,” Clim. Res., vol. 83, pp. 15–25, Feb. 2021, doi: 10.3354/CR01631.

[6] D. B. Debalke, D. A. Mengistu, and T. E. Admas, “Physical land suitability evaluation of rainfed crop production of wheat, barley, and teff in Arsi zone of Ethiopia,” Arab. J. Geosci. 2023 163, vol. 16, no. 3, pp. 1–16, Feb. 2023, doi: 10.1007/S12517-023-11271-X.

[7] “Flash flood susceptibility modeling for drainage basins of Dir Lower Khyber-Pakhtunkhwa: a comparative analysis of morphometric ranking and El-Shamy’s approach.” Accessed: Nov. 23, 2023. [Online]. Available: https://www.spiedigitallibrary.org/conference-proceedings-of-spie/11528/2573062/Flash-flood-susceptibility-modeling-for-drainage-basins-of-Dir-Lower/10.1117/12.2573062.full?SSO=1

[8] A. Karimi, P. Mohammad, A. García-Martínez, D. Moreno-Rangel, D. Gachkar, and S. Gachkar, “New developments and future challenges in reducing and controlling heat island effect in urban areas,” Environ. Dev. Sustain. 2022 2510, vol. 25, no. 10, pp. 10485–10531, Jul. 2022, doi: 10.1007/S10668-022-02530-0.

[9] G. Dadhich, P. R. Patel, and M. H. Kalubarme, “Agriculture land suitability evaluation for wheat cultivation using geomatics for Patan District, India,” Int. J. Agric. Resour. Gov. Ecol., vol. 13, no. 1, pp. 91–108, 2017, doi: 10.1504/IJARGE.2017.084038.

[10] S. S. Hussain and M. Mudasser, “Prospects for wheat production under changing climate in mountain areas of Pakistan – An econometric analysis,” Agric. Syst., vol. 94, no. 2, pp. 494–501, May 2007, doi: 10.1016/J.AGSY.2006.12.001.

[11] “Evaluating Future Climate Projections in Upper Indus Basin through GFDL-ESM2M Model | International Journal of Innovations in Science & Technology.” Accessed: Nov. 23, 2023. [Online]. Available: https://journal.50sea.com/index.php/IJIST/article/view/553/1079

[12] N. Naz and H. Rasheed, “Modeling the Land Suitability using GIS and AHP for Cotton Cultivation in Punjab, Pakistan,” Pakistan J. Sci. Ind. Res. Ser. A Phys. Sci., vol. 59, no. 2, pp. 96–108, Jun. 2016, doi: 10.52763/PJSIR.PHYS.SCI.59.2.2016.96.108.

[13] S. Roholla Mousavi, F. Sarmadian, Z. Alijani, and A. Taati, “Land suitability evaluation for irrigating wheat by Geopedological approach and Geographic Information System: A case study of Qazvin plain, Iran,” Eurasian J. Soil Sci., vol. 6, no. 3, pp. 275–284, Jul. 2017, doi: 10.18393/EJSS.297251.

[14] M. Waleed, M. Sajjad, M. S. Shazil, M. Tariq, and M. T. Alam, “Machine learning-based spatial-temporal assessment and change transition analysis of wetlands: An application of Google Earth Engine in Sylhet, Bangladesh (1985–2022),” Ecol. Inform., vol. 75, p. 102075, Jul. 2023, doi: 10.1016/J.ECOINF.2023.102075.

[15] R. E. Kennedy et al., “Implementation of the LandTrendr Algorithm on Google Earth Engine,” Remote Sens. 2018, Vol. 10, Page 691, vol. 10, no. 5, p. 691, May 2018, doi: 10.3390/RS10050691.

[16] M. Imran, K. Sumra, N. Abbas, and I. Majeed, “Spatial distribution and opportunity mapping: Applicability of evidence-based policy implications in Punjab using remote sensing and global products,” Sustain. Cities Soc., vol. 50, p. 101652, Oct. 2019, doi: 10.1016/J.SCS.2019.101652.

[17] I. Mazhar, A. Hamid, and S. Afzal, “Groundwater quality assessment and human health risks in Gujranwala District, Pakistan,” Environ. Earth Sci., vol. 78, no. 22, pp. 1–12, Nov. 2019, doi: 10.1007/S12665-019-8644-Y/METRICS.

[18] A. Tariq, S. Siddiqui, A. Sharifi, and S. H. I. A. Shah, “Impact of spatio-temporal land surface temperature on cropping pattern and land use and land cover changes using satellite imagery, Hafizabad District, Punjab, Province of Pakistan,” Arab. J. Geosci. 2022 1511, vol. 15, no. 11, pp. 1–16, May 2022, doi: 10.1007/S12517-022-10238-8.

[19] D. Bhatt, S. Maskey, M. S. Babel, S. Uhlenbrook, and K. C. Prasad, “Climate trends and impacts on crop production in the Koshi River basin of Nepal,” Reg. Environ. Chang., vol. 14, no. 4, pp. 1291–1301, Dec. 2014, doi: 10.1007/S10113-013-0576-6/FIGURES/5.

[20] S. Ara, M. A. U. J. Alif, and K. M. A. Islam, “Impact of Tourism on LULC and LST in a Coastal Island of Bangladesh: A Geospatial Approach on St. Martin’s Island of Bay of Bengal,” J. Indian Soc. Remote Sens., vol. 49, no. 10, pp. 2329–2345, Oct. 2021, doi: 10.1007/S12524-021-01389-4/METRICS.

[21] W. Zhao and S. B. Duan, “Reconstruction of daytime land surface temperatures under cloud-covered conditions using integrated MODIS/Terra land products and MSG geostationary satellite data,” Remote Sens. Environ., vol. 247, p. 111931, Sep. 2020, doi: 10.1016/J.RSE.2020.111931.

[22] J. Więckowski and W. Sałabun, “Sensitivity analysis approaches in multi-criteria decision analysis: A systematic review,” Appl. Soft Comput., vol. 148, p. 110915, Nov. 2023, doi: 10.1016/J.ASOC.2023.110915.

[23] D. Yadav, H. Dem, J. Paulo Costa, S. A. Gallo, and J. Maheut, “Multi-Criteria Analysis for the Evaluation of Urban Freight Logistics Solutions: A Systematic Literature Review,” Math. 2023, Vol. 11, Page 4089, vol. 11, no. 19, p. 4089, Sep. 2023, doi: 10.3390/MATH11194089.

[24] E. A. Njoku, P. E. Akpan, A. E. Effiong, and I. O. Babatunde, “The effects of station density in geostatistical prediction of air temperatures in Sweden: A comparison of two interpolation techniques,” Resour. Environ. Sustain., vol. 11, p. 100092, Mar. 2023, doi: 10.1016/J.RESENV.2022.100092.

[25] Z. Ijaz, C. Zhao, N. Ijaz, Z. ur Rehman, and A. Ijaz, “Development and optimization of geotechnical soil maps using various geostatistical and spatial interpolation techniques: a comprehensive study,” Bull. Eng. Geol. Environ., vol. 82, no. 6, pp. 1–21, Jun. 2023, doi: 10.1007/S10064-023-03244-X/METRICS.