E-ISSN:2709-6130
P-ISSN:2618-1630

Research Article

International Journal of Innovations in Science & Technology

2023 Volume 5 Number 4 Oct-Dec

Investigating Deep Learning Methods for Detecting Lung Adenocarcinoma on the TCIA Dataset

Jabbar. R1, Zai. S1, Jawaid. M1, Ahsan. M1

1 Mehran University of Engineering and Technology

Abstract
Lung cancer, one of the deadliest diseases worldwide, can be treated, where the survival rates increase with early detection and treatment. CT scans are the most advanced imaging modality in clinical practices. Interpreting and identifying cancer from CT scan images can be difficult for doctors. Thus, automated detection helps doctors to identify malignant cells. A variety of techniques including deep learning and image processing have been extensively examined and evaluated. The objective of this study is to evaluate different transfer learning models through the optimization of certain variables including learning rate (LR), batch size (BS), and epochs. Finally, this study presents an enhanced model that achieves improved accuracy and faster processing times. Three models, namely VGG16, ResNet-50, and CNN Sequential Model, have undergone evaluation by changing parameters like learning rate, batch size, and epochs and after extensive experiments, it has been found that among these three models, the CNN Sequential model is working best with an accuracy of 94.1% and processing time of 1620 seconds. However, VGG16 and ResNet50 have 95.0% and 93% accuracies along with processing times of 5865 seconds and 9460 seconds, respectively.

Keywords: Adenocarcinoma, Lung Cancer, Convolutional Neural Network, Accuracy, Detection.

Corresponding Author How to Cite this Article
Rafia Jabbar, Mehran University of Engineering and Technology
Rafia Jabbar, Sammer Zai, Moazzam Jawaid, M. Ahsan, Investigating Deep Learning Methods for Detecting Lung Adenocarcinoma on the TCIA Dataset. IJIST. 2023 ;5(4):746-759 https://journal.50sea.com/index.php/IJIST/article/view/597

Introduction

Cancer is characterized by uncontrolled cellular proliferation that can spread. Benign cancer is easily treated and does not metastasize, but cancer is difficult to cure and spreads to other anatomical places. Inheritance can cause cancer due to genetic changes that affect cell growth and division. There are around 100 cancer forms, usually categorized by organ or tissue origin. For instance, lung cancer is lung cancer [1]. With over 238,340 cases in the US, lung cancer is common. Two main risk factors affect lung cancer. It starts with smoking, which causes 80% of lung cancer deaths. Nonsmokers account for 20% of lung cancer mortality. Another consideration is radon gas exposure [2]. The highest cancer-related mortality rates are for lung cancer in both men and women [3]. However, early disease detection and treatment can reduce mortality and morbidity [4].

Lung cancer can be classified into two main types: Non-Small Cell Lung Cancer (NSCLC) and Small Cell Lung Cancer (SCLC). The majority of lung cancer cases, specifically around 80-85%, are classified as NSCLC, whereas a smaller proportion, approximately 12-15%, are categorized as SCLC [5]. Adenocarcinoma is a subtype of NSCLC, which is the predominant form of lung cancer and accounts for approximately 40% of cases. Typically, this phenomenon manifests in the peripheral regions of the lungs and is frequently observed within scar tissue or regions characterized by persistent inflammation [6].

Various medical imaging modalities assist radiologists in the diagnosis of lung cancer. Among the several medical imaging modalities, Computed Tomography (CT) exhibits some notable advantages, such as its ability to accurately determine the size, location, characterization, and growth of lesions, hence enabling the identification of lung cancer and nodules [5]. Nevertheless, it is important to acknowledge that these methodologies do possess certain limitations, such as a tendency to produce a significant number of false positives, as well as an inability to autonomously identify lesions. Multiple computer-aided design (CAD) systems have been devised for lung cancer diagnosis. Typically, these systems encompass three primary stages: data collecting and pre-processing, training, and testing.

As previously stated, lung adenocarcinoma accounts for around 40% of all cases of lung cancer and is typically diagnosed in individuals between the ages of 30 and 70. Nevertheless, it is imperative to develop a distinct model specifically designed to detect this particular type of cancer with enhanced precision and reduced time.

Literature Review:

Lung cancer CADs analyze volumetric thoracic CT nodules. Lung nodules, and granulomas, may assist in diagnosing lung cancer. The key lung nodule analysis steps are detection and segmentation. Location and identification of nodules in CT scans using approximate coordinates reduces segmentation work and radiological screening provides an accurate voxel-wise nodule form presentation for pathological diagnosis [7]. The primary modality employed for lung cancer screening is the CT scan because CT scanning is a diagnostic imaging technique employed in the field of radiology to get highly detailed images of internal organs, soft tissues, blood vessels, and skeletal structures without the need for intrusive procedures [8].

There are numerous ways to use segmentation for accurate diagnosis of lung cancer. Multiple segmentation techniques were used in [9] such as Edge detection, thresholding (simple, otsu, etc.), marker-controlled watershed segmentation, and PDE-based segmentation to have a comparative analysis. Many researchers have used thresholding such as in [10] researchers have employed a standard adaptive thresholding approach to obtain lung ground truth from CT volume. Similarly, in [11] authors have identified lung regions using global thresholding, and then removed thin structures morphological reconstruction. In [12] thresholding and a section of interest are used for segmentation. This thresholding converts RGB images into black and white or binary colors where pixels in binary images are described as 1 and 0. This mainly helps in the data extraction from normal images.

Various classification models are used for the detection of lung cancer such as CNN, VGG16, and ResNet50. However, to the author’s knowledge, no author has compared these three models in their study. In [10] CNN is comprised of four main components: two encoders (one for each modality), a co-learning and fusion component, and a reconstruction component. The two encoders use an axial 2D picture slice to produce image attributes relevant to each imaging modality. The co-learning component leverages encoder-produced modality-specific information to create a spatially variable fusion map to weight them at different locations. Finally, reconstruction incorporates modality-specific fused features across various. In [13] authors have constructed a lightweight CNN model to distinguish three lung cancer types. The architecture has two convolutional layers, four max-pooling layers, batch normalization, dropout, flatten, dense, and SoftMax layers. After layer adjustments, the model structure was found. Compared to transfer learning models, the suggested model has fewer parameters.

Authors in [14] have utilized VGG16 to obtain features from lung cancer images. The model comprises the convolution layers that have 64, 128, 256, 512, and 512 filters, respectively, with max pooling. The output is flattened to get features. In [15] researchers have utilized VGG16 which extracts high-level characteristics from histopathology images to detect lung cancer. Pre-trained VGG16 was used since it has learned broad features helpful for many computer vision tasks. Moreover, authors in [16] developed a system that combines deep feature extraction with standard HOG features using a modified ResNet50 model and transfer learning technique. In [17], the study uses 50-layer ResNet50. Using two 1 × 1 layers instead of 3 × 3 layers in VGG for dimension adjustment reduces the number of parameters needed, improving training efficiency. However, ResNet50 has very low accuracy.

Objectives:

This research investigates and analyzes the performance of three models namely the CNN sequential model, VGG16, and ResNet50 that have been trained on the publicly available dataset of lung adenocarcinoma namely the TCIA dataset to contribute to the development of the CAD system.

Novelty Statement:

There is no such study that makes a comparison of all three models namely, VGG16, ResNet50, and CNN Sequential on the same dataset that is TCIA dataset for the detection of specifically lung adenocarcinoma disease. Therefore, this study presents an effective and detailed comparative analysis that may help clinicians in the selection of an efficient model for the detection of lung adenocarcinoma disease.

Material and Method

The early identification of cancer is a crucial factor in halting the proliferation and growth of cancerous cells. To facilitate the detection of the specific disease, it is important to initially delineate the targeted location for the detection process. Hence, the objective of this investigation is to identify anomalous regions inside the lungs, subsequently proceeding to demarcate the space occupied by the lungs. The schematic representation of the suggested methodology's sequential process is depicted in Figure 1. However, the future sub-sections will provide detailed information regarding each step outlined in the block diagram depicted in Figure 1. The aforementioned procedures were executed on a publicly accessible CT dataset to diagnose lung cancer.

Figure 1 shows the proposed methodology followed in this research. At first, the raw data was collected online in the. dcm which was further preprocessed to convert it into .png format to further train it on different deep learning models and compare the results with the given ground truth. It is further discussed below in detail.

Figure 1: Flow Chart of the Proposed Methodology

Dataset and its Preprocessing:

The dataset utilized in this study comprises 363 CT scans of patients, encompassing 54 instances of lung cancer. The photos have a resolution of 512 by 512 pixels. The proposed methodology has been extensively implemented on a total of 1780 photos, which were carefully picked from the TCIA dataset. This dataset comprises 1170 images featuring lung nodules, while the remaining 610 images do not exhibit any lung nodules. These photographs are representative of individuals from various age cohorts and diverse gender identities. The database contains manually annotated ground truth data for both lungs in the TCIA dataset's CT scans, specifically for quantification. To locate nodules, the positions of the discovered nodules were compared to the positions indicated in the clinical information that accompanied the CT scans from the TCIA dataset. The findings indicate that this strategy has shown significant superiority.

The data was collected from publicly available datasets from [18][19] The dataset was obtained in CT's original 3D format namely DICOM which was viewed in Radiant Dicom Viewer. After that, the DCM format was viewed in MATLAB and converted each slice into .mat format to further process with it. Before proceeding with enhancement, the initial input image which is in DICOM format undergoes a conversion process to the PNG format. Subsequently, a conversion from the RGB color space to a grayscale representation is performed. In this study, a known filter such as structure from motion (SFM) was employed to convert the 3D DICOM format into 2D PNG format.

Segmentation Process:

The subsequent stage of the suggested methodology involves the execution of binarization. To proceed, the filtered image acquired in the preceding section is transformed into a binary image through the utilization of thresholding. This process involves assigning two distinct levels to pixels based on whether they fall below or above a predetermined threshold value. Medical image segmentation is a highly effective technique utilized to separate anatomical features from medical images. This technique involves the division of image pixels into binary values of 0s and 1s, based on the intensity levels of the original image. The criteria for thresholding is denoted as in equation 1, where f(x,y) and g(x,y) represent the input and output picture, respectively, and T indicates the threshold value [19].

Additionally, a region-based segmentation approach was employed to partition the entire lung CT scan into distinct regions, facilitating the extraction of the region of interest (ROI).

Nodule Detection:

The timely identification of nodules, regardless of their benign or malignant nature, on a chest X-ray or CT scan has the potential to enhance the patient's likelihood of life. The retrospective study of CT scans in a lung cancer screening program for heavy smokers revealed that around 90% of peripheral lung malignancies were detectable. Therefore, it is imperative to enhance the identification of nodules in radiographic pictures of the lungs. Lastly, the firangi filter was applied to identify and detect the presence of nodules within the scan [20][21][22]. Figure 2 shows an algorithm for the Frangi filter to enhance the tubular structures in the lungs and Figure 3 shows the input data in the .png format and after the processing.

Figure 2: Algorithm to Enhance the Tubular Structures in the Lungs.

Data Enrichment:

To increase the dataset for testing the correctness of our models, we adopt a methodology that involves expanding the dataset through the application of various picture enhancement techniques. These techniques include rotation, flipping, cropping, scaling, shear, and zoom.

Following the typical practice of data analysis, the dataset is partitioned into separate training and testing subsets. The dataset is divided into two subsets: a training dataset, which comprises 80% of the data, and a testing dataset, which comprises the remaining 20%. The trained model is then applied to the testing dataset to evaluate.

Figure 3: Lungs Data a) represents the image at the initial stage and b) represents the image after preprocessing.

Tunning of the Model:

After performing data enrichment, the last step is to fine-tune the specific parameters for classification models specifically VGG16, ResNet50, and CNN Sequential. Table 1 shows the overall parameters settings for three models used for classifying adenocarcinoma disease in lungs. The parameters including epoch number, learning rate (LR), and batch size (BS) are set for all three models namely VGG16, ResNet50, and CNN Sequential as shown in Table 1. Where, epoch number is defined as the total number of training data iterations made in a single cycle for the machine learning model, learning rate (LR) is known as the amount of model weight updated during training, and batch size (BS) is known as the number of images trained in one iteration [23].

After considering the computing requirements and the characteristics of the dataset, a set of models has been chosen for training purposes. Subsequently, a sequential model utilizing a convolutional neural network (CNN) was constructed to conduct a comparative analysis with the outcomes derived from the transfer learning models.

Table 1: Selected models along with LR, BS, and Epochs

The reason for the selection of three models namely, VGG16, CNN Sequential Model, and ResNet50 lies in the fact that they are widely used in the literature [13][14][15][17][20][24][25][26][27][28][29][30][31][32][33][34][35][36]. The VGG 16 model is widely employed in the field of image processing and classification due to its high efficiency in deep learning applications [14][30]. The architecture of VGG16 is shown in Figure 3 where it can be seen clearly that the architecture of the model is comprised of 16 convolutional layers and three fully connected layers. Convolutional layers are responsible for aggregating and extracting relevant information from input images, whereas fully connected layers are utilized for the ultimate classification task.

Figure 4: Architecture of VGG 16

The second model used in this study is Residual Network (ResNet) which is a CNN model incorporating a residual mapping technique [17]. A demonstration of the residual mapping is shown in Figure 4.

Figure 5: Residual Mapping Structure

The ResNet50 architecture is composed of 50 hidden layers. The network possesses a layer of greater depth in comparison to Google Net. The enhanced depth of the network facilitates accurate data detection [16][31][32][35][36] ResNet-50 consists of five convolutional blocks placed on top of one another as shown in Figure 5.

Figure 6: ResNet50 Network Model

The third model used by this study is CNN Sequential which is constructed using the sequential class, with layers being added sequentially. In this paradigm, each layer is composed of a single input and a single output, and these layers are layered together to create the total network [24][25], and [10] as shown in Figure 6.

Figure 7: CNN Sequential Network Model

Furthermore, the performance measures including accuracy, precision, recall, and f1 score of the proposed method have been computed with the help of (2), (3), (4), and (5), respectively to exhibit the performance of the proposed criteria.

In all of these equations, true positive (TP), false positive (FP), true negative (TN), and false negative (FN) are defined as TP = pixels correctly segmented as foreground, FP= pixels falsely segmented as foreground, TN= pixels correctly detected as background, and FN= pixels false detected as background.

Result and Discussion

Various software applications were utilized throughout this investigation on Lenovo Legion 5 with 16GB RAM and an RTX 2060 processor. Initially, the MATLAB software was employed to convert the original CT scans, which were in DICOM format, into PNG to conduct image processing on the raw data. In contrast, Visual Studio Code was utilized for the examination of the annotations provided, which were in XML format. All of the models were implemented using the Python programming language within the Google Colaboratory (COLAB) environment. Various libraries were employed, including numpy, keras, tensorflow, and computer vision. The dataset was partitioned into training and testing subsets using the split method. Before this, image augmentation techniques were used for the entire dataset to augment the number of scans, hence enhancing the accuracy of the findings obtained.

During the initial phase, a dataset consisting of approximately 1780 CT scans of patients was utilized, exhibiting a lower level of accuracy. However, as a result of employing data augmentation techniques, we were able to not only expand our dataset but also improve accuracy. To evaluate the efficiency of the proposed approach, this study utilizes the publicly accessible TCIA Database as a source of data [37][18]. At first, the dataset was in the DCM format which was viewed in Radiant DICOM Viewer [38] as it was in 3D format. After that the. dcm format was viewed in MATLAB to convert it into. mat format for further processing.

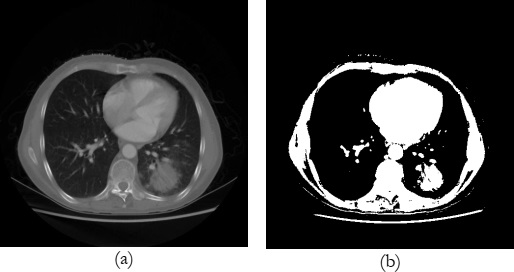
An example of the original and its preprocessed image is shown in Figure 7 where, figure 7(a) shows the original image of the randomly selected patient’s lungs and Figure 7(b) exhibits the scan of the same patient after applying thresholding to separate the lungs region with cancer from other things such as bones, muscles, etc.

Figure 8: (a) original image of the selected patient’s lung and (b) patient scan after applying a threshold.

After thresholding, region-based segmentation has been applied to the image shown in Figure 7(b) which is obtained after thresholding to extract out the region of interest (ROI) i.e., lungs. The extracted region of the lungs is shown in Figure 8(a) by purple bounding box.

Figure 9: (a) scan before extracting the ROI and (b) extracted and zoomed region of interest (ROI).

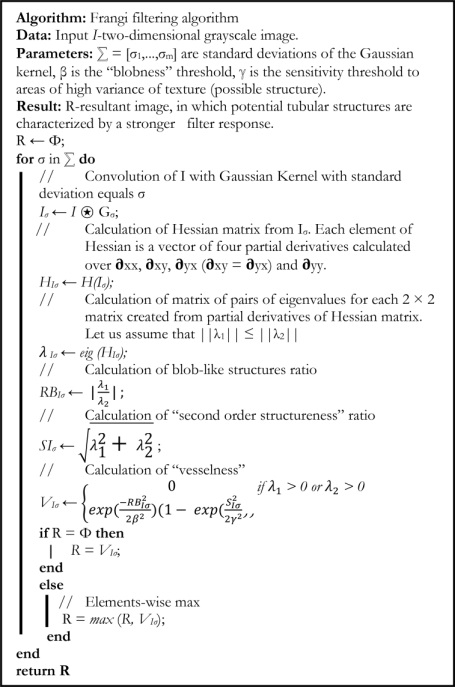
However, Figure 8(b) shows the zoomed and cropped version of the highlighted area specified by the purple bounding box in Figure 8(a). To enhance the lung region more clearly, this study employs the Frangi filter which has been discussed in detail in the methodology’s section, to extract only the lung region as shown in Figure 9.

Figure 10: Lungs Region with Adenocarcinoma Cancer.

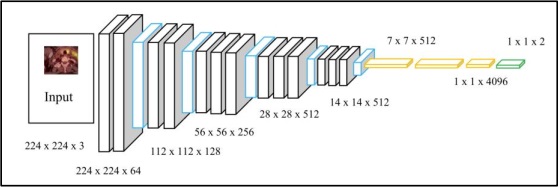
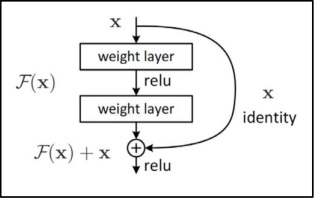
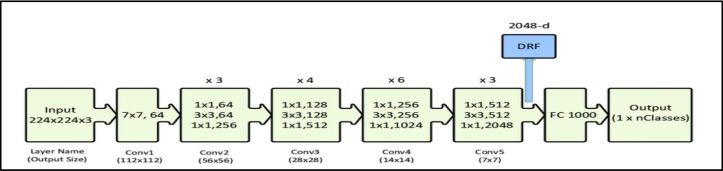
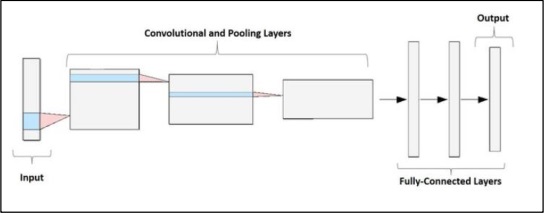
Once the region of interest (ROI) has been identified, they are further divided into two cases i.e., normal, and cancerous on the basis of the information provided by the ground truths inside the publicly available dataset. After the division of the dataset, three tuned deep learning models including VGG16, ResNet50, and CNN Sequential as described in the methodology’s section are applied to the extracted lungs portion one after another. To check the performance of these models, the performance parameters, accuracy, loss, precision, f1 score, and recall were calculated using eq (2), (3), (4), and (5) and are plotted separately for all of the three models and discussed according in the upcoming section.

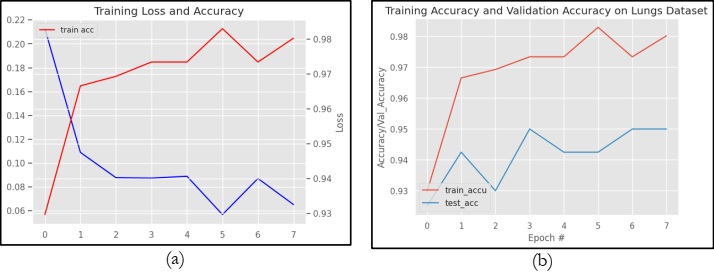
Figure 10 graphically represents the performance of VGG16 in terms of Loss and accuracy. However, figure 10(a) specifically shows the training loss and accuracy on the TCIA dataset. Whereas Figure 10(b) shows the training accuracy and validation accuracy on the same dataset. It can be observed from Figure 10(a) that VGG16 obtains a higher training accuracy of 98.02% and a training loss of 20.0%. Figure 10(b) clearly shows that the model VGG16 obtains training and testing accuracy of 98.0% and 95.0%, respectively.

Figure 11: (a) shows the graph between training loss and accuracy of VGG16 and (b) shows the training and testing accuracy graph of VGG16.

Similarly, figure 11 graphically represents the performance of ResNet50 in terms of loss and accuracy. However, figure 11(a) specifically shows the training loss and accuracy on the TCIA dataset. Whereas Figure 11(b) shows the training accuracy and validation accuracy on the same dataset. It can be observed from Figure 11(a) that ResNet50 obtains a training accuracy of 96.4% and a training loss of 13.8%. Figure 12(b) clearly shows that the model VGG16 obtains training and testing accuracy of 96.4% and 93.0%, respectively.

Figure 12: (a) shows the graph between training loss and accuracy of ResNet50 and (b) shows the training and testing accuracy graph of ResNet50.

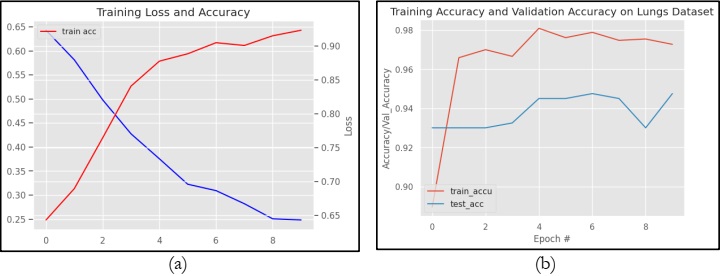
Likewise, figure 12 graphically represents the performance of the CNN Sequential Model in terms of loss and accuracy. However, figure 12(a) specifically shows the training loss and accuracy on the TCIA dataset. Whereas Figure 12(b) shows the training accuracy and validation accuracy on the same dataset. It can be observed from Figure 12(a) that the CNN Sequential model obtains a training accuracy of 97.5% and a training loss of 65%. Figure 12(b) clearly shows that the model VGG16 obtains training and testing accuracy of 97.5% and 94.1%, respectively.

Figure 13: (a) shows the graph between training loss and accuracy of the CNN Sequential Model and (b) shows the training and testing accuracy graph of the CNN Sequential Model.

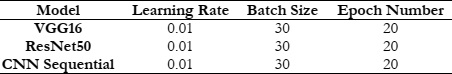
After performing training and testing of the dataset on three different models VGG16, ResNet50, and CNN Sequential, the tuned models are implemented on the testing datasets with fine-tuned parameters as described in Table 1. For testing, the performance measures including accuracy, precision, recall, and f1 score are computed using eq (2), (3), (4), and (5), and a pictorial representation of these measures is displayed in Figure 13.

In Figure 13, three different colors blue, orange, and gray are used to describe the performance of the three models, VGG16, ResNet50, and CNN Sequential, respectively. By looking at the graphical result exhibited in Figure 13, it can be observed clearly that the model VGG16 has obtained a higher precision rate as compared to ResNet50 and CNN Sequential. However, the f1 score is comparative for VGG16 and CNN Sequential, whereas ResNet50 has quite a low f1 score as compared to that of the other two models namely, VGG16 and CNN Sequential. For recall, it can be observed that the models VGG16 and CNN Sequential are exhibiting comparative performance, whereas ResNet50 has quite low recall as compared to VGG16 and CNN Sequential. Similarly, for accuracy, it is quite clear from Figure 13 that VGG16 has higher accuracy among all. Although this accuracy seems a little higher than that of the CNN Sequential but may be considered high when it comes to performance comparison.

Figure 14: Comparison between performance measures obtained.

It can be concluded from the overall experimentation that VGG16 performs almost similar to that of the CNN Sequential model. However, the model RestNet50 shows lower performance on the TCIA dataset. This is because VGG16 is very slow to train as compared to CNN Sequential model and ResNet50 is slow to train because of its complexity as compared to other models such as VGG16 and CNN Sequential model.

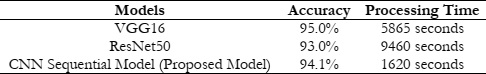
To further analyze the performance of the three models VGG16, ResNet50, and CNN Sequential this study also provides the comparison in terms of processing time which is shown in Table 2. It can be observed from Table 2, that VGG16 has having highest accuracy at the cost of more processing time of 5865 seconds. However, the CNN Sequential Model obtains a similar accuracy with less processing time of 1620 seconds as shown in Table 2 with a little difference in accuracy as compared to VGG16 which is acceptable. This is because of its ability to learn its distinctive features by itself also this model is computationally efficient. Hence, it may be concluded that the overall CNN Sequential model is performing best in terms of accuracy and processing time specifically for the classification of lung adenocarcinoma disease in the TCIA dataset.

Table 2: Accuracy and Processing time of VGG16, ResNET50, and CNN Sequential Model

This study mainly focuses on analyzing the deep learning models on a single dataset. In the future, it may be implemented on more challenging multiple datasets and the real dataset as well to check its efficiency, accuracy, and robustness on the other dataset as well.

Conclusion

This research has shown an efficient and robust algorithm for the diagnosis of NSCLC namely lung adenocarcinoma which will be helpful for clinicians to automatically detect and classify the lung adenocarcinoma disease timely and accurately. The proposed study has performed a sequence of steps including data preprocessing, segmentation, nodule detection, data enrichment, and classification by employing fine-tuned models namely VGG16, ResNet50, and CNN Sequential on publicly available challenging datasets namely TCIA. Finally, extensive experimentation has been carried out to check the performance of the proposed study by using various performance metrics for the evaluation of the results. It is found from the results that the CNN Sequential model is performing best amongst all three models namely VGG16, ResNet50, and CNN Sequential with an accuracy of 94.1% and a processing time of 1620 seconds. However, VGG16 and ResNet50 were found to have an accuracy of 95% and 93%, respectively along with longer processing times of 5865 seconds and 9460 seconds.

Acknowledgment:

The writers express their gratitude to Mehran University of Engineering & Technology, Jamshoro, for lending us the tools required to carry out this study.

Conflict of interest:

The authors declare no conflict of interest in publishing this manuscript in IJIST.

Author’s Contribution:

Every author has contributed equally to this research.

Project details: Nil

Reference

[1] “What Is Cancer? - NCI.” Accessed: Dec. 18, 2023. [Online]. Available: https://www.cancer.gov/about-cancer/understanding/what-is-cancer

[2] “Lung Cancer Facts 2023 - Lung Cancer Research Foundation.” Accessed: Dec. 18, 2023. [Online]. Available: https://www.lungcancerresearchfoundation.org/lung-cancer-facts/

[3] “Automatic nodule detection for lung cancer in CT images: A review. Computers in Biology and Medicine | 10.1016/j.compbiomed.2018.10.033.” Accessed: Dec. 18, 2023. [Online]. Available: https://sci-hub.se/10.1016/j.compbiomed.2018.10.033

[4] S. Makaju, P. W. C. Prasad, A. Alsadoon, A. K. Singh, and A. Elchouemi, “Lung Cancer Detection using CT Scan Images,” Procedia Comput. Sci., vol. 125, pp. 107–114, Jan. 2018, doi: 10.1016/J.PROCS.2017.12.016.

[5] L. Wang, “Deep Learning Techniques to Diagnose Lung Cancer,” Cancers 2022, Vol. 14, Page 5569, vol. 14, no. 22, p. 5569, Nov. 2022, doi: 10.3390/CANCERS14225569.

[6] S. S. Bhimji and J. M. Wallen, “Lung Adenocarcinoma,” StatPearls, Jun. 2023, Accessed: Dec. 18, 2023. [Online]. Available: https://www.ncbi.nlm.nih.gov/books/NBK519578/

[7] Y. Feng, P. Hao, P. Zhang, X. Liu, F. Wu, and H. Wang, “Supervoxel based weakly-supervised multi-level 3D CNNs for lung nodule detection and segmentation,” J. Ambient Intell. Humaniz. Comput., pp. 1–11, Mar. 2019, doi: 10.1007/S12652-018-01170-5/METRICS.

[8] S. Balannolla, A. Kousar Nikhath, and S. Yeruva, “Detection and Classification of Lung Carcinoma using CT scans,” J. Phys. Conf. Ser., vol. 2286, no. 1, p. 012011, Jul. 2022, doi: 10.1088/1742-6596/2286/1/012011.

[9] P. Tripathi, S. Tyagi, and M. Nath, “A Comparative Analysis of Segmentation Techniques for Lung Cancer Detection,” Pattern Recognit. Image Anal., vol. 29, no. 1, pp. 167–173, Jan. 2019, doi: 10.1134/S105466181901019X/METRICS.

[10] A. Kumar, M. Fulham, D. Feng, and J. Kim, “Co-Learning Feature Fusion Maps from PET-CT Images of Lung Cancer,” IEEE Trans. Med. Imaging, vol. 39, no. 1, pp. 204–217, Jan. 2020, doi: 10.1109/TMI.2019.2923601.

[11] M. K. N. R. A. Aenney, G. Bishwabidyalay, M. A. Rahman, “Detection of Lung Nodules using Image Processing Techniques,” 2019.

[12] R. Gasparri et al., “Detection of Lung cancer using Digital image Processing techniques and Artificial Neural Networks,” J. Phys. Conf. Ser., vol. 2327, no. 1, p. 012078, Aug. 2022, doi: 10.1088/1742-6596/2327/1/012078.

[13] Tasmim et al., “A Lightweight-CNN Model for Efficient Lung Cancer Detection and Grad-CAM Visualization,” pp. 254–258, Nov. 2023, doi: 10.1109/ICICT4SD59951.2023.10303569.

[14] A. K. Swain, A. Swetapadma, J. K. Rout, and B. K. Balabantaray, “Classification of NSCLC types using sparse deep neural network features,” Biomed. Signal Process. Control, vol. 87, p. 105485, Jan. 2024, doi: 10.1016/J.BSPC.2023.105485.

[15] V. Kapoor, A. Mittal, S. Garg, M. Diwakar, A. K. Mishra, and P. Singh, “Lung Cancer Detection Using VGG16 and CNN,” Proc. - 2023 IEEE World Conf. Appl. Intell. Comput. AIC 2023, pp. 758–762, 2023, doi: 10.1109/AIC57670.2023.10263901.

[16] P. M. Bruntha, S. I. A. Pandian, J. Anitha, S. S. Abraham, and S. N. Kumar, “A novel hybridized feature extraction approach for lung nodule classification based on transfer learning technique,” J. Med. Phys., vol. 47, no. 1, pp. 1–9, Jan. 2022, doi: 10.4103/JMP.JMP_61_21.

[17] Q. Zhang, H. Wang, S. W. Yoon, D. Won, and K. Srihari, “Lung Nodule Diagnosis on 3D Computed Tomography Images Using Deep Convolutional Neural Networks,” Procedia Manuf., vol. 39, pp. 363–370, Jan. 2019, doi: 10.1016/J.PROMFG.2020.01.375.

[18] K. Clark et al., “The cancer imaging archive (TCIA): Maintaining and operating a public information repository,” J. Digit. Imaging, vol. 26, no. 6, pp. 1045–1057, Dec. 2013, doi: 10.1007/S10278-013-9622-7/METRICS.

[19] “An Efficient Approach Towards Delineation of Lungs and Pulmonary Nodule Detection | Request PDF.” Accessed: Dec. 18, 2023. [Online]. Available: https://www.researchgate.net/publication/348447874_An_Efficient_Approach_Towards_Delineation_of_Lungs_and_Pulmonary_Nodule_Detection

[20] “Lung Cancer Detection of CT Lung Images.” Accessed: Dec. 18, 2023. [Online]. Available: https://www.researchgate.net/publication/333666243_Lung_Cancer_Detection_of_CT_Lung_Images

[21] “Lung Cancer Detection Based on CT Scan Images by Using Deep Transfer Learning | IIETA.” Accessed: Dec. 18, 2023. [Online]. Available: https://www.iieta.org/journals/ts/paper/10.18280/ts.360406

[22] T. Hachaj and M. Piekarczyk, “High-Level Hessian-Based Image Processing with the Frangi Neuron,” Electron. 2023, Vol. 12, Page 4159, vol. 12, no. 19, p. 4159, Oct. 2023, doi: 10.3390/ELECTRONICS12194159.

[23] M. Alamgeer et al., “Deep Learning Enabled Computer Aided Diagnosis Model for Lung Cancer using Biomedical CT Images,” Comput. Mater. Contin., vol. 73, no. 1, pp. 1437–1448, May 2022, doi: 10.32604/CMC.2022.027896.

[24] M. Sharma, J. Bhatt, M. Joshi Manu Sharma, J. S. Bhatt, and M. V Joshi, “Early detection of lung cancer from CT images: nodule segmentation and classification using deep learning,” https://doi.org/10.1117/12.2309530, vol. 10696, no. 13, pp. 226–233, Apr. 2018, doi: 10.1117/12.2309530.

[25] M. Jasmine Pemeena Priyadarsini et al., “Lung Diseases Detection Using Various Deep Learning Algorithms,” J. Healthc. Eng., vol. 2023, 2023, doi: 10.1155/2023/3563696.

[26] D. Z. Karim and T. A. Bushra, “Detecting Lung Cancer from Histopathological Images using Convolution Neural Network,” IEEE Reg. 10 Annu. Int. Conf. Proceedings/TENCON, vol. 2021-December, pp. 626–631, 2021, doi: 10.1109/TENCON54134.2021.9707242.

[27] W. Alakwaa, M. Nassef, and A. Badr, “Lung Cancer Detection and Classification with 3D Convolutional Neural Network (3D-CNN),” Int. J. Adv. Comput. Sci. Appl., vol. 8, no. 8, pp. 66–73, 2017, doi: 10.14569/IJACSA.2017.080853.

[28] M. Praveena, A. Ravi, T. Srikanth, B. H. Praveen, B. S. Krishna, and A. S. Mallik, “Lung Cancer Detection using Deep Learning Approach CNN,” 7th Int. Conf. Commun. Electron. Syst. ICCES 2022 - Proc., pp. 1418–1423, 2022, doi: 10.1109/ICCES54183.2022.9835794.

[29] V. G. Biradar, P. K. Pareek, K. S. Vani, and P. Nagarathna, “Lung Cancer Detection and Classification using 2D Convolutional Neural Network,” MysuruCon 2022 - 2022 IEEE 2nd Mysore Sub Sect. Int. Conf., 2022, doi: 10.1109/MYSURUCON55714.2022.9972595.

[30] T. T. Al-Shouka and K. M. A. Alheeti, “A Transfer Learning for Intelligent Prediction of Lung Cancer Detection,” AICCIT 2023 - Al-Sadiq Int. Conf. Commun. Inf. Technol., pp. 54–59, 2023, doi: 10.1109/AICCIT57614.2023.10217967.

[31] P. Ardimento, L. Aversano, M. L. Bernardi, and M. Cimitile, “Deep Neural Networks Ensemble for Lung Nodule Detection on Chest CT Scans,” Proc. Int. Jt. Conf. Neural Networks, vol. 2021-July, Jul. 2021, doi: 10.1109/IJCNN52387.2021.9534176.

[32] R. V. M. da Nóbrega, P. P. Rebouças Filho, M. B. Rodrigues, S. P. P. da Silva, C. M. J. M. Dourado Júnior, and V. H. C. de Albuquerque, “Lung nodule malignancy classification in chest computed tomography images using transfer learning and convolutional neural networks,” Neural Comput. Appl., vol. 32, no. 15, pp. 11065–11082, Aug. 2020, doi: 10.1007/S00521-018-3895-1/METRICS.

[33] I. D. Apostolopoulos et al., “Automatic classification of solitary pulmonary nodules in PET/CT imaging employing transfer learning techniques,” Med. Biol. Eng. Comput., vol. 59, no. 6, pp. 1299–1310, Jun. 2021, doi: 10.1007/S11517-021-02378-Y/METRICS.

[34] R. Indumathi and R. Vasuki, “Segmentation and Feature Extraction in Lung CT Images with Deep Learning Model Architecture,” SN Comput. Sci., vol. 4, no. 5, pp. 1–14, Sep. 2023, doi: 10.1007/S42979-023-01892-0/METRICS.

[35] P. Yuvarani, S. Hemalatha, S. Kaviya Sri, and P. Madhubala, “Analysis of Lungs CT Image Using Deep Learning Techniques,” 2023 9th Int. Conf. Adv. Comput. Commun. Syst. ICACCS 2023, pp. 1347–1352, 2023, doi: 10.1109/ICACCS57279.2023.10113003.

[36] R. V. M. Da Nóbrega, S. A. Peixoto, S. P. P. Da Silva, and P. P. R. Filho, “Lung Nodule Classification via Deep Transfer Learning in CT Lung Images,” Proc. - IEEE Symp. Comput. Med. Syst., vol. 2018-June, pp. 244–249, Jul. 2018, doi: 10.1109/CBMS.2018.00050.

[37] G. H. K. Bosmans, “CT-PET imaging of lung cancer patients for radiotherapy,” Jan. 2007, doi: 10.26481/DIS.20071220GB.

[38] and V. K. A. C. K. S, R. V Patil, “SEGEMENTATION AND PREDICTION FROM CT IMAGES FOR DETECTING LUNG CANCER”.