E-ISSN:2709-6130
P-ISSN:2618-1630

Research Article

International Journal of Innovations in Science & Technology

2024 Volume 6 Number 1 Jan-Mar

Effects of Filters in Retinal Disease Detection on Optical Coherence Tomography (OCT) Images Using Machine Learning Classifiers

Wali. A1, Sipani. A2

1 Department of Computer Science, Punjab University College of Information Technology (PUCIT), Lahore, Pakistan

2 William B Travis HS, Richmond, TX, United States

Abstract
Optical Coherence Tomography (OCT) is an essential, non-invasive imaging technique for producing high-resolution images of the retina, crucial in diagnosing and monitoring retinal conditions such as diabetic macular edema (DME), choroidal neovascularization (CNV), and DRUSEN. Despite its importance, there is a pressing need to enhance early detection and treatment of these common eye diseases. While deep learning methods have shown higher accuracy in classifying OCT images, the potential for machine learning approaches, particularly in terms of data size and computational efficiency, remains underexplored. This study presents different experiments for detect the retinal disease on publically available dataset of retinal optical coherence tomography (OCT) images using machine learning classifiers with the help of image feature extractions. It classifies the given retinal OCT images as diabetic macular edema (DME), choroidal neovascularization (CNV), DRUSEN and NORMAL. Firstly, it extracts image features using appropriate methods and then it is trained, after training it pass through machine learning classifiers to classify the given input images and then it is tested to get the better accuracy performance. The above steps are iterated by varying over the pre-processing techniques in which we first resize the image into 100 x 100 after resizing, we remove the noise by using Gaussian Blur and then normalize the image. We systematically benchmark its performance against established built-in methods, such as Histogram of Oriented Gradients (HOG), Local Binary Patterns (LBP), and Feature from Opponent Space for Filtering (FOSF). This comparative analysis serves to assess the efficacy of to find out the best approach in relation to these widely recognized methods. The proposed experiments based on these approaches reveals that the use of HOG on this dataset outperform with SVM classifier with maximum accuracy of 78.8%.

Keywords: Random Forest Classifier (RFC), Support Vector Machine (SVM), K-Nearest Neighbor (KNN), Machine Learning, Optical Coherence Tomography (OCT), Diabetic Macular Edema (DME), Choroidal Neovascularization (CNV), DRUSEN, NORMAL., Diabetic Retinopathy (DR), Age Related Macular Degeneration (AMD), Histogram of Oriented Gradients (HOG), Local Binary Patterns (LBP), Features from Opponent Space for Filtering (FOSF).

Corresponding Author How to Cite this Article
Asad Wali, Department of Computer Science, Punjab University College of Information Technology (PUCIT), Lahore, Pakistan
Asad Wali, Arjun Sipani, Effects of Filters in Retinal Disease Detection on Optical Coherence Tomography (OCT) Images Using Machine Learning Classifiers. IJIST. 2024 ;6(1):83-97 https://journal.50sea.com/index.php/IJIST/article/view/650

Introduction

Retinal disorders have recently emerged as a significant public health concern. These disorders typically develop slowly without obvious symptoms and affect millions of individuals worldwide each year. Retinal illnesses can manifest in various ways, with most causing visual impairments that can lead to blindness. Some of these include DR, CNV, drusen, glaucoma, macular holes, AMD, and optic nerve abnormalities. Therefore, early diagnosis and treatment are important for preventing blindness. OCT is a noninvasive imaging technique that uses light waves to create coherent images of the retina. By analyzing and quantifying the differences in diseased retinal layers, OCT serves as an effective diagnostic tool, enabling the detection and monitoring of retinal changes and optic nerve abnormalities over time.

OCT has found clinical applications in various medical fields including ophthalmology [1][2], cardiology [3][4], endoscopy [5][6], dermatology [7][8], and oncology [7][8]. In the realm of developmental biology, OCT has proven valuable for characterizing the morphological and functional development of organs such as the eyes [9], brain [10], limbs [11], reproductive organs [12], and the heart [3][10][13][14]. This versatile imaging technology plays a crucial role in advancing our understanding and diagnostic capabilities across a spectrum of medical disciplines, contributing to both clinical practice and research. As evidenced in the literature, OCT has exhibited promising outcomes in the diagnosis of retinal diseases, prompting our focus in this brief review. OCT offers a cross-sectional resolution of the soft tissues of the eye, enabling a noninvasive examination of the retina. More importantly, OCT is an important tool to visualize and evaluate the retina. It helps identify and evaluate many eye diseases, such as DME, glaucoma, and CNV [15][16]. Morphological features, such as the shape and distribution of drusen, macular holes, and blood vessels, can be easily detected on OCT images as indicators of disease. Therefore, OCT imaging is necessary for large-scale studies of changes in the retinal structures. Several techniques rely on the consistency of the OCT layers used to ensure accurate results [17].

Over the years, OCT technology has witnessed substantial advancements driven by innovations in light sources, detection systems, and signal-processing techniques. Swept-source OCT (SS-OCT) [18][19] and spectral-domain OCT (SD-OCT) [20] have significantly enhanced imaging speed and depth penetration, enabling the three-dimensional reconstruction of tissue architecture. Moreover, the integration of adaptive optics with OCT has opened new frontiers in correcting aberrations, providing unprecedented clarity in imaging the cellular structures of the retina.

This study aims to delve into recent developments and applications of OCT, with a specific emphasis on its role in advancing our understanding of retinal diseases and guiding clinical interventions. Machine learning is beneficial in analyzing OCT images, as it can efficiently detect and classify subtle pathological features, often surpassing manual analysis in both speed and accuracy. Additionally, advanced algorithms can learn from vast datasets of OCT images, enabling the early detection of diseases like AMD CNV, DRUSEN and DR, which are critical for timely treatment. We perform the experiments on different methods to find out the best methods that classify the OCT retinal diseases.

Literature Review:

Medical image processing is a crucial area of research, where researchers face several challenges such as artifact acquisition, segmentation, and feature extraction. In recent years, machine learning techniques [21] have been widely used to analyze OCT images, as demonstrated in several studies. Schmidt Erfurth et al. [22] conducted a study comparing unsupervised and supervised learning methods for binary classification in patients with AMD and DR, using a deep learning approach on a database of about 20,000 images. The research achieved up to 97% accuracy in distinguishing health and AMD. The team utilized a Deep Denoising Autoencoder (DDAE), trained on healthy samples, to identify features differentiating normal tissue from anomalies in SD-OCT scans. Additionally, they employed SVM for modeling normal probability distributions and a clustering technique to spot inconsistencies in the data. These identified categories were then assessed by retinal experts, with some matching known retinal structures while others were novel anomalies not previously associated with known structures. The study found that these novel categories were also linked to the disease, showcasing the potential of these methods in disease detection and classification.

Lee et al. [23] developed a 21-layer CNN to rank AMD disease and achieved a 93% accuracy in binary classification (AMD vs. normal). Kermany et al. [24] reported a CNN solution based on the Inception V3 model; using transfer learning, they achieved a 96.6% accuracy on data containing approximately 84,000 samples classified into drusen, CNV, and DME categories. Huang et al. [25] proposed a classification method based on the CNN method to classify normal retina, CNV, DME, or drusen, achieving an accuracy of 89.9%. Chowdhary et al. [26] proposed a fuzzy c-means segmentation and classification giving a final result at the 89.9%. Tsuji et al. [27] achieved 99.6% and 99.8% accuracy using the Capsule Network and InceptionV3, respectively. Finally, Prabhakaran proposed the OctNET model, which achieved 99.69% accuracy on the Kermany database, and is a relatively lightweight architecture capable of quick computations. G Latha and P Aruna Priya [28] focused on evaluating the effectiveness of various machine learning classifiers in detecting glaucoma in retinal images. Their proposed method combined Gabor transforms and efficient computational classification. A SVM, neural network, and adaptive neuro-fuzzy inference system (ANFIS) classifiers were used to evaluate the performance of the glaucoma retinal image classification system.

Zhou [29] introduced an automated system for detecting DR using a deep learning approach, involving two key stages: image preprocessing and deep learning classification. The preprocessing stage employed morphological operations, adaptive histogram equalization, and vessel segmentation to enhance image quality and reduce noise. For classification, the study utilized a pre-trained EfficientNet-B4 model, fine-tuned on a DR fundus image dataset, to categorize images into five levels of DR severity. Data augmentation techniques like random rotation, flipping, and cropping were applied to bolster the model's generalization capabilities. The system was tested on two public datasets, where it achieved high accuracy, surpassing existing state-of-the-art methods in DR detection.

Jian Li [30] developed a sophisticated deep learning system for detecting and classifying DR, consisting of four stages: initial image processing, image enhancement, subtraction, and classification. The process began with enhancing the quality of retinal images using morphological operations and contrast-limited adaptive histogram equalization (CLAHE), followed by binary thresholding for segmentation. The image enhancement stage utilized a dual attention mechanism to refine image quality by focusing on both channel and spatial relationships. The EfficientNet-B4 model was employed for feature extraction, which was fine-tuned on a DR fundus imaging dataset. The classification was conducted using a multiclass SVM classifier, categorizing images into five DR severity levels. The system's efficacy was validated on two public datasets, where it achieved high accuracy, outperforming existing state-of-the-art methods, and demonstrating its potential as a valuable tool in diagnosing and classifying diabetic retinopathy.

H. Fu [31] developed a deep-learning method for automatically diagnosing DR using fundus images, utilizing a dataset of 128,175 retinal images, with 88,744 for training and 39,431 for testing. The method is based on a 12-layer convolutional neural network and incorporates various data augmentation techniques like rotation, translation, and scaling to enhance performance and prevent overtraining. The method's effectiveness was assessed using metrics like accuracy, sensitivity, specificity, recall, and F1 score, achieving an impressive 92.9% accuracy, 93.5% sensitivity, and 92.5% specificity on the test data. It also demonstrated high precision, recall, and F1 scores, suggesting its capability to accurately identify DR with minimal false positives. Comparisons with five groups of experts revealed the system's superior accuracy, showcasing the potential of deep learning in diagnosing DR and its applicability as a useful tool for improving DR diagnosis, early detection, and treatment. S. W. Ting et al. [32] provides a comprehensive review of the advancements and applications of artificial intelligence and deep learning specifically within the field of ophthalmology. It likely covers the utilization of deep learning algorithms for tasks such as image analysis, disease detection, classification, and treatment planning in various ocular diseases. Additionally, it may discuss the potential impact of AI on improving diagnostic accuracy, patient outcomes, and healthcare delivery in ophthalmology. R. Gargeya and T. Leng [33] presents a study on the development and evaluation of a deep learning-based system for the automated identification of diabetic retinopathy. It likely includes details about the dataset used, the architecture of the deep learning model, training procedures, and performance evaluation metrics. Moreover, it may discuss the clinical implications of employing such automated systems for DR screening, including potential benefits in early detection and management of the disease. A. Lang et al. [17] focuses on the segmentation of retinal OCT images using a RFC. It likely describes the methodology of feature extraction, training of the classifier, and the segmentation process. Additionally, it may discuss the importance of accurate retinal segmentation in OCT imaging for clinical applications such as disease diagnosis, monitoring disease progression, and assessing treatment efficacy. Hwang et al. [34] also proposed a method based on the Inception V3 model with pre-processed images resulting in a 96.9%. Tasnim et al. [35] conducted research on utilizing deep learning techniques for analyzing retinal OCT images. Among the models they explored, MobileNetV2 achieved an accuracy of 99.17% when tested on the Kermany dataset [24], which consists of 84,484 samples categorized into four groups.

This study aims to bridge the existing research gap in the application of machine learning classification methods to OCT data. Our experiment focuses on finding out which methods will perform better on machine learning classifiers in terms of accuracy and time.

OCT Dataset:

In this study, we utilized the OCT dataset, as made available by Kermany et al. [24] on Kaggle for previous research. The dataset comprises a substantial collection of 84,484 images. However, owing to hardware limitations, we randomly selected a subset of 4,000 images from the training dataset, ensuring representation from each class. This subset includes 1,000 images per class, providing a manageable yet diverse sample for our investigation. The careful curation of this subset maintains a balance between dataset size and computational constraints, ensuring the feasibility of our experimental analysis.

Figure 1: Optical coherence tomography images in the OCT dataset [35].

Material and Method

This study presents a solution for disease classification based on OCT images. We emphasize that these solutions must be both effective and accurate.

Data Pre-Processing:

The machine and deep learning play an active role in different tasks. Preprocessing is an essential part of cleaning the dataset for effective results. For preprocessing, the OCT Dataset is imported from the directory. Each image is read from the corresponding folder of the dataset and then resized to a square shape with dimensions of 100 × 100 pixels. After resizing, Gaussian Blur is applied to remove noise from the images. Upon successful resizing and noise removal, each image, along with its corresponding class label ('CNV', 'DME', 'DRUSEN', or 'NORMAL'), is appended to the training data list.

Figure 2: OCT retinal disease detection approach

Data Normalization:

The pixel values are normalized by dividing each pixel by 255. This is a common preprocessing step for image data, as it scales the pixel values to a range of 0 to 1, which can help the model learn more efficiently. In this study, the data were split into training and testing sets.

Model Training:

The training-test split function randomly splits the data into training and testing sets. The default split was 80% for training and 20% for testing. Arrays are then passed as input to the function, which returns the training data and test data. The training dataset is used to train the machine learning model, while the testing dataset is used to evaluate the model's performance on unseen data.

Random Forest Classifier:

The RFC is a supervised machine-learning algorithm used for classification. It is an integrated learning process that creates multiple decision trees and combines their results to make predictions. The RFC has two stages: (i) random forest generation, and (ii) prediction based on the random forest classifier created in the first stage. The main idea behind the Random Forest approach is to create multiple decision trees, each training on a different set of training data and using different features. To build each decision tree, the algorithm randomly selects a set of training data and a set of features. It then uses these selected training data and features to create a decision tree. The algorithm considers the results of each decision tree in the forest when making predictions. For classification tasks, each tree in the forest predicts a list of input classes, and the final prediction is based on the majority vote across all the trees' predictions.

K-Nearest Neighbor:

KNN is a versatile and intuitive machine-learning algorithm used for classification and regression tasks. In the training phase, KNN stores the entire dataset in memory. When making predictions for a new instance, the algorithm calculates the distances between that instance and all the instances in the training set using a chosen distance metric, such as Euclidean or Manhattan distance. The next step involves selecting the top 'k' nearest neighbors based on these distances. For classification tasks, 'k' neighbors are chosen, and the class label for the new instance is determined by a majority voting mechanism. In other words, the class that is most prevalent among the 'k' neighbors is assigned to the new instance. The choice of 'k' is a crucial hyperparameter, influencing the model's sensitivity to noise and its ability to capture local patterns. Despite its simplicity, KNN has limitations, including the computational cost associated with calculating distances for each prediction and its sensitivity to irrelevant features. Moreover, in high-dimensional spaces, KNN may struggle without appropriate feature scaling. In a visual example with two classes, the algorithm considers the nearest neighbors of a new data point to classify it. The value of 'k' dictates the number of neighbors to consider, affecting the decision boundary and, consequently, the model's performance. While KNN is straightforward and easy to implement, practitioners need to be mindful of its strengths and weaknesses when applying it to different datasets and problem domains.

Figure 3: Random Forest Classifier Tree Diagram

Support Vector Machine:

SVM is a robust and versatile supervised learning algorithm widely utilized for classification tasks. At its core, SVM aims to identify an optimal hyperplane in the feature space that effectively separates different classes within the data. The fundamental principle is to maximize the margin, defined as the distance between the hyperplane and the nearest data points from each class, known as support vectors. This margin maximization not only ensures a clearer distinction between classes but also enhances the model's generalization to new, unseen data, making SVM particularly resilient to noise.

Support vectors, being the critical data points influencing the decision boundary, play a pivotal role in SVM. The algorithm strategically selects these support vectors, and the decision boundary is shaped based on their positions. Additionally, SVM can handle non-linear relationships within the data by employing kernel functions. These functions transform the input features into a higher-dimensional space, allowing SVM to find a hyperplane that corresponds to a more complex decision boundary in the original feature space. This flexibility makes SVM effective in scenarios where the relationship between features and classes is not linear.

Furthermore, SVM introduces a cost parameter (C) that regulates the trade-off between achieving a smooth decision boundary and minimizing misclassifications. A higher C value leads to a smaller margin but fewer misclassifications, while a lower C value prioritizes a larger margin even at the potential cost of a slightly higher misclassification rate. SVM's effectiveness extends to high-dimensional spaces, making it well-suited for applications in various domains, including image classification, text analysis, and biological data analysis. While SVM is a powerful algorithm, practitioners should carefully tune parameters like C and choose appropriate kernel functions based on the characteristics of the data at hand.

Result and Discussion

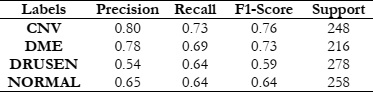
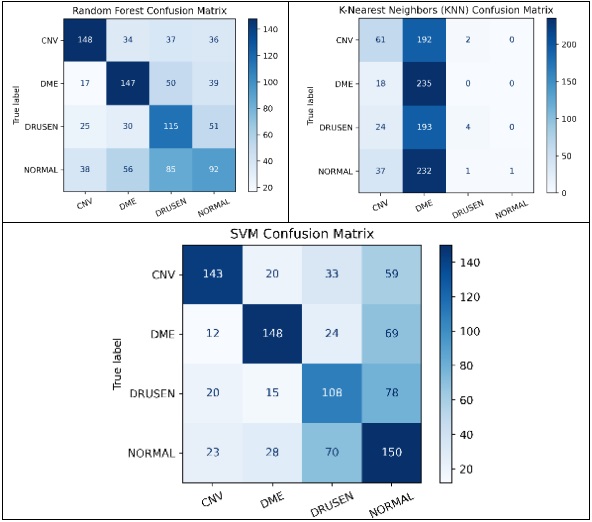
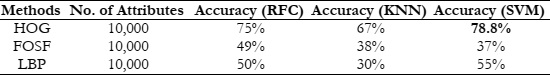
Our experiments revealed promising results across different feature extraction methods and machine learning classifiers. Notably, the use of a HOG in conjunction with a SVM classifier outperformed other combinations, achieving a maximum accuracy of 78.8%. This indicates the effectiveness of HOG in capturing discriminative features from retinal OCT images, facilitating accurate disease classification.

Comparison of different Models and Classifiers:

The study offers a detailed comparison across various models for retinal disease distribution, emphasizing both time efficiency and accuracy tailored to the specific requirements of each method. We have employed three distinct feature extraction techniques in this research: HOG, LBP, and FOSF. Additionally, the study incorporates three widely used classification approaches: RFC, SVM, and KNN.

Histogram of Oriented Gradients (HOG):

The HOG is a feature descriptor extensively used in computer vision and image processing for object detection tasks. It operates by segmenting an image into smaller, overlapping sections, calculating the gradients in each section, and then categorizing these gradient orientations into histograms. This process generates feature vectors that effectively encapsulate the local intensity gradients, offering a robust representation of the shapes and structures of objects. In our study, we have employed the HOG feature descriptor for the classification of OCT images, leveraging its renowned capabilities in computer vision and image processing. We applied the HOG algorithm to our dataset, which involved breaking down images into small, overlapping sections, computing the local intensity gradients, and then generating histograms that characterize the gradient orientations.

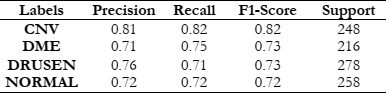
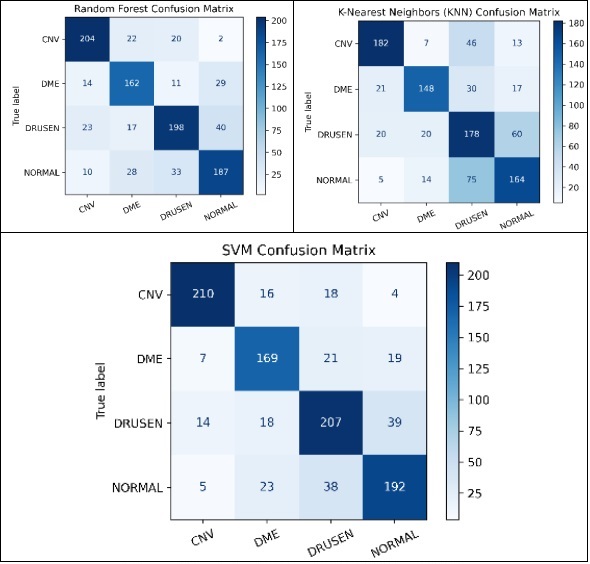
To assess the effectiveness of HOG features in object recognition, we utilized three distinct classifiers: RFC, SVM, and KNN. Our experimental approach included a meticulous division of the dataset into training and test sets, with each classifier configured appropriately. The results were comprehensively analyzed using standard evaluation metrics such as accuracy, precision, recall, and F1-score. This analysis aimed to elucidate the performance of each classifier in accurately distinguishing between different object classes, thereby highlighting the potential of HOG features in object detection and classification.

Table 1: Classification Report of RFC

Table 2: Classification Report of KNN

Table 3: Classification Report of SVM

Figure 4: Confusion Matrix of RFC, KNN, and SVM.

Local Binary Pattern (LBP):

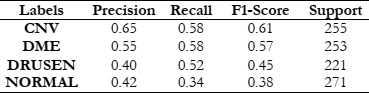
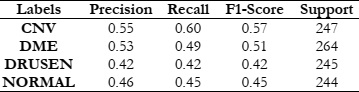
The LBP is a texture descriptor widely utilized for texture analysis and classification in image processing. It functions by comparing a central pixel's intensity with that of its surrounding pixels, encoding these relational intensities into binary patterns. These patterns are subsequently converted into histograms, effectively encapsulating the texture features of the image. LBP is particularly adept at identifying textural patterns such as edges, corners, and diverse texture variations. In our study, we applied the LBP method to our dataset and engaged three different classifiers for evaluation: RFC, SVM, and KNN. The goal was to determine the effectiveness of LBP, in combination with these classifiers, in differentiating various textures within the dataset, thereby offering valuable insights into its applicability for texture-centric image classification tasks.

To gauge the efficacy of the LBP when used alongside the RFC, SVM, and KNN classifiers, our evaluation focused on key metrics such as accuracy, recall, precision, and the F1 score. These metrics collectively serve as critical indicators of the classifiers' proficiency in accurately detecting and classifying different textures present in the images. Accuracy indicates the overall correctness of the classifications made, recall measures the ability of the classifiers to correctly identify relevant examples of each texture class, precision assesses the exactness of the classifiers in correctly labeling instances of a specific class, and the F1 score provides a harmonized evaluation, considering both precision and recall. These performance indicators present a holistic view of the effectiveness of LBP, in synergy with RFC, SVM, and KNN, in precisely classifying textures within our dataset. This analysis thereby contributes significant insights to the broader domain of texture-based image analysis.

Table 4: Classification Report of RFC

Table 5: Classification Report of KNN

Table 6: Classification Report of SVM

Figure 5: Confusion Matrix of RFC, KNN, and SVM.

Fourier Transform of Spectral Features (FOSF):

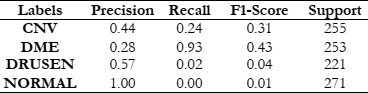
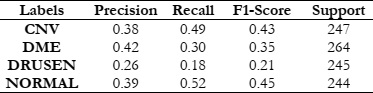
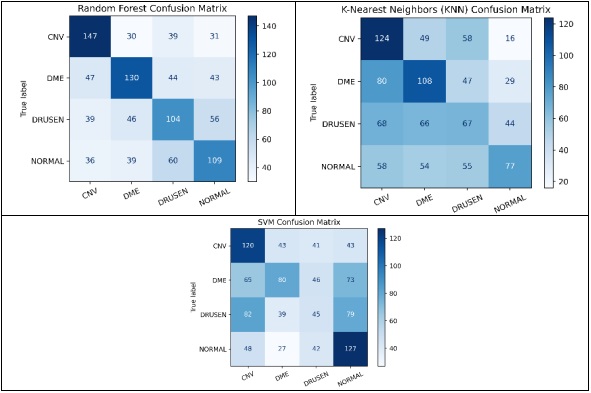
The FOSF is a method that employs the Fourier transform to derive spectral features from signals or images. In image processing, FOSF translates the spatial details of an image into the frequency domain, revealing its frequency components. This conversion is pivotal in various tasks, including image compression, filtering, and feature extraction. FOSF is especially useful in fields where analyzing an image's frequency content is essential, such as in medical or satellite image analysis. To examine its effectiveness, we applied FOSF to our dataset and engaged three classifiers for assessment: RFC, SVM and KNN. This technique is particularly advantageous in situations where discerning an image's frequency details is crucial, for instance in medical imaging or satellite imagery analysis.

The next phase of our study focused on evaluating how FOSF, combined with these classifiers, performs in image processing tasks like classification and object detection. We assessed the performance using key metrics such as accuracy, recall, precision, and F1 score. This comprehensive analysis was aimed at determining the proficiency of FOSF, in conjunction with Random Forest, SVM, and KNN, in accurately differentiating various patterns and structures within our dataset. The results provided a nuanced understanding of FOSF's capabilities when integrated with different classification methods, offering valuable insights into its potential applications in the field of image analysis.

Table 7: Classification Report of RFC

Table 8: Classification Report of KNN

Table 9: Classification Report of SVM

Figure 6: Confusion Matrix of RFC, KNN, and SVM.

Figure 7: Proposed methodology of retinal disease detection.

The results of this study provide fascinating insights into the relative effectiveness of the explored methods. Universally, the SVM demonstrated superior performance compared to the RFC and KNN, excelling not only in accuracy but also in computational efficiency.

Table 10: ACCURACY of proposed methods on OCT Dataset

Figure 8: Accuracy comparison with different models and classifiers

Figure 9: Time comparison with different models

This paper goes beyond merely comparing different feature extraction techniques and classifiers for Retinal Disease detection; it also emphasizes the importance of judiciously choosing the most effective combination of filters and classifiers to achieve enhanced accuracy. The results underscore the notable benefits of integrating HOG with the SVM Classifier. This provides critical insights for future studies and practical implementations in medical image analysis, highlighting a promising direction for advancements in this field.

Conclusion

In conclusion, this paper has proposed a detailed comparison of various combinations of filters and classifiers used in Retinal disease classification is presented. The HOG method along with the SVM classifier enhances the diagnosis and management of retinal diseases by offering swift and objective OCT image processing. However, there is a need for further research to understand the application of this system on larger datasets and its clinical utility. Future investigations could focus on several critical areas. Firstly, expanding the dataset in size and diversity is essential to strengthen the model's capability to identify complex patterns in retinal images.

Additionally, OCT images allow for an in-depth analysis of structural features present in the tissues imaged. Investigating detailed aspects of anatomical structures, like the thickness of layers, vessel density, and unique markers within the retinal tissues, could unveil sophisticated structure-based features pivotal for increasing diagnostic accuracy. Future research endeavors should aim to elevate the precision of OCT image analysis systems, thereby significantly contributing to their practical application in clinical settings.

Reference

[1] J. Jiang et al., “Ultrahigh speed Spectral / Fourier domain OCT ophthalmic imaging at 70,000 to 312,500 axial scans per second,” Opt. Express, Vol. 16, Issue 19, pp. 15149-15169, vol. 16, no. 19, pp. 15149–15169, Sep. 2008, doi: 10.1364/OE.16.015149.

[2] M. E. J. van Velthoven, D. J. Faber, F. D. Verbraak, T. G. van Leeuwen, and M. D. de Smet, “Recent developments in optical coherence tomography for imaging the retina,” Prog. Retin. Eye Res., vol. 26, no. 1, pp. 57–77, Jan. 2007, doi: 10.1016/J.PRETEYERES.2006.10.002.

[3] S. A. Boppart, G. J. Tearney, B. E. Bouma, J. F. Southern, M. E. Brezinski, and J. G. Fujimoto, “Noninvasive assessment of the developing Xenopus cardiovascular system using optical coherence tomography,” Proc. Natl. Acad. Sci. U. S. A., vol. 94, no. 9, pp. 4256–4261, Apr. 1997, doi: 10.1073/PNAS.94.9.4256/ASSET/4849CBA2-F776-442F-86D0-A06D9DB929CE/ASSETS/GRAPHIC/PQ0970492007.JPEG.

[4] M. J. Suter et al., “Intravascular Optical Imaging Technology for Investigating the Coronary Artery,” JACC Cardiovasc. Imaging, vol. 4, no. 9, pp. 1022–1039, Sep. 2011, doi: 10.1016/J.JCMG.2011.03.020.

[5] J. F. Southern et al., “Scanning single-mode fiber optic catheter–endoscope for optical coherence tomography,” Opt. Lett. Vol. 21, Issue 7, pp. 543-545, vol. 21, no. 7, pp. 543–545, Apr. 1996, doi: 10.1364/OL.21.000543.

[6] G. J. Tearney et al., “In Vivo Endoscopic Optical Biopsy with Optical Coherence Tomography,” Science (80-. )., vol. 276, no. 5321, pp. 2037–2039, Jun. 1997, doi: 10.1126/SCIENCE.276.5321.2037.

[7] T. Gambichler, G. Moussa, M. Sand, D. Sand, P. Altmeyer, and K. Hoffmann, “Applications of optical coherence tomography in dermatology,” J. Dermatol. Sci., vol. 40, no. 2, pp. 85–94, Nov. 2005, doi: 10.1016/j.jdermsci.2005.07.006.

[8] J. M. Schmitt, M. J. Yadlowsky, and R. F. Bonner, “Subsurface Imaging of Living Skin with Optical Coherence Microscopy,” Dermatology, vol. 191, no. 2, pp. 93–98, Feb. 1995, doi: 10.1159/000246523.

[9] “Non-invasive ophthalmic imaging of adult zebrafish eye using optical coherence tomography.” Accessed: Feb. 13, 2024. [Online]. Available: https://core.ac.uk/download/pdf/291515351.pdf

[10] J. S. Schuman, L. Kagemann, H. Ishikawa, and G. Wollstein, “Spectral-Domain Optical Coherence Tomography as a Noninvasive Method to Assess Damaged and Regenerating Adult Zebrafish Retinas,” Invest. Ophthalmol. Vis. Sci., vol. 53, no. 11, pp. 7315–7315, Oct. 2012, doi: 10.1167/IOVS.12-10925.

[11] “Optical coherence tomography for high-resolution imaging of mouse development in utero.” Accessed: Feb. 13, 2024. [Online]. Available: https://www.spiedigitallibrary.org/journals/journal-of-biomedical-optics/volume-16/issue-04/046004/Optical-coherence-tomography-for-high-resolution-imaging-of-mouse-development/10.1117/1.3560300.full#_=_

[12] C. A. Stewart, I. V. Larina, J. C. Burton, S. Wang, and R. R. Behringer, “High-resolution three-dimensional in vivo imaging of mouse oviduct using optical coherence tomography,” Biomed. Opt. Express, Vol. 6, Issue 7, pp. 2713-2723, vol. 6, no. 7, pp. 2713–2723, Jul. 2015, doi: 10.1364/BOE.6.002713.

[13] A. Alex et al., “A Circadian Clock Gene, Cry, Affects Heart Morphogenesis and Function in Drosophila as Revealed by Optical Coherence Microscopy,” PLoS One, vol. 10, no. 9, p. e0137236, Sep. 2015, doi: 10.1371/JOURNAL.PONE.0137236.

[14] M. Watanabe et al., “Ultrahigh-speed optical coherence tomography imaging and visualization of the embryonic avian heart using a buffered Fourier Domain Mode Locked laser,” Opt. Express, Vol. 15, Issue 10, pp. 6251-6267, vol. 15, no. 10, pp. 6251–6267, May 2007, doi: 10.1364/OE.15.006251.

[15] F. Shi et al., “Automated 3-D retinal layer segmentation of macular optical coherence tomography images with serous pigment epithelial detachments,” IEEE Trans. Med. Imaging, vol. 34, no. 2, pp. 441–452, Feb. 2015, doi: 10.1109/TMI.2014.2359980.

[16] J. Sugmk, S. Kiattisin, and A. Leelasantitham, “Automated classification between age-related macular degeneration and Diabetic macular edema in OCT image using image segmentation,” BMEiCON 2014 - 7th Biomed. Eng. Int. Conf., Jan. 2014, doi: 10.1109/BMEICON.2014.7017441.

[17] A. Lang, A. Carass, B. M. Jedynak, S. D. Solomon, P. A. Calabresi, and J. L. Prince, “Intensity inhomogeneity correction of macular OCT using N3 and retinal flatspace,” Proc. - Int. Symp. Biomed. Imaging, vol. 2016-June, pp. 197–200, Jun. 2016, doi: 10.1109/ISBI.2016.7493243.

[18] M. Adhi et al., “Choroidal analysis in healthy eyes using swept-source optical coherence tomography compared to spectral domain optical coherence tomography,” Am. J. Ophthalmol., vol. 157, no. 6, pp. 1272-1281.e1, Jun. 2014, doi: 10.1016/j.ajo.2014.02.034.

[19] M. A. Hussain et al., “Classification of healthy and diseased retina using SD-OCT imaging and Random Forest algorithm,” PLoS One, vol. 13, no. 6, p. e0198281, Jun. 2018, doi: 10.1371/JOURNAL.PONE.0198281.

[20] M. Wojtkowski et al., “Ophthalmic imaging by spectral optical coherence tomography,” Am. J. Ophthalmol., vol. 138, no. 3, pp. 412–419, Sep. 2004, doi: 10.1016/j.ajo.2004.04.049.

[21] D. S. Ting, L. R. Pasquale, L. Peng, J. P. Campbell, A. Y. Lee, R. Raman, G. S. Tan, L. Schmetterer, P. A. Keane, and T. Y. Wong, “Artificial intelligence and deep learning in ophthalmology,” British Journal of Ophthalmology, vol. 103, pp. 167–175, 2019.

[22] Schmidt-Erfurth, et al, “Unsupervised identification of disease marker candidates in retinal oct imaging data,” IEEE transactions on medical imaging, vol. 38, pp. 1037–1047, 2019.

[23] Lee C.S., Baughman D.M., Lee A.Y. Deep Learning Is Effective for Classifying Normal versus Age-Related Macular Degeneration OCT Images. Ophthalmol. Retin. 2017;1:322–327. doi: 10.1016/j.oret.2016.12.009.

[24] Kermany DS, Goldbaum M, Cai W, Lewis MA. Identifying Medical Diagnoses and Treatable Diseases by Image-Based Deep Learning Resource Identifying Medical Diagnoses and Treatable Diseases by Image-Based Deep Learning. Cell. 2018;172:1122–31.e9. https://doi.org/10.1016/j.cell.2018.02.010.

[25] Huang L., He X., Fang L., Rabbani H., Chen X. Automatic Classification of Retinal Optical Coherence Tomography Images With Layer Guided Convolutional Neural Network. IEEE Signal Process. Lett. 2019;26:1026–1030. doi: 10.1109/LSP.2019.2917779.

[26] Chowdhary C.L., Acharjya D. Clustering Algorithm in Possibilistic Exponential Fuzzy C-Mean Segmenting Medical Images. J. Biomimetics Biomater. Biomed. Eng. 2017;30:12–23. doi: 10.4028/www.scientific.net/JBBBE.30.12.

[27] T. Tsuji et al., “Classification of optical coherence tomography images using a capsule network,” BMC Ophthalmol., vol. 20, no. 1, pp. 1–9, Mar. 2020, doi: 10.1186/S12886-020-01382-4/FIGURES/9.

[28] G. Latha and P. Aruna Priya, “Glaucoma Retinal Image Detection and Classification using Machine Learning Algorithms,” J. Phys. Conf. Ser., vol. 2335, no. 1, p. 012025, Sep. 2022, doi: 10.1088/1742-6596/2335/1/012025.

[29] Y. Zhou, “Automated Identification of Diabetic Retinopathy Using Deep Learning,” 2021.

[30] Jian Li, “Automated Detection and Classification of Diabetic Retinopathy Using Deep Learning Based on EfficientNet,” 2020.

[31] H. Fu, “Automated diagnosis of diabetic retinopathy using deep learning”, 2018

[32] S. W. Ting et al., “Artificial intelligence and deep learning in ophthalmology,” Br. J. Ophthalmol., vol. 103, no. 2, pp. 167–175, Feb. 2019, doi: 10.1136/BJOPHTHALMOL-2018-313173.

[33] R. Gargeya and T. Leng, “Automated Identification of Diabetic Retinopathy Using Deep Learning,” Ophthalmology, vol. 124, no. 7, pp. 962–969, Jul. 2017, doi: 10.1016/J.OPHTHA.2017.02.008.

[34] Hwang D.K., Hsu C.C., Chang K.J., Chao D., Sun C.H., Jheng Y.C., Yarmishyn A.A., Wu J.C., Tsai C.Y., Wang M.L., et al. Artificial intelligence-based decision-making for age-related macular degeneration. Theranostics. 2019;9:232–245. doi: 10.7150/thno.28447.

[35] Tasnim N., Hasan M., Islam I. Comparisonal study of Deep Learning approaches on Retinal OCT Image. arXiv. 20191912.07783