Investigation Site:
In the pursuit of gathering accurate ground truth data for this research endeavor, the Yar Hussain region emerged as the designated area of study located in Swabi district of Khyber Pakhtunkhwa. This offers a diverse landscape that encompasses sprawling agricultural plots, urban structures, and winding waterways. Yar Hussain, strategically positioned about 12 KM from the district's administrative heart in Swabi, is further situated approximately 82 KM from the provincial capital of Peshawar.
Beyond its geographical attributes, Yar Hussain assumes a pivotal role as a bustling commercial hub, catering to the business needs of nearby towns like Yaqubi, Sard Chena, Ghazikot, Naiknam, Debian, etc. This expansive reach underscores the town's significance as a critical economic centre for the wider region. Moreover, Yar Hussain boasts noteworthy importance in the context of the tobacco industry, solidifying its status as a major player in this sector. For a visual representation, Tehsil Yar Hussain can be observed in Figure 2 below, offering a comprehensive overview of its geographical layout and the intricate interplay of its various features. This chosen area serves as an ideal microcosm for the research, encapsulating a rich tapestry of urban and agricultural elements essential for a thorough examination of the subject matter at hand.
Data Collection:
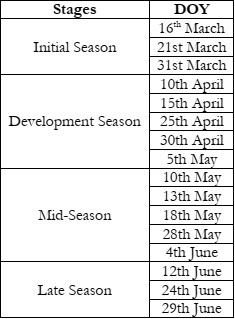
The data for our experiments was sourced from various outlets, including Sentinel-2, Sentinel-3, and ECMWF weather data. We retrieved the most up-to-date Sentinel-2 and Sentinel-3 data from ESA. The timeline for the acquisition of satellite imagery and ECMWF data is illustrated in Table 1 along with different stages of the phenological cycle of FCV is also provided in Table 1.
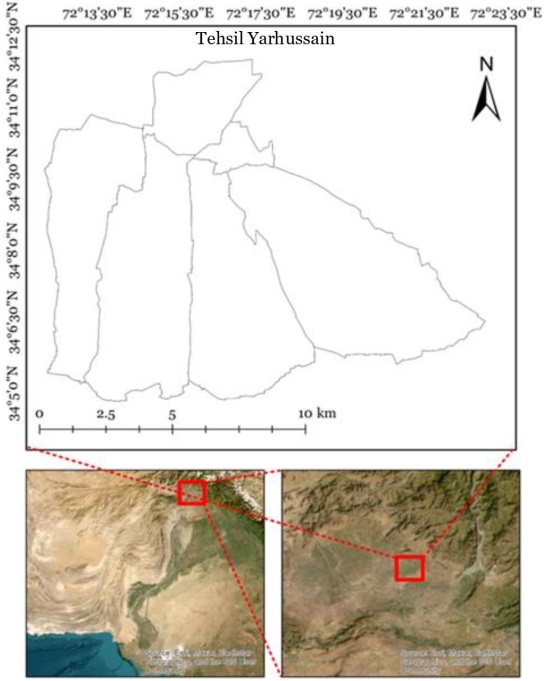
Figure 2: Yar Hussain- Locality Map
Table 1: Data acquisition date of satellite imagery
In Figure 3 Figure 2 below, we present the extensive SENET execution designed for the precise estimation of ET. The components showcased in the figure intricately outline the step-by-step workflow employed for ET estimation. Each of these steps is meticulously expounded upon in the respective sections dedicated to Sentinel-2, Sentinel-3, and ECMWF data sources.
This workflow unfolds systematically, progressing through each stage in a carefully orchestrated manner, as detailed in the forthcoming subsections. This deliberate approach ensures a comprehensive and thorough assessment of ET, drawing on the combined strengths of the Sentinel satellites and ECMWF data, thus facilitating a robust and accurate estimation process.
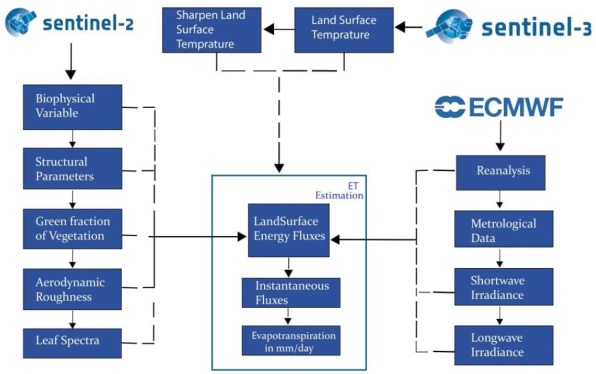
Figure 3: ET Calculation Cycle
Sentinel-2:
The ESA Sentinel-2 satellite represents a significant asset for remote sensing applications. It provides high-resolution multispectral level-2A imagery, acquired through the agency's scientific data hub webpage (ESA). Despite being equipped with a single MSI, this instrument encompasses an impressive array of 13 distinct spectral channels. What sets Sentinel-2 apart is its deployment as a constellation of satellites, all outfitted with identical sensors. This collective effort results in an impressive 5-day revisit time, a crucial feature for applications like land-use mapping, where consistent and up-to-date imagery is paramount.
The Sen ET project aimed to optimize the estimation of ET at a fine geographic scale (tens of meters) by leveraging data collected from the Sentinel 2 and Sentinel 3 satellites in tandem [20]. SENET processes the data acquired by these satellites to calculate the ET of specific regions. Sentinel-2 data is collected for analysis once every five days [21], indicating the real-time data for the Sentinel-2 satellite is not presently accessible. Nonetheless, the available data is sufficiently valuable for a range of applications. On the other hand, data from Sentinel 3 is made available daily, but compatibility issues may occasionally limit its utility.
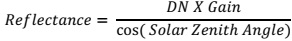
To estimate evapotranspiration using remote sensing, we begin by acquiring satellite imagery with bands in the visible, near-infrared, and thermal infrared regions. We preprocessed the imagery by applying atmospheric correction algorithms to account for atmospheric effects. We calculated reflectance which can be seen in Figure 4: Sentinel 2 Reflectance, for each band using sensor-specific parameters and correct for bidirectional reflectance. Further adjusted for terrain effects to obtain surface reflectance. Then combine bands to create vegetation indices such as NDVI or EVI, which are indicative of vegetation health. Finally, these reflectance values and vegetation indices in evapotranspiration models, consider factors like land cover and meteorological data. The formula to calculate ToA reflectance for remote sensing bands is given by:
Where:
• Reflectance is the calculated reflectance.
• DN is the Digital Number from the satellite sensor.
• Gain is the radiometric calibration factor for each band.
• Cos (Solar Zenith Angle) is the cosine of the solar zenith angle, which is the angle between the sun and the zenith.
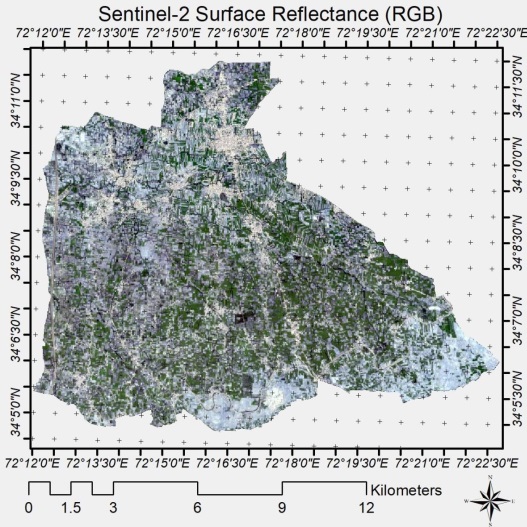
Figure 4: Sentinel 2 Reflectance
From the preprocessed Sentinel 2 data, four key output parameters are computed: Reflectance, Biophysical data, Sun Zenith Angle and Mask data. These components undergo preprocessing, specifically the Mask data, Sun Zenith Angle, Reflectance, and Biophysical data. The Mask data enables the generation of elevation and landcover maps. Biophysical characteristics play a crucial role in controlling both reflectance and transmittance. Through the integration of biophysical factors along with the sun's zenith angle, it becomes feasible to compute the proportion of green vegetation in a given area. This valuable metric, known as the "green percent," is a pivotal component in characterizing the vegetative landscape. The combination of land cover maps and biophysical data further enriches our understanding of the structural attributes within a specific ecosystem.
Biophysical data derived from remote sensing is crucial for monitoring and understanding changes in Earth's surface, ecosystem health, and environmental conditions, and it serves as input for various environmental models and studies. Biophysical data in the context of remote sensing typically refers to quantitative information about the physical characteristics of Earth's surface, vegetation, and other features. Some common biophysical parameters include land cover, vegetation indices, LAI, and fractional vegetation cover. The NDVI is a widely used vegetation index calculated from remote sensing data, and it represents the greenness and health of vegetation. The formula for NDVI is:

Where:
• NIR is the reflectance in the near-infrared band.
• Red is the reflectance in the red band.
LAI is another important biophysical parameter that characterizes the amount of vegetation in a canopy. It is often derived from remote sensing data using vegetation indices and specific algorithms. Fractional vegetation cover is the proportion of a pixel covered by vegetation, and it can be estimated from satellite imagery using methods that take into account the spectral characteristics of different land cover types.
The solar zenith angle is an astronomical term that defines the angle between the sun and the zenith point (directly overhead point) at a specific location on Earth's surface. It is a key parameter in remote sensing, influencing the amount of solar radiation reaching the Earth's atmosphere and surface. The solar zenith angle varies throughout the day and across different latitudes and seasons. The formula to calculate the solar zenith angle (θs) is given by:
cos(θ)=sin(∅) .sin(δ)+cos(∅).cos(δ).cos(ω)
Where:
• ϕ is the latitude of the location.
• δ is the solar declination angle.
• ω is the hour angle of the sun.
Understanding the solar zenith angle is crucial in remote sensing applications because it affects the angle at which sunlight interacts with the Earth's surface. In the context of calculating reflectance, as mentioned earlier, the solar zenith angle is used to correct for the varying angle of sunlight and to normalize the reflectance values. The cosine of the solar zenith angle is often used in the reflectance calculation to account for the changing angle of incidence of solar radiation. As the solar zenith angle approaches 90 degrees (sun near the horizon), the radiation has to travel through a thicker layer of the atmosphere, which can affect the quality of remote sensing data.
Sentinel-3:
In the realm of ET estimation using Sentinel-3 processing, the methodology unfolds in distinct stages to extract essential information for accurate analysis. The initial preprocessing phase within Snap generates three key outputs: LST, Observation Geometry, and the Sentinel 3 Mask. These outputs set the stage for subsequent calculations. The "Warp to Template" stage, a pivotal step in Sentinel-3 processing, aligns and harmonizes these outputs to ensure compatibility between images. This alignment is critical for integrating Land-Surface Temperature, Observation Geometry, and the Sentinel 3 Mask seamlessly, forming a cohesive foundation for further analysis. LST which is shown in Figure 5: LSTis a crucial parameter utilized in estimating evapotranspiration through remote sensing applications. LST represents the temperature of the Earth's surface and is measured by thermal infrared sensors onboard satellites. In the context of evapotranspiration estimation, LST serves as a key input in energy balance models. These models, such as the SEBAL or the SSEB, leverage LST data to calculate the energy exchanges occurring at the land surface. Specifically, LST plays a pivotal role in distinguishing between sensible and latent heat fluxes. The temperature information captured by remote sensing technologies enables the quantification of the energy used for heating the atmosphere (sensible heat) and the energy consumed in the process of water evaporation and plant transpiration (latent heat). This distinction is fundamental for accurately assessing evapotranspiration rates, providing valuable insights into water consumption patterns across various landscapes, and supporting informed decision-making in agriculture, water resource management, and environmental monitoring.
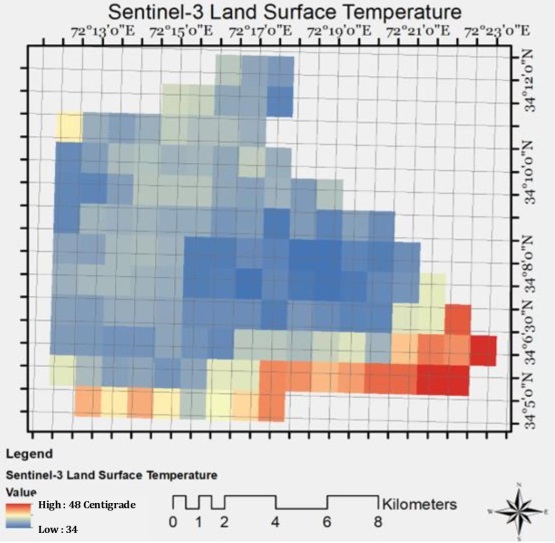
Figure 5: LST
Following this, a refinement of Land-Surface Temperature takes place, involving intricate adjustments that incorporate the reflectance band from Sentinel-2, the Land-Surface Temperature from Sentinel-3, and the templating information from Sentinel-3 which is shown in Figure 6: Sharpen Land Surface Temperature (Sharpen LST)represents the sharpened land surface temperature of the studied area. These fine-tuning steps are instrumental in enhancing the precision and reliability of Land-Surface Temperature data, thereby ensuring the accuracy of subsequent ET analyses. The adjustments made during processing, particularly those related to Sentinel-2 reflectance, Sentinel-3 Land-Surface Temperature, and Sentinel-3 templating, bear paramount importance, forming the cornerstone for generating reliable data that underpins in-depth analysis and interpretation of ET patterns.
ECMWF:
The data, originating directly from Snap, undergoes a sequential process involving the use of the S2 elevation graph and NetCDF file for reanalysis [22]. Figure 7 represents the meteorological data and the parameters that have been used including air humidity data, pressure data, wind data, and solar radiations. The incorporation of ERA5 reanalysis data is pivotal in generating estimates of long-wave irradiation. Computation of Net Shortwave Radiation is a multifaceted task, requiring the integration of reflectance and transmittance estimates, biophysical attributes, vegetation structural characteristics, Reanalysis data, and the "Warp to Template" process. Land Surface Fluxes, a critical parameter in environmental and ecological studies, are accurately estimated by utilizing datasets such as S3-Sharpened LST, S3-LST, S2-Biophysical Properties, S2-Vegetation Structural Parameters, S2-Green Vegetation Fraction, S2-Aerodynamic Roughness, ERA5 Reanalysis data, Net Shortwave radiation, Longwave irradiance, and S2-Mask.
Figure 6: Sharpen Land Surface Temperature (Sharpen LST)
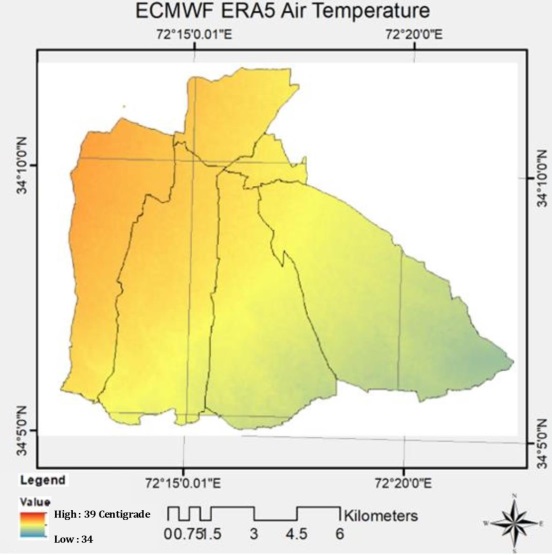
Figure 7: Fluctuation in Air Temperature in the study site
The primary data source was directly obtained from the ECMWF repository, and this data undergoes processing using Sentinel-2 and ECMWF data files for a comprehensive reanalysis. Leveraging reanalysis data is instrumental in calculating an estimate of long-wave irradiation. The calculation of Net Shortwave Radiation involves a meticulous approach, incorporating estimated reflectance and transmittance, biophysical attributes, and vegetation structural characteristics. The integration of Reanalysis data and the implementation of the "Warp to Template" process ensure accuracy in these calculations. The estimation of Land Surface Fluxes relies on various datasets, including Sentinel-3 land surface temperature, Sentinel-2 biophysical properties, Sentinel-2 vegetation structural parameters, Sentinel-2 aerodynamic roughness, Reanalysis data, Net Shortwave radiation, Longwave irradiance, and Sentinel-2 Mask. This comprehensive methodology contributes to accurate estimations of Land Surface Fluxes which are shown in Figure 8: Land Surface Energy Fluxes, providing invaluable insights for sustainable resource management and environmental conservation efforts by unraveling intricate ecosystem interactions. Land surface energy fluxes are fundamental components in estimating evapotranspiration through remote sensing methodologies. Remote sensing technologies capture crucial information about the exchanges of energy between the Earth's surface and the atmosphere, facilitating the quantification of key flux components. Incoming solar radiation is absorbed by the land surface, driving processes like photosynthesis and surface heating. Outgoing terrestrial radiation represents the heat emitted by the Earth, influencing nighttime temperatures. Sensible heat flux, measured through temperature differentials, indicates the energy transferred as heat between the land surface and the atmosphere. Latent heat flux, associated with the phase change of water, encompasses the energy consumed during evaporation from soil and transpiration from plants. Utilizing remote sensing data, particularly from thermal infrared sensors, enables the estimation of land surface temperature, a critical parameter for separating sensible and latent heat fluxes. This information contributes to accurate models, such as the SEBAL, enhancing the assessment of evapotranspiration rates across diverse landscapes and supporting water resource management and environmental monitoring.
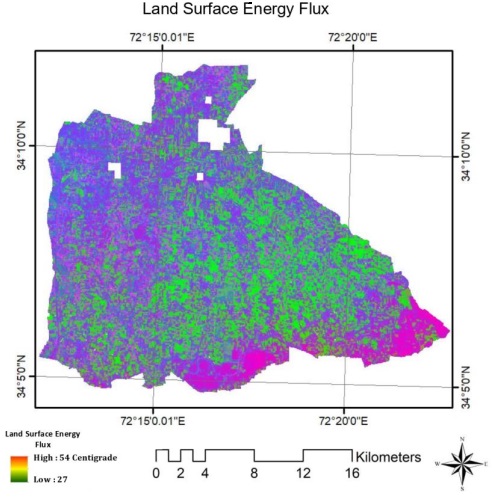
Figure 8: Land Surface Energy Fluxes Result
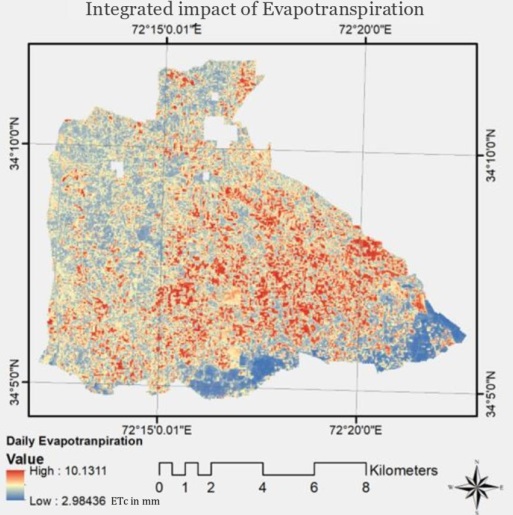
Figure 9: Spatial distribution of Evapotranspiration.
Figure 9: represents the map of the studied area. The red color in the above figure represents the highest evapotranspiration in the observed region. In Table 2, we can observe that the trend shown by the estimated calculated ET values aligns with the average value derived from all the surveyed tobacco fields. Due to the irregular usage of irrigation on these lands, a noticeable contrast emerges. It appears that the farmers are not factoring in the ETc values, as they continue to irrigate their crops in the same manner and at the same time daily. The irrigation process does not consider the growth stages of FCV or their specific water requirements. The variance between the computed ET and the required ET values can be attributed to various factors, including human error, insufficient rainfall, or improper irrigation practices.
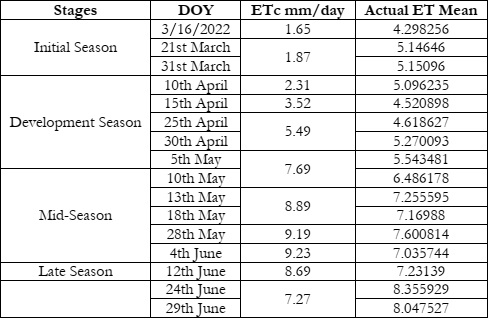
Table 2: ETc vs Actual Mean Results
The pattern shown by the estimated computed ETc values, which closely match the average value produced from all the sampled tobacco fields, is illustrated in Figure 10: Calculated ET Mean vs Actual ET. However, the inconsistent use of irrigation on these farms causes a glaring disparity. The discrepancies that have been found are a result of these inconsistent irrigation practices.
Farmers continue to water their crops consistently and at set times each day, even though the ETc values are not being considered in the irrigation routines. Additionally, it appears that the FCV plant's many growth stages and their unique water needs during the irrigation period are not being considered.
There are many reasons for the apparent discrepancy between the computed ET and the necessary ET values, including possible human error, insufficient rainfall, or maybe ineffective irrigation techniques. This difference highlights the urgent need to put more precise and customized irrigation management systems into place. Such plans should be created to consider the distinct growth phases of the FCV plant, maximizing water efficiency and encouraging sustainable agriculture methods. We may strive toward a more effective and long-lasting strategy for irrigation within the tobacco farming environment by addressing these aspects.
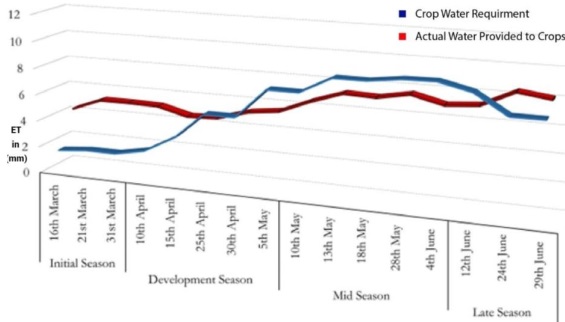
Figure 10: Calculated ET Mean vs Actual ET
• The water requirements for FCV tobacco vary with the seasons, as indicated by the primary ETc graph. However, it is evident from these graphs that this fundamental principle has not been considered.
• Variances in Real ET values among fields that are in close physical proximity are typically the result of either a water deficit or surplus.
• Tobacco fields situated near waterways exhibit higher Real ET values, whereas those farther from the canals show lower values.
• In contrast, low-lying areas receive a uniform level of irrigation.
• The seasonal rise in ETc levels generally follows a consistent pattern.
• The average graph reveals opportunities for enhancing water conservation and increasing yields.
• Local farmers can potentially save a significant amount of water at the start of the season by aligning with the trend of ETc values. Subsequently, rainfall can fulfill most of the water requirements in April and May, preserving a substantial volume of water for other purposes.
The provided data illustrates the progression of a crop through various growth stages, each associated with a specific day of the year. In the initial season, starting from the 16th of March, the crop's water requirement gradually increased, reaching 1.87 by the end of March, while the ETa showed an even steeper rise, peaking at 5.15096. The development season, commencing on the 10th of April, exhibited a more pronounced increase in crop water requirement, reaching 7.69 by the 5th of May, while the actual ET fluctuated, indicating some variability in water utilization. The mid-season, from the 10th of May, demonstrated consistent water requirements, peaking at 9.23, with actual ET values showing fluctuations in the crop's water utilization. As we entered the late season, starting from the 12th of June, the crop's water requirement decreased to 7.27, while actual ET indicated a slight increase.
From an agricultural perspective, it is crucial to note that the actual ET values play a significant role in assessing the effectiveness of irrigation practices. Discrepancies between crop water requirements and actual ET values can provide insights into water management. For instance, during the development season, the actual ET often lagged behind the crop's water requirement, suggesting potential opportunities for more efficient water use. Additionally, the fluctuations in actual ET during the mid-season raise questions about the consistency of irrigation practices.
Discussion
In this dissertation, we utilized a combination of Sentinel-2, Sentinel-3, and ECMWF data to predict water evaporation in Tobacco crops within the Yar Hussain, Swabi region. Our study incorporated data from FAO CropWat and the Mardan meteorological station to compare crop water demand ETc with available crop water supply ETa across four growth stages. The identification of Tobacco fields involved on-the-ground data collection and landcover classification through machine learning and deep learning techniques. We further analysed ETa data from five distinct union councils using ESA SENET. The results indicated an excessive water supply to the crops during their growth phases, with inconsistencies noted when comparing observed ETa and ETc values to irrigation scheduling during development and midseason periods.
Our research underscores the reliability and value of the SENET-based ETa estimation method for a wide region. However, we acknowledge the need for additional research and effort to comprehensively develop this field. Future research avenues include optimizing water management practices through real-time meteorological data integration and advanced algorithm development, preventing over-irrigation while accurately estimating crop water requirements. Extensive field validation tests are proposed for validation and calibration purposes to enhance model precision and adaptability. Incorporating additional relevant data sources, such as soil moisture measurements, crop growth stage information, and soil parameters, is identified as a potential strategy to improve model accuracy and provide a comprehensive understanding of water balance dynamics.
Furthermore, customization of ETa models tailored to individual crops is suggested, allowing for more precise estimates and water management strategies aligned with specific farming practices. The discussion also extends to the implementation of the proposed ETa estimation methodology on a larger scale. Coordination with water management authorities, policymakers, and agricultural stakeholders may be necessary for integrating the model into existing agricultural monitoring systems and decision-support tools. By addressing these questions, our research aims to enhance water resource management and agricultural productivity in numerous regions, offering accurate and widely applicable ETa estimation models based on remote sensing.
Conclusion
In this study, we utilized data from Sentinel-2, Sentinel-3, and ECMWF weather sources to estimate actual ETa for tobacco crops in the Yarhussain region of Swabi. Comparative analysis was performed between the ETa trends and FAO CropWat estimates for tobacco crop water requirements ETc across four distinct growth stages. Through ground truth surveys, six random tobacco fields were identified per union council in Yarhussain. The findings highlighted a pattern of excessive irrigation during the initial and development phases, coupled with irregular scheduling in the development and mid-season stages. These observations underscore the potential applicability of our methodology in broader geographical regions. This study underscores the significance of refining irrigation practices for effective water management in agriculture.
Author’s Contribution: Conceptualization: Waleed Khan Data Creation, Muhammad Hamza, Formal Analysis, Muhammad Hamza, Waleed Khan, Nasru Minallah, Investigation, Nasru Minallah, Muhammad Hamza, Waleed Khan, Supervision, Nasru Minallah, Validation, Waleed Khan Software, Muhammad Hamza, Writing-Original Draft, Shujat Hussain and Waleed Khan, Writing review and Editing, Nasru Minallah
Conflict of Interest: The authors declare no conflict of interest in publishing this manuscript in IJIST.
Project Details: The project was sponsored by the National Center for Big Data and Cloud Computing, at the University of Engineering and Technology Peshawar
Abbreviations:
Evapo-transpiration (ET)
Computed Evapo-transpiration (ETc)
Actual Evapo-transpiration (ETa)
Flue Cured Virginia (FCV)
European Space Agency (ESA)
Sustainable Development Goals (SDGs)
Gross Domestic Product (GDP)
Energy Balance Priestley–Taylor model (TSEB-PT)
Multispectral instrument (MSI)
Top of atmosphere (TOA)
leaf area index (LAI)
Normalized Difference Vegetation Index (NDVI)
Land-Surface Temperature (LST)
Surface Energy Balance Algorithm for Land (SEBAL) or the
Simplified Surface Energy Balance (SSEB)
European Centre for Medium-Range Weather Forecasts (ECMWF)
Centre for Medium-Range Weather Forecasts (ECMWF)
Reference
[1] N. Bhattarai, S. B. Shaw, L. J. Quackenbush, J. Im, and R. Niraula, “Evaluating five remote sensing based single-source surface energy balance models for estimating daily evapotranspiration in a humid subtropical climate,” Int. J. Appl. Earth Obs. Geoinf., vol. 49, pp. 75–86, Jul. 2016, doi: 10.1016/J.JAG.2016.01.010.
[2] W. Ishaque, R. Tanvir, and M. Mukhtar, “Climate Change and Water Crises in Pakistan: Implications on Water Quality and Health Risks,” J. Environ. Public Health, vol. 2022, 2022, doi: 10.1155/2022/5484561.
[3] T. Khan, H. Nouri, M. J. Booij, A. Y. Hoekstra, H. Khan, and I. Ullah, “Water Footprint, Blue Water Scarcity, and Economic Water Productivity of Irrigated Crops in Peshawar Basin, Pakistan,” Water 2021, Vol. 13, Page 1249, vol. 13, no. 9, p. 1249, Apr. 2021, doi: 10.3390/W13091249.
[4] C. J. Tucker and P. J. Sellers, “Satellite remote sensing of primary production,” Int. J. Remote Sens., vol. 7, no. 11, pp. 1395–1416, 1986, doi: 10.1080/01431168608948944.
[5] M. Aslam, “Agricultural Productivity Current Scenario, Constraints and Future Prospects in Pakistan,” Sarhad J. Agric., vol. 32, no. 4, pp. 289–303, Oct. 2016, doi: 10.17582/JOURNAL.SJA/2016.32.4.289.303.
[6] W. Khan et al., “On the Performance of Temporal Stacking and Vegetation Indices for Detection and Estimation of Tobacco Crop,” IEEE Access, vol. 8, pp. 103020–103033, 2020, doi: 10.1109/ACCESS.2020.2998079.
[7] N. Minallah, M. Tariq, N. Aziz, W. Khan, A. ur Rehman, and S. B. Belhaouari, “On the performance of fusion based planet-scope and Sentinel-2 data for crop classification using inception inspired deep convolutional neural network,” PLoS One, vol. 15, no. 9, p. e0239746, Sep. 2020, doi: 10.1371/JOURNAL.PONE.0239746.
[8] N. Minallah and W. Khan, “Comparison of Neural Networks and Support Vector Machines for the Mass Balance Ablation Observation of Glaciers in Baltoro Region,” J. Inf. Commun. Technol. Robot. Appl., vol. 9, no. 2, pp. 37–45, Apr. 2019, Accessed: Feb. 07, 2024. [Online]. Available: https://jictra.com.pk/index.php/jictra/article/view/106
[9] T. Hák, S. Janoušková, and B. Moldan, “Sustainable Development Goals: A need for relevant indicators,” Ecol. Indic., vol. 60, pp. 565–573, Jan. 2016, doi: 10.1016/J.ECOLIND.2015.08.003.
[10] N. Ali, A. Jaffar, M. Anwer, D. M. Raza, and N. Ali, “The Economic Analysis of Tobacco Industry: A Case Study of Tobacco Production in Pakistan.” Jan. 05, 2015. Accessed: Feb. 07, 2024. [Online]. Available: https://papers.ssrn.com/abstract=2600400
[11] Sajjad, Z. U. Haq, J. Iqbal, and M. F. Shahzad, “Understanding the Profitability, Supply, and Input Demand of Tobacco Farms in Khyber Pakhtunkhwa, Pakistan,” Econ. 2022, Vol. 10, Page 59, vol. 10, no. 3, p. 59, Mar. 2022, doi: 10.3390/ECONOMIES10030059.
[12] R. H. Qureshi and M. Ashraf, Water security issues of agriculture in Pakistan. 2019. [Online]. Available: https://www.paspk.org/wp-content/uploads/2019/06/PAS-Water-Security-Issues.pdf
[13] D. T. Lauer, S. A. Morain, and V. V. Salomonson, “The Landsat program: Its origins, evolution, and impacts,” Photogramm. Eng. Remote Sensing, vol. 63, no. 7, pp. 831–838, 1997.
[14] M. A. Wulder et al., “Current status of Landsat program, science, and applications,” Remote Sens. Environ., vol. 225, pp. 127–147, May 2019, doi: 10.1016/J.RSE.2019.02.015.
[15] M. Berger, J. Moreno, J. A. Johannessen, P. F. Levelt, and R. F. Hanssen, “ESA’s sentinel missions in support of Earth system science,” Remote Sens. Environ., vol. 120, pp. 84–90, May 2012, doi: 10.1016/J.RSE.2011.07.023.
[16] R. C. Bispo, F. B. T. Hernandez, I. Z. Gonçalves, C. M. U. Neale, and A. H. C. Teixeira, “Remote sensing based evapotranspiration modeling for sugarcane in Brazil using a hybrid approach,” Agric. Water Manag., vol. 271, p. 107763, Sep. 2022, doi: 10.1016/J.AGWAT.2022.107763.
[17] V. Burchard-Levine et al., “A remote sensing-based three-source energy balance model to improve global estimations of evapotranspiration in semi-arid tree-grass ecosystems,” Glob. Chang. Biol., vol. 28, no. 4, pp. 1493–1515, Feb. 2022, doi: 10.1111/GCB.16002.
[18] A. Garcia-Pedrero, M. Lillo-Saavedra, D. Rodriguez-Esparragon, and C. Gonzalo-Martin, “Deep Learning for Automatic Outlining Agricultural Parcels: Exploiting the Land Parcel Identification System,” IEEE Access, vol. 7, pp. 158223–158236, 2019, doi: 10.1109/ACCESS.2019.2950371.
[19] U. Kumar et al., “Evaluation of Spatio-Temporal Evapotranspiration Using Satellite-Based Approach and Lysimeter in the Agriculture Dominated Catchment,” J. Indian Soc. Remote Sens., vol. 49, no. 8, pp. 1939–1950, Aug. 2022, doi: 10.1007/S12524-021-01367-W.
[20] S. Chintala, T. S. Harmya, B. V. N. P. Kambhammettu, S. Moharana, and S. Duvvuri, “Modelling high-resolution Evapotranspiration in fragmented croplands from the constellation of Sentinels,” Remote Sens. Appl. Soc. Environ., vol. 26, p. 100704, Apr. 2022, doi: 10.1016/J.RSASE.2022.100704.
[21] S. Czapiewski and D. Szumińska, “An overview of remote sensing data applications in peatland research based on works from the period 2010–2021,” Land, vol. 11, no. 1, p. 24, Jan. 2022, doi: 10.3390/LAND11010024/S1.
[22] Y. Cui, L. Song, and W. Fan, “Generation of spatio-temporally continuous evapotranspiration and its components by coupling a two-source energy balance model and a deep neural network over the Heihe River Basin,” J. Hydrol., vol. 597, p. 126176, Jun. 2021, doi: 10.1016/J.JHYDROL.2021.126176.