E-ISSN:2709-6130
P-ISSN:2618-1630

Research Article

International Journal of Innovations in Science & Technology

2024 Volume 6 Number 1 Jan-Mar

Python Based Estimation of Groundwater Quality Along Hudaira Drain

Javaid. A1,2*, Ahmad. S. R2, Qadir. A1, Yousaf. W3 , Mirz. A.I1

1 College of Earth and Environmental Sciences, University of the Punjab, Lahore, Pakistan

2 Kinnaird College for Women, Lahore, Pakistan

Abstract
During periods of restricted access to fresh surface water, enterprises depend on underground water reserves to meet their growing demands. Groundwater is crucial for fulfilling the growing demands of families, agriculture, and industry. The degradation of groundwater quality has resulted from a combination of natural phenomena and human intervention, leading to the introduction of novel contaminants into the ecosystem. The current study utilized geospatial technology to investigate the geochemical properties and Water Quality Index (WQI) of groundwater along the Hudaira drain in the Lahore area of Pakistan. A total of thirty-six groundwater samples were taken at regular intervals of half and one kilometer along the Hudaira drain. The samples underwent analysis for twenty physio-chemical and metal parameters. The groundwater at the sites under investigation was classified into three categories: adequate (5.55%), acceptable (63.9%), and poor (30.6%), according to the WQI. The trilinear piper diagram was used to assess the salinity of water samples. Samples were segregated into two groups: the first group mainly consisted of calcium bicarbonate, whereas the second group contained calcium sodium bicarbonate salts in groundwater. The Gibbs diagram is employed to illustrate the prevailing influence of rock-water interactions in all groundwater samples. Elevated levels of salt lead to salinity issues and diminished agricultural output. This study demonstrated the harmful effect of drained water on groundwater in the Hudaira region, primarily through the processes of percolation and infiltration. Moreover, it can be inferred that the groundwater near the Hudaira drain is not fit for human consumption. Nevertheless, prolonged irrigation may give rise to issues associated with the accumulation of salt.

Keywords: Groundwater, The Canadian Council of Ministers of the Environment (CCME) Water Quality Index (WQI), Geochemical process, Geographical Information System (GIS), Piper diagram.

Corresponding Author How to Cite this Article
Ambreena Javaid, College of Earth and Environmental Sciences, University of the Punjab, Lahore, Pakistan
Ambreena Javaid, Sajid Rashid Ahmad, Abdul Qadir,Wasif Yousaf, Ali Imam Mirza, Python Based Estimation of Groundwater Quality Along Hudaira Drain . IJIST. 2024 ;6(1):170-184 https://journal.50sea.com/index.php/IJIST/article/view/681

Introduction

Water is universally recognized as the cornerstone of life as we comprehend it, playing an indispensable role in sustaining living organisms and ecosystems. Terrestrial and aquatic species typically rely on surface water sources for nourishment [1]. The first human civilizations arose in regions where there was accessible surface freshwater. However, later human activities began and used subterranean water supplies for reasons such as irrigation, industry, and drinking [2]. Surface water resources are insufficient to meet the increasing demands of industrial and agricultural users due to their limited availability. Consequently, there is a growing need for groundwater to fulfill the requirements of industries, agriculture, and drinking water sources. When there is a shortage of fresh surface water, groundwater reserves are used to meet the growing demands of different sectors [3]. The present escalation in groundwater demand can mostly be ascribed to the amalgamation of rapid population growth and intensive agricultural practices. Around 33% of the world's population depends on groundwater as their main supply of potable water [4], [5]. UNICEF and WHO reports reveal that over 2.6 billion people worldwide do not have access to safe drinking water [6]. Industrialization, increased irrigation, and urbanization are all factors that impact groundwater resources [7]. The excessive utilization of groundwater has led to detrimental impacts on both the quantity and quality of the water. In densely populated urban areas, it fulfills several functions, such as the excavation of boreholes and wells for both public and private organizations [8]. Each geographical area contains a distinct aquifer that varies in its chemical composition, physiochemical characteristics, and capacity to replenish water [9], [10]. The quality of groundwater is assessed based on the lithological, geochemical, and hydrodynamic characteristics of rocks [11]. Groundwater resources play a crucial role in meeting the growing demands of the industrial, agricultural, and residential sectors [12]. The degradation of groundwater quality has resulted from a combination of natural processes and human activities, which have added supplementary contaminants to the ecosystem [13].

Groundwater is commonly polluted by many chemical substances that contain nitrogen, chloride, sulphate, petroleum, iron, and heavy metals such as cadmium, lead, mercury, nickel, and zinc. The primary factor contributing to this issue is environmental contamination [14]. Heavy metals can be obtained from two separate sources. There are two distinct classifications of sources: geogenic and anthropogenic. Deposition, weathering, and erosion are caused by natural processes, while mining, industry, and agriculture result from human activities [15], [16]. Heavy metals gradually contaminate surface and groundwater sources, resulting in a decline in the quality of potable water. Consequently, this has a direct impact on human health [17], [18], [19]. The designation of a resource as nonrenewable or renewable depends on how it is used and consumed [20]. Each year, approximately 1.8 million individuals, mostly children, are affected by polluted water in underdeveloped nations [21]. Water quality study greatly boosts investigations into groundwater.

GIS is a powerful tool used for research, education, and the creation of programmed frameworks [22], [23], [24]. Furthermore, [25] employed GIS tools to assess and interpret the data on groundwater quality. The researcher [10]created a GIS map of the Tuticorin region in India, with a specific emphasis on the coastal area. The map should integrate diverse parameters pertaining to the groundwater's quality. The Water Quality Index (WQI) is a method employed to evaluate the standard of potable water. This technique is utilized to assess the water's quality and determine its potability [26]. The WQI is a widely utilized measure for assessing the extent of water pollution. It is calculated by combining many mathematical algorithms [27]. The WQI is a valuable and distinctive approach utilized by local residents and politicians to assess groundwater quality using a single numerical number [28]. Moreover, it evaluates the appropriateness and adequacy of groundwater for human consumption [29]. Hadrochemical data is essential for evaluating the appropriateness of groundwater for drinking in a certain region. It provides irrefutable proof of underground geological regions containing water [19]. Therefore, the advantageous characteristic of the Canadian Council of Ministers of the Environment Water Quality Index (CCME WQI) is its potential to be easily applied to other nations with minimal modifications [30].

Groundwater is regarded as the primary water source for human consumption and other purposes. The existence of hazardous contaminants in water will ultimately have detrimental impacts on animals, agriculture, human health, and several other areas.

The aim of this study is to illustrate the various sources of contaminants that infiltrate the soil and water in the vicinity of the Hudaira drain. The current study will be beneficial for the Department of Public Health, as well as agricultural and environmental agencies. It will facilitate the management of environmental concerns in this region on a larger scale. The primary aim of this study is to evaluate the hydrogeochemical properties and quality of groundwater in the vicinity of the Hudaira drain by employing the water quality index and GIS methodologies.

Figure 1: The study region is a map that shows the Hudaira Drain region in Lahore, Pakistan.

Study Area:

The Hudaira drain spans from a latitude of 31°31'4.601"N to 31°24'23.612"N and a longitude of 74°36'24.413"E to 74°6'15.751"E in Lahore, as depicted in Figure 1. The Hudaira drain is a transboundary drain between India and Pakistan, measuring 98.6 kilometers in length. Upon covering a distance of 44 kilometers within Indian territory, it proceeds to enter Pakistan near the Lallo hamlet in District Lahore [31]. In Pakistan, the river passes through the city of Lahore for approximately 54 km before merging with the river Ravi. Within its catchment region, there exists a series of aquifers that are limited in quantity, and the majority of these aquifers do not have a geological origin [32], [33], however the aquifers in question are unconfined [34]. The Hudaira drain catchment region experiences an average annual rainfall of 650mm, with the majority of this precipitation occurring during the monsoon season, which typically begins in June and ends in September. The remaining precipitation is attributed to westerlies throughout the winter season. The drain traverses across the alluvial sediments of the river Ravi. This drain has undergone a transformation from a rainy water stream to a sewage drain due to the influx of highly contaminated effluents and sewage originating from industrial and urban areas [4]. Over 120 distinct industrial facilities located along the Hudaira drain release their untreated effluents directly into the drain. The average yearly discharge of effluents from the Hudaira drain is approximately 178 cubic feet per second, comprising of untreated industrial effluent and sewage waste [35]. The Hudaira Drain is fed by four tributaries, namely the Minhala Drain, Charrar Drain, Ferozepur Road Drain, and SattuKatla Drain. The SattuKatla drain absorbs a significant amount of effluents from both the industrial and residential sectors of Lahore, and it ultimately merges with the Hudaira drain [36], [37].

Methodology

Sampling Strategy:

Groundwater samples were obtained before and after the monsoon season using a systematic sampling technique that ensured equal distances between sampling points. The samples were taken from groundwater pumps and WASA taps. A total of thirty-six groundwater samples were collected from nine transects, each separated by a buffer zone of two kilometers (Figure 2). Each transect consists of four sampling points, with two on the right and two on the left. The average distance from the drain is 500 meters (1/2 km) and 1000 meters (1 km) respectively (Figure 2).

Figure 2: Transects of sites for groundwater sampling along the Hudaira Drain

The GARMIN eTrex 30 GPS device was used to accurately define the coordinates of each sampling location. Three groundwater samples were obtained from each site and put into 0.5-liter high-density plastic bottles that had been previously cleaned, labeled, and kept in an icebox maintained at an average temperature of 4ºC. In order to meet the pH specifications of APHA-AWWA-WEF, a small quantity of concentrated nitric acid (HNO3) was promptly introduced into the water samples for metal analysis [38]. The aforementioned samples were sent to the Environmental Science Laboratory at Kinnaird College for Women in Lahore for subsequent chemical analysis. Later, they were transferred to Renacon Pharmaceutical Private Ltd., Lahore. A comprehensive analysis was conducted on a total of twenty parameters, including major metals (Na+, K2+, Ca2+, and Mg2+), minor metals (As, Cd, Cr, Cu, Co, Fe, Pb, Mn, and Zn), and physio-chemical parameters (pH, EC, TDS, HCO3-, NO3-, SO4, and Cl-). The WQI was determined using the Canadian Council of Ministers of the Environment (CCME) technique, yielding a value of 3.2.

The current study investigated three factors related to the quality of water; specifically scope, frequency, and amplitude, were evaluated [30]. The frequency (F2) is determined by the values that did not meet the test requirement, whereas the scope (F1) measures the percentage of parameters that did not fit with the objectives. The overall effect of the three parts was shown by measuring the amplitude (F3). The aggregate of these three constituents produces a numerical value that spans from 0 to 100, serving as a comprehensive gauge of water quality. The WQI (CCME) model classifies water quality into 100 categories, where a value of 0 represents the poorest water quality [39]. The CCME WQI values were converted into ranks using the index classification approach, as outlined in Table 1.

Table 1: CME WQI index categorization scheme

The comprehensive computation of the WQI. The WQI was computed utilizing the method stipulated by the Canadian Council of Ministers of the Environment (CCME).

The resultant values were normalized by the 1.732 divisor to a range spanning from 0 to 100.

Three steps process was used to calculate the F3 (Amplitude):

The excursion was measured by the number of occurrences where a specific concentration exceeds (or goes below, in the case of a minimum goal) the desired target. The frequency of occurrences where the test value does not surpass the objective is provided as follows:

In order to get the overall amount, we aggregated all the discrepancies of the tests from the target and subsequently divided that aggregate by the total number of tests. Both successful and unsuccessful endeavors was encompassed in the ultimate outcome. The normalized sum of excursions, sometimes referred to as NSE, is primarily expressed as:

The value denoted by F3 is a numeric expression that spans from 0 to 100. The value was calculated by adjusting the Normalized Sum of the Excursions (NSE) according to the desired result.

The core map of the study region and the spatial distribution maps of the Water Quality Index (WQI) were created using ArcGIS 10.5 software and IDW interpolation techniques. Furthermore, this software was utilized to perform overlay analysis. The Aqua Chem 4.0 programmer was employed to graph the geochemical data and ascertain the principal hydro-geochemical facies and quality control method of the study area using the Gibbs plot. A Piper diagram isan invaluable tool for understanding and categorizing the chemical makeup of water based on its appropriateness, as well as highlighting the chemical relationships between different components. The obtained diagrams depict the similarities, distinctions, and diverse forms of water found in the study area. An ANOVA and correlation analysis were performed using the statistical program SPSS 21.0.

The python based script for estimation of Ground water quality is as under:

Result

Water Quality Index:

The results of groundwater quality indicators at 36 individual sites along the Hudaira drain are shown in Table 2. Table 3 shows the results WQI, which reveals that 5.55% of the two sites were categorized as fair, 63.9% of the 23 sites were categorized as marginal, and 30.6% of the 11 sites were graded as terrible. None of the venues under investigation met the criteria outlined by CCME (2001) for an exceptional, highly satisfactory, or satisfactory classification. The water quality samples classified as marginal or bad were not appropriate for human consumption. Figure 3 illustrates the spatial distribution of the CWQI, revealing that the WQI in the upstream area was categorized as fair. The quality declines as the industrial sector approaches and ultimately reaches a condition of bad quality. The groundwater quality in the River Ravi area improves with time as a result of sedimentation (chemical deposition) and the dilution factor. Human activity near the drain may involve the release of waste items from homes, businesses, and farms. By employing interpolation of the WQI, the research region can be classified into three distinct clusters: one with poor water quality, another with intermediate water quality, and a third with excellent water quality (Figure 3). The cluster that is of poor quality includes transects 5, 6, and 7. The clusters of average quality includes transects 8 and 9. The cluster that is of good quality includes transects 1, 2, 3, and 4.

Figure 3: Map illustrating the spatial categorization of places based on the GWQI

In statistics, the main method of obtaining information is via analyzing the interrelationship between two random variables or two sets of data. The correlation matrix measures the degree of correlation between two quantitatively measured variables. Parameters exhibiting a correlation coefficient (r) over 0.7 are deemed to possess a significant correlation, whereas those with r values ranging from 0.4 to 0.7 indicate a moderate correlation. The Pearson correlation matrix in Table 4 indicates strong positive relationships between EC and Na+ (r = 0.98), TDS (r = 0.58), Cl- (r = 0.86), SO42- (r = 0.58), and HCO3- (r = 0.53). There is a positive association between the concentration of Na+ and TDS (r = 0.51), as well as between Cl- (r = 0.88) and TDS. Additionally, there is a positive correlation between the concentration of SO42- and TDS (r = 0.51), Na+ (r = 0.58), EC (r = 0.58), and K2+ (r = 0.58). In addition, the concentration of HCO3- is positively correlated with TDS (r = 0.67), EC (r = 0.53), and Pb (r = 0.60). The positive correlation indicates that most ions are involved in physiochemical activities, such as ion exchange, oxidation-reduction, and other associated processes. A robust link exists between sodium and electrical conductivity (EC), total dissolved solids (TDS), chloride ions (Cl-), magnesium (Mg), and sulphate ions (SO42-). The Piper trilinear diagram indicates that sodium (Na) is the prevailing cation in the groundwater samples. With the exception of Chromium (Cr) and Cadmium (Cd) which have a correlation coefficient of -0.56, some elements display a little negative correlation. Hydro-geochemical facies refer to distinct chemical compositions of water in a hydrological system.

Table 2: Mean values for physicochemical, major metals, and trace metals parameters in groundwater along the Hudaira Drain

Table 3: Water Quality Index of groundwater along the Hudaira Drain for drinking purpose

Figure 4 depicts the Piper trilinear diagram. This diagram illustrates the variations in concentrations of both cations and anions. The Piper diagram structure is composed of six distinct classes: sodium chloride type, calcium bicarbonate type, mixed calcium magnesium chloride type, mixed calcium sodium bicarbonate type, and calcium chloride type. The Piper diagram is mostly influenced by the groundwater samples of the mixed calcium sodium bicarbonate and calcium bicarbonate kinds, while there are also other samples that fall into the sodium chloride and sodium bicarbonate categories.

Gibb's Schematic is a visual depiction or diagram that is employed to elucidate the thermodynamic properties and interconnections of a system. The Gibbs diagram is frequently used to determine the relationship between the lithological characteristics of an aquifer and the composition of the water (Gibbs, 1970). Figures 5(A) and (B) depict the Gibbs diagram, which showcases three distinct domains: precipitation dominance, evaporation dominance, and rock-water interaction or rock-weathering dominance. The rock-water or rock-weathering dominance field is applicable to all samples since it demonstrates the interaction between the chemical composition of rocks and the chemical composition of percolated fluids in the research region.

Table 4: Correlation coefficient matrix of groundwater quality parameter along the Hudaira drain

Figure 4: Piper Plot Describing the Hydro chemical facies of Groundwater at Different Sites Located Adjacent to Hudaira Drain

Figure 5: (A) (B)Gibbs diagrams representing the classification of groundwater quality based on natural factors at different sample locations adjacent to the Hudaira drain subsurface.

In addition, surface contamination sources, such as return flow irrigation and other anthropogenic causes, can greatly impair the quality of groundwater by increasing the levels of sodium (Na+) and chloride (Cl-). The Gibbs ratio (I) of an anion is determined by dividing the concentration of Cl- by the total concentration of Cl- and HCO3-.

The expression Na + K2 + / (Na + K2 + Ca2 +) reflects the Gibbs ratio (Cation). This specifies that the concentration of each ion is denoted in milliequivalents per liter.

The chemical composition of the samples was mostly influenced by weathering reactions resulting from the underlying biotite gneisses, biotite schists, and granite, as evidenced by numerous examinations. This paper explores the correlation between groundwater and aquifer rocks, specifically focusing on the mechanism of silicate and carbonate mineral dissolution from these rocks [40], [41], [42].

Discussion

With the impending arrival of the industrial cluster, the groundwater quality in the vicinity of the Hudaira drain is deteriorating. Spatial assessment of water quality was conducted using twenty criteria. Overall, it was noted that the northern and western regions have a higher degree of urbanization compared to the southern and eastern sectors. The majority of this urbanized area is comprised of residential and commercial buildings. The water quality in the south and east is substandard in comparison to the north and west due to the discharge of pollutants from many sectors in these regions, including chemical, dyeing, culinary, engineering, and textile industries, which can contaminate both surface and groundwater. These industries release wastewater that degrades the quality of groundwater because of the presence of toxic heavy metals such as Cobalt (Co), Arsenic (As), Chromium (Cr), Lead (Pb), and Cadmium (Cd). Therefore, it is expected that the discharge of these industrial waste liquids will result in a deterioration of the groundwater quality in this region, in contrast to the more advanced regions situated to the north and west. The data suggests that the evaluation of groundwater could make use of the WQI. The authors of [43] and [44] utilized groundwater chemistry to evaluate the appropriateness of the water for agricultural and potable uses. According to the research conducted by [45], it was found that most of the samples came from the economically disadvantaged population. Moreover, it was ascertained that the decline in water quality in Birjand, Iran was mostly caused by the discharge of industrial, urban, and agricultural wastewater. Moreover, research conducted by [38] has shown that human activity is having a noticeable impact on the groundwater quality in Raipur, India.

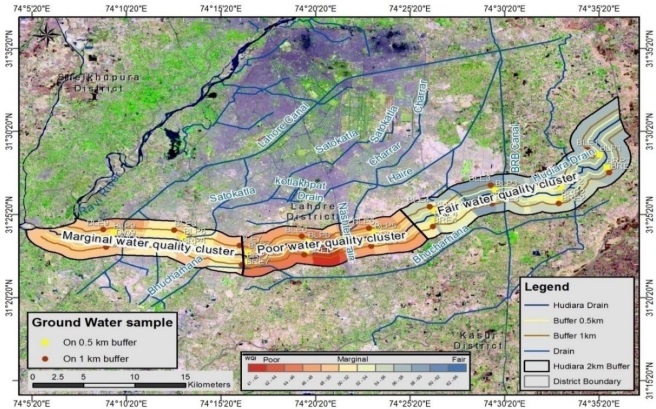
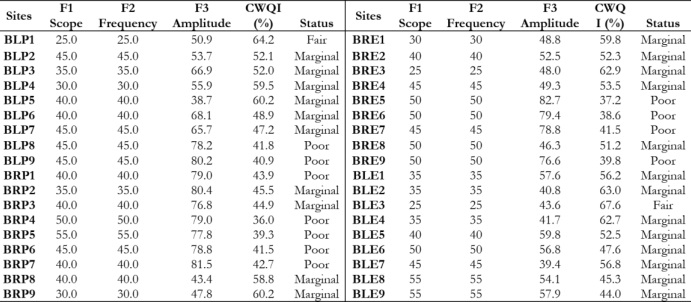
The groundwater quality in the upstream region is typically characterized as ranging from moderate to poor, with a steady deterioration observed from the northeast to the southwest. The water quality in the upstream is generally poor and deteriorates as the drain goes from the upstream to the middle stream, primarily due to the significant industrial activity in the middle stream and the prevalence of agricultural activities in the upstream. The water quality of the drain improves as it moves downstream and is currently classified as marginal. According to the extensive overlay research depicted in Figure 6, the WQI of groundwater demonstrates a steady enhancement in the area near the river Ravi (downstream) as a result of sedimentation (chemical deposition) and the dilution effect.

Figure 6: An analysis of groundwater quality which is conducted at multiple sites in close proximity to the Hudaira drain, focusing on various parameters.

It is deducted from the results that drain water influences the groundwater quality. Most probably it is due to percolation and infiltrations of drain water as exemplified (Figure 7.)

Figure 7: Graphic depicting the processes of infiltration and percolation in the study area.

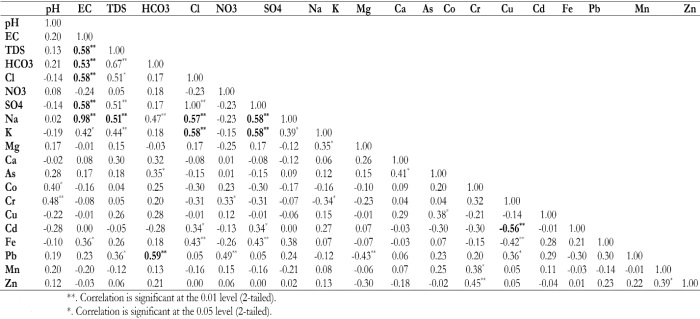
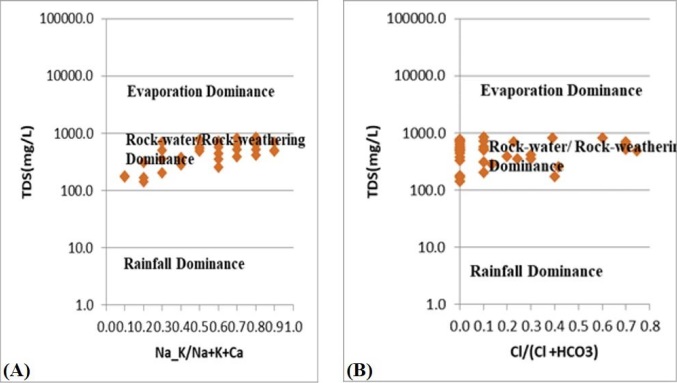
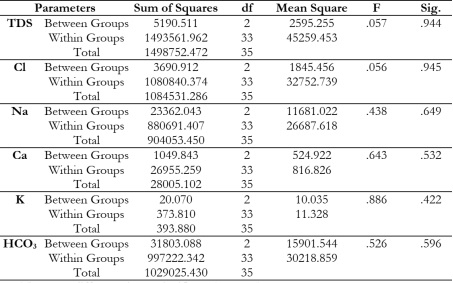
The ANOVA results for the average groundwater sample taken along the drain for both the half-kilometer and one-kilometer buffer are presented in Table 5. A variance analysis (ANOVA) was performed on the following ions: TDS, Na+, Cl-, HCO3-, K2+, and Ca2+. The results indicated that all values are statistically insignificant, implying that the principal source of groundwater is the parent rock material. The rock-water field is shown to be the dominant field in Gibbs' diagram. Multiple investigations conducted in India have demonstrated that the main emphasis of ion geochemistry is the interplay between rocks and water [10].

Conclusion

Based on the study, the water quality in the study area is generally classified as mediocre to poor and substandard to average as the river Ravi approaches. The Gibbs diagram illustrates that the rock-water interaction is the main determinant of the chemical composition of groundwater. Moreover, there exists a robust correlation between the electrical conductivity (EC) and the sodium ion (Na+) concentration. According to the examination of the Piper diagram, the primary salts present are NaCl and NaHCO3, which is probably a result of human activities and the leaching process. Although the majority of groundwater is unsuitable for consumption, it can be utilized for irrigation purposes. Nevertheless, prolonged irrigation can result in salt issues.

Table 5: Analysis of variance (ANOVA) for groundwater samples

Acknowledgements:

The authors are grateful to the Environmental Science Lab. Kinnaird College for Women, Lahore, Renacon Pharmaceutical Company Private Limited, and Post-Harvest Lab. Institute of Agriculture, University of the Punjab, Lahore.

Conflict of Interest:

The authors declare that there is no conflict of interest regarding the publication of this manuscript.

Reference

[1] A. Kansal, N. A. Siddiqui, and A. Gautam, “Assessment of heavy metals and their interrelationships with some physicochemical parameters in eco-efficient rivers of Himalayan region,” Environ. Monit. Assess., vol. 185, no. 3, pp. 2553–2563, 2013, doi: 10.1007/s10661-012-2730-x.

[2] S. S. D. Foster and P. J. Chilton, “Groundwater: The processes and global significance of aquifer degradation,” Philos. Trans. R. Soc. B Biol. Sci., vol. 358, no. 1440, pp. 1957–1972, 2003, doi: 10.1098/rstb.2003.1380.

[3] H. Annapoorna and M. R. Janardhana, “Assessment of Groundwater Quality for Drinking Purpose in Rural Areas Surrounding a Defunct Copper Mine,” Aquat. Procedia, vol. 4, pp. 685–692, 2015, doi: 10.1016/j.aqpro.2015.02.088.

[4] A. Javaid, S. R. Ahmad, and A. Qadir, “Health risk surveillance of arsenic in wastewater, groundwater, and agricultural land along Hudaira drain, Pakistan using GIS techniques,” Polish J. Environ. Stud., vol. 28, no. 2, pp. 681–692, 2019, doi: 10.15244/pjoes/81067.

[5] R. T. Nickson, J. M. McArthur, B. Shrestha, T. O. Kyaw-Myint, and D. Lowry, “Arsenic and other drinking water quality issues, Muzaffargarh District, Pakistan,” Appl. Geochemistry, vol. 20, no. 1, pp. 55–68, 2005, doi: 10.1016/j.apgeochem.2004.06.004.

[6] M. Jibreel et al., “Evaluation of drinking water quality at various public places in Lahore City Pakistan,” 2018.

[7] N. Khatri and S. Tyagi, “Influences of natural and anthropogenic factors on surface and groundwater quality in rural and urban areas,” Front. Life Sci., vol. 8, no. 1, pp. 23–39, 2015, doi: 10.1080/21553769.2014.933716.

[8] S. M. A. Adelana, T. A. Abiye, D. C. W. Nkhuwa, C. Tindimugaya, and M. S. Oga, “Urban groundwater management and protection in sub-saharan Africa,” Applied Groundwater Studies in Africa. Taylor & Francis, pp. 231–260, 2008. doi: 10.1201/9780203889497.pt3.

[9] C. D. Butler, C. F. Corvalan, and H. S. Koren, “Human health, well-being, and global ecological scenarios,” Ecosystems, vol. 8, no. 2, pp. 153–162, 2005, doi: 10.1007/s10021-004-0076-0.

[10] S. Selvam, G. Manimaran, P. Sivasubramanian, N. Balasubramanian, and T. Seshunarayana, “GIS-based Evaluation of Water Quality Index of groundwater resources around Tuticorin coastal city, south India,” Environ. Earth Sci., vol. 71, no. 6, pp. 2847–2867, 2014, doi: 10.1007/s12665-013-2662-y.

[11] C. Thivya et al., “A study on the significance of lithology in groundwater quality of Madurai district, Tamil Nadu (India),” Environ. Dev. Sustain., vol. 15, no. 5, pp. 1365–1387, 2013, doi: 10.1007/s10668-013-9439-z.

[12] P. Kibet, L. Lalit, and K. Richard, “Understanding water and land use within Tana and Athi River Basins in Kenya : opportunities for improvement,” Sustain. Water Resour. Manag., vol. 0, no. 0, p. 0, Sep. 2018, doi: 10.1007/s40899-018-0274-0.

[13] S. Majeed, S. Rashid, A. Qadir, C. Mackay, and F. Hayat, “Spatial patterns of pollutants in water of metropolitan drain in Lahore, Pakistan, using multivariate statistical techniques,” Environ. Monit. Assess., vol. 190, no. 3, p. 128, 2018, doi: 10.1007/s10661-018-6504-y.

[14] L. Limage, “ EFA Global Monitoring Report 2011: The Hidden Crisis; Armed Conflict and Education by EFA Global Monitoring Report team at UNESCO, Kevin Watkins, director of publication. Paris: UNESCO, 2011. 416 pp. ISBN 978-92-3-104191-4. ,” Comp. Educ. Rev., vol. 56, no. 1, pp. 180–183, 2012, doi: 10.1086/664429.

[15] M. Baqar et al., “Occurrence, ecological risk assessment, and spatio-temporal variation of polychlorinated biphenyls (PCBs) in water and sediments along River Ravi and its northern tributaries, Pakistan,” Environ. Sci. Pollut. Res., vol. 24, no. 36, pp. 27913–27930, 2017, doi: 10.1007/s11356-017-0182-0.

[16] J. Bellvert et al., “Airborne thermal imagery to detect the seasonal evolution of crop water status in peach, nectarine and Saturn peach orchards,” Remote Sens., vol. 8, no. 1, p. 39, Jan. 2016, doi: 10.3390/rs8010039.

[17] N. Iqbal, F. Hossain, H. Lee, and G. Akhter, “Integrated groundwater resource management in Indus Basin using satellite gravimetry and physical modeling tools,” Environ. Monit. Assess., vol. 189, no. 3, p. 128, Mar. 2017, doi: 10.1007/s10661-017-5846-1.

[18] A. T. Batayneh, “Toxic (aluminum, beryllium, boron, chromium and zinc) in groundwater: Health risk assessment,” Int. J. Environ. Sci. Technol., vol. 9, no. 1, pp. 153–162, 2012, doi: 10.1007/s13762-011-0009-3.

[19] S. Krishna kumar, A. Logeshkumaran, N. S. Magesh, P. S. Godson, and N. Chandrasekar, “Hydro-geochemistry and application of water quality index (WQI) for groundwater quality assessment, Anna Nagar, part of Chennai City, Tamil Nadu, India,” Appl. Water Sci., vol. 5, no. 4, pp. 335–343, 2015, doi: 10.1007/s13201-014-0196-4.

[20] S. R. Sundaraiah. R, L. K. D. Laxman Kumar. D, V. Bhoopathi, S. G. Sakram. G, S. E. Srinivas. E, and S. Sudarshan, “Assessing Groundwater Quality and its Suitability for Drinking and Irrigation Purposes in Kalwakurthy Area, Mahabubnagar District, Andhra Pradesh, India,” Int. J. Sci. Res., vol. 3, no. 3, pp. 30–33, 2012, doi: 10.15373/22778179/march2014/10.

[21] I. Akoteyon and O. Soladoye, “Groundwater Quality Assessment in Eti-Osa, Lagos-Nigeria using Multivariate Analysis,” J. Appl. Sci. Environ. Manag., vol. 15, no. 1, 2011, doi: 10.4314/jasem.v15i1.65687.

[22] G. Venkatesan and M. S. Senthil, “Groundwater quality mapping using geographic information system in Trichy district, Tamilnadu, India,” Water Sci. Technol. Water Supply, vol. 18, no. 6, pp. 2118–2132, 2018, doi: 10.2166/ws.2018.041.

[23] S. Selvam, F. A. Dar, N. S. Magesh, C. Singaraja, S. Venkatramanan, and S. Y. Chung, “Application of remote sensing and GIS for delineating groundwater recharge potential zones of Kovilpatti Municipality, Tamil Nadu using IF technique,” Earth Sci. Informatics, vol. 9, no. 2, pp. 137–150, Jun. 2016, doi: 10.1007/s12145-015-0242-2.

[24] W. Yousaf et al., “Erosion potential assessment of watersheds through GIS-based hypsometric analysis: a case study of Kurram Tangi Dam,” Arab. J. Geosci., vol. 11, no. 22, p. 711, 2018, doi: 10.1007/s12517-018-4059-4.

[25] A. K. Saraf and P. R. Choudhury, “Integrated remote sensing and gis for groundwater exploration and identification of artificial recharge sites,” Int. J. Remote Sens., vol. 19, no. 10, pp. 1825–1841, 1998, doi: 10.1080/014311698215018.

[26] A. Tiwari, P. Singh, and M. Mahato, “GIS-Based Evaluation of Water Quality Index of Groundwater Resources in West Bokaro coalfield, India,” Curr. World Environ., vol. 9, no. 3, pp. 843–850, 2014, doi: 10.12944/cwe.9.3.35.

[27] N. S. Nathan, R. Saravanane, and T. Sundararajan, “Application of ANN and MLR Models on Groundwater Quality Using CWQI at Lawspet, Puducherry in India,” J. Geosci. Environ. Prot., vol. 05, no. 03, pp. 99–124, 2017, doi: 10.4236/gep.2017.53008.

[28] F. Babaei Semirom, A. H. Hassan, A. Torabia, A. R. Karbass, and F. Hosseinzadeh Lotf, “Water quality index development using fuzzy logic: A case study of the Karoon River of Iran,” African J. Biotechnol., vol. 10, no. 50, pp. 10125–10133, 2011, doi: 10.5897/ajb11.1608.

[29] B. Nazari, A. Liaghat, M. R. Akbari, and M. Keshavarz, “Irrigation water management in Iran: Implications for water use efficiency improvement,” Agric. Water Manag., vol. 208, pp. 7–18, Sep. 2018, doi: 10.1016/j.agwat.2018.06.003.

[30] A. A. Khan, R. Paterson, and H. Khan, “Modification and application of the Canadian Council of Ministers of the Environment Water Quality Index (CCME WQI) for the communication of drinking water quality data in Newfoundland and Labrador,” Water Qual. Res. J. Canada, vol. 39, no. 3, pp. 285–293, 2004, doi: 10.2166/wqrj.2004.039.

[31] A. Malik, S. Jadoon, M. I. Latif, and M. Arooj, “Assessment of Heavy Metals in Fodder Crops Leaves Being Raised with Hudiara Drain Water (Punjab-Pakistan),” Int. J. Adv. Eng. Res. Sci., vol. 4, no. 5, pp. 93–102, 2017, doi: 10.22161/ijaers.4.5.16.

[32] S. Haydar, H. Haider, O. Nadeem, G. Hussain, I. Jalees, and A. Qadeer, “Effect of Hudiara drain on the quality of groundwater in the housing schemes of Lahore,” J. Fac. Eng. Technol., vol. 21, no. 2, pp. 119–134, 2014.

[33] A. Hamid, M. Zeb, A. Mehmood, S. Akhtar, and S. Saif, “Assessment of wastewater quality of drains for irrigation,” 2013.

[34] S. Kanwal and S. Roshaan Ali, “Lahore’s Groundwater Depletion-A Review of the Aquifer Susceptibility to Degradation and its Consequences Climate Change View project UNESCO Sponsored Project-Strategic Strengthening of Flood Warning and Management Capacity of Pakistan-Phase II (Extending,” 2015.

[35] M. Yamin and N. Ahmad, “Influence of Hudiara Drain Water Irrigation on Trace Elements Load In Soil And Uptake By Vegetables,” J. Appl. Sci. Environ. Manag., vol. 11, no. 2, 2010, doi: 10.4314/jasem.v11i2.55029.

[36] S. R. Kashif, M. Akram, M. Yaseen, and S. Ali, “Studies on heavy metals status and their uptake by vegetables in adjoining areas of Hudiara drain in Lahore,” Soil Env., vol. 28, no. 1, pp. 7–12, 2009.

[37] M. A. Khattak et al., “Evaluation of ground water quality for irrigation and drinking purposes of the areas adjacent to Hudiara Industrial Drain, Lahore, Pakistan,” Pakistan J. Agric. Sci., vol. 49, no. 4, pp. 549–556, 2012.

[38] R. Khan and D. C. Jhariya, “Groundwater quality assessment for drinking purpose in Raipur city, Chhattisgarh using water quality index and geographic information system,” J. Geol. Soc. India, vol. 90, no. 1, pp. 69–76, 2017, doi: 10.1007/s12594-017-0665-0.

[39] N. S. Magesh, N. Chandrasekar, and J. P. Soundranayagam, “Delineation of groundwater potential zones in Theni district, Tamil Nadu, using remote sensing, GIS and MIF techniques,” Geosci. Front., vol. 3, no. 2, pp. 189–196, 2012, doi: 10.1016/j.gsf.2011.10.007.

[40] C. Sadashivaiah, C. R. Ramakrishnaiah, and G. Ranganna, “Hydrochemical analysis and evaluation of groundwater quality in Tumkur Taluk, Karnataka State, India,” Int. J. Environ. Res. Public Health, vol. 5, no. 3, pp. 158–164, 2008, doi: 10.3390/ijerph5030158.

[41] S. Adnan and J. Iqbal, “Spatial analysis of the groundwater quality in the Peshawar district, Pakistan,” Procedia Eng., vol. 70, pp. 14–22, 2014, doi: 10.1016/j.proeng.2014.02.003.

[42] S. Mukate, D. Panaskar, V. Wagh, A. Muley, C. Jangam, and R. Pawar, “Impact of anthropogenic inputs on water quality in Chincholi industrial area of Solapur, Maharashtra, India,” Groundw. Sustain. Dev., vol. 7, pp. 359–371, 2018, doi: 10.1016/j.gsd.2017.11.001.

[43] M. Vasanthavigar et al., “Application of water quality index for groundwater quality assessment: Thirumanimuttar sub-basin, Tamilnadu, India,” Environ. Monit. Assess., vol. 171, no. 1–4, pp. 595–609, 2010, doi: 10.1007/s10661-009-1302-1.

[44] N. Subba Rao, “Seasonal variation of groundwater quality in a part of Guntur District, Andhra Pradesh, India,” Environ. Geol., vol. 49, no. 3, pp. 413–429, 2006, doi: 10.1007/s00254-005-0089-9.

[45] R. Khosravi et al., “Use of geographic information system and water quality index to assess groundwater quality for drinking purpose in Birjand city, Iran,” Desalin. Water Treat., vol. 67, pp. 74–83, 2017, doi: 10.5004/dwt.2017.20458.