E-ISSN:2709-6130
P-ISSN:2618-1630

Research Article

International Journal of Innovations in Science & Technology

2024 Volume 6 Number 1 Jan-Mar

Cluster Analysis of COVID-19 Through Genome Sequences Using Python Bioinformatics Library

Ghauri. M, Mahoto. N. A, Bhatti. S, Umar. A

Department of Software Engineering, Mehran University of Engineering & Technology Jamshoro, Pakistan

Abstract

Introduction and Importance of Study:

During the COVID-19 pandemic, mortality rates varied across different regions of the world. To better understand the virus's behavior, it's important to gain in-depth knowledge of the nucleotide records of the COVID-19 genomic sequence.

Novelty Statement:

In the study, researchers analyzed clusters of highly affected countries to find similar codons in countries with a similar effect of the virus through Python based library.

Material And Method:

Nucleotide records were extracted from the NCBI database in FASTA format. Further Python Bioinformatics library was used to form the clusters of each country using the K-means clustering technique.

Result and Discussion:

The study focuses on finding the similarities between the codons of amino acids in different countries that are affected in a similar way during COVID-19. For instance, China and the EU have a lower mortality rate and have Leucine, Methionine, Isoleucine, and Valine amino acids in common. On the other hand, countries like Pakistan and India have Leucine, Isoleucine, Valine, and Threonine in common and an average death rate. Moreover, Brazil and the US have a higher mortality rate and share similar codons such as Leucine, Glutamine, and Amber.

Concluding Remarks:

The study shows that countries affected by COVID-19 in a similar way share some common amino acids and their respective codons.


Keywords: Amino acids, Clustering algorithm, Codons, COVID-19, Genome sequences, Nucleotide.

Corresponding Author How to Cite this Article
Maryam Ghauri, Department of Software Engineering, Mehran University of Engineering & Technology Jamshoro, Pakistan
Maryam Ghauri, Naeem Ahmed Mahoto, Sania Bhatti, Aqsa Umar, Cluster Analysis of COVID-19 Through Genome Sequences Using Python Bioinformatics Library. IJIST. 2024 ;6(1):265-274 https://journal.50sea.com/index.php/IJIST/article/view/688

Introduction

The SARS-CoV-2 pandemic, also known as COVID-19, has resulted in the identification of thousands of genetic variants among patient isolates. SARS-CoV-2 is the virus responsible for causing COVID-19, a highly contagious respiratory illness that has become a global pandemic [1]. SARS-CoV-2 is derived from its family of viruses called coronaviruses, which are recognized by their crown-like spikes on the surface. This virus is primarily responsible for respiratory diseases, leading to flu-like symptoms such as fever, cough, runny nose, sore throat, shortness of breath, and fatigue [2]. The first cases of pneumonia were reported in Wuhan, Hubei Province, China in December 2019. Later, these cases were confirmed as SARSCoV-2 infections [3]. As of writing this study, the virus has now spread to over 200 countries, infecting more than 700 million people and causing over 6 million deaths globally [4].

SARS-CoV-2 is a virus that contains a single strand of positive-sense RNA. This RNA strand directly codes for proteins and is made up of around 30,000 nucleotides [2][3]. The genome is divided into different regions that code for various proteins, the most important being the spike protein. The spike protein forms the spikes on the virus's surface and allows it to enter human cells by binding to a receptor called ACE2. The spike protein also determines the antigenicity of the virus, meaning how well it can be recognized and neutralized by the immune system [1][5]. On January 12, 2020, Chinese researchers revealed the genetic sequence of COVID-19, which is said to be a COVID-19 genome sequence [6]. To understand the epidemiological characteristics of coronavirus, it is important to grasp the in-depth knowledge of its genome sequence. For this purpose, we have taken genome sequences of highly populated countries with higher infection and death ratios for our study.

It is crucial to understand the impact of COVID-19 variants in different regions of the world. This study aims to analyze the diverse effects of COVID-19 on different countries. For example, countries like Brazil and the USA have higher confirmed cases and mortality rates, while India and Pakistan have an average death rate during the same period. Similarly, the European Union and China have comparatively higher confirmed cases but lower death rates. To understand the coronavirus dynamics, it is significant to gain in-depth knowledge of population disease patterns using their genome sequence. Based on data from the World Health Organization (WHO) dated November 13, 2023 [4], there have been confirmed cases of COVID-19 in Brazil, China, EU, India, Pakistan, and the USA i.e. 38,303,320, 503,302, 38,997,490, 45,025,076, 1,580,631, 103,436,829 respectively.

Figure 1: The standard RNA codon table

Codons:

The genetic code is composed of four DNA nucleotide bases - A, T, G, and C - (or A, U, G, C in RNA) which can be arranged in 3-base long sequences, resulting in 64 different combinations [7] as shown in Figure 1. These combinations are known as codons and they determine the type of amino acid that will be incorporated into a protein. Although there are only 20 types of amino acids, multiple codons can code for the same amino acid, except for Tryptophan and Methionine [8]. Therefore, there are a total of 64 unique codons in the genetic code. Some examples of codons are: Leucine is an amino acid that contains UUA, UUG, CUU, CUC, CUA, and CUG codons as shown in Figure 1. Some codons are used more frequently while others are rare codons such as AGG, AGA, CUA, CGA, and CCC [9].

Literature Review:

A lot of work has been done on the genomic sequence of COVID-19. Studies [10][11][12][13] suggest that COVID-19 primarily spreads through close contact with infected patients. Reports from hospital staff and doctors indicate that the majority of infections occurred while on the job (54%). It is currently unclear who the source of the infection was in most cases, but a small percentage of cases have been attributed to colleagues or patients (7% or 6%, respectively) [12]. The rapid and widespread transmission of SARSCoV-2 has resulted in numerous mutations of the virus, particularly in its spike protein, with the D614G mutation significantly enhancing its viability [13][14]. Various studies have found location-specific mutations by comparing viral sequences from different parts of the world such as Asia, Africa, Europe, North America, South America, and Oceania with the SARSCoV-2 virus that originated in Wuhan, China in December 2019 [15][16]. In recent studies, researchers have used the CLOFAST algorithm to extract frequent nucleotide patterns from COVID-19 data based on geographic location [17][18][19]. The studies have highlighted the frequent amino acids present in the data. Another study [20] has provided additional information about the epidemiology of SARS-CoV-2 in Turkey. The clinical information of patients with specific Delta variant symptoms was analyzed, and the phylogenetic analysis showed that nine clusters of viruses were isolated in Kahramanmara city. Importantly, there was no mixing of clusters with sequences from different regions of Turkey, indicating that the infection was transmitted locally.

Objectives and Novelty Statement:

This study aims to examine the genomic causes of differences in mortality rates between various regions during the COVID-19 pandemic. The aim is achievable by the following

Objectives:

Applying clustering algorithm on the nucleotide sequence of COVID-19 records through Python library.

Analyzing the clusters based on the codons before and after applying the clustering techniques.

To analyze the availability of similar codons across different regions and gain a broader insight into varying mortality rates.

The paper is organized into the following sections. Section II presents the proposed research study workflow, which involves the use of a clustering algorithm to identify nucleotides that encode codons and to discover their similarity among different regions. In Section III, we discuss the results in detail. Finally, Section IV presents some concluding remarks to wrap up the paper.

Material and Method

To identify similarities between various COVID genome sequences, we utilized clustering techniques that involve machine learning algorithms. Our proposed methodology comprises four key steps: data collection, genome sequence conversion, data clustering, and cluster evaluation, as illustrated in Figure 2.

Data Description:

Datasets regarding the COVID-19 genome sequences of Brazil, China, EU, India, and Pakistan have been collected from the NCBI database. From this data hub, we downloaded genome sequences in the form of proteins or nucleotide records. We downloaded the nucleotide records in the FASTA format [21]. Table 1 presents the record of data on the number of confirmed COVID-19 cases and death rates in different countries. Brazil and the USA have higher figures compared to other countries. On the other hand, India and Pakistan faced an average number of confirmed cases and a moderate death rate. Despite having an average number of confirmed cases, China has a lower mortality rate. Additionally, the European Union has the highest number of confirmed cases, but a lower death rate when compared to other countries on a per million records. To better understand the changing trends across various countries, we conducted clustering experiments on the nucleotide sequence of each country. Before that, we extracted amino acid counts from each country, as shown in Table 1.

Table 1: Data Record per million

Genome Sequence Conversion:

DNA sequences are made up of four nucleotides: Adenine, Thymine, Cytosine, and Guanine, which are represented by the letters A, T, C, and G, respectively as shown in Table 2. To use these nucleotides in a clustering algorithm, they are first converted into their digital form known as sequence dataset. So, the letters are converted as A to 1, T as 2, C as 3, and G as 4.

Table 2: Nucleotide records in FASTA format.

Figure 2: Workflow Diagram

Code of Python Library:

from Bio import SeqIO

from sklearn.feature_extraction.text import TfidfVectorizer

from sklearn.cluster import AgglomerativeClustering

import numpy as np

# Function to load genome sequences from a FASTA file

def load_sequences(fasta_file):

sequences = []

for record in SeqIO.parse(fasta_file, "fasta"):

sequences.append(str(record.seq))

return sequences

# Function to perform cluster analysis

def perform_cluster_analysis(sequences, n_clusters):

vectorizer = TfidfVectorizer(analyzer='char', lowercase=False)

X = vectorizer.fit_transform(sequences)

clustering = AgglomerativeClustering(n_clusters=n_clusters)

labels = clustering.fit_predict(X.toarray())

return labels

# Main function

def main():

# Load genome sequences

fasta_file = "covid19_genome_sequences.fasta"

sequences = load_sequences(fasta_file)

# Perform cluster analysis

n_clusters = 5 # You can adjust this number based on your data

cluster_labels = perform_cluster_analysis(sequences, n_clusters)

# Print cluster labels

for idx, label in enumerate(cluster_labels):

print(f"Sequence {idx+1}: Cluster {label}")

if __name__ == "__main__":

main()

Sequence Data Clustering:

Gene sequence clustering is the process of grouping similar or related DNA or RNA sequences into clusters based on some measure of similarity. To perform Clustering algorithms, the K-means algorithm is used because of its vast use in the literature [22][23][24] and its advantages, such as its simplicity, efficiency, and effectiveness in data grouping. Moreover,

K-means can handle large and high-dimensional datasets, as it only uses the distances between the objects and the cluster centers.

K-means can produce compact and well-separated clusters, as it minimizes the withincluster variance.

Data Evaluation:

To evaluate the results, firstly, the total count of amino acids were extracted from each country. Then, the K-means algorithm was applied to each country to form clusters. The clusters were evaluated based on their codons. Finally, the countries having similar codons were grouped to arrive at the final result and labeled as Cluster 1, Cluster 2, and Cluster 3. The similarity of codons between the countries is evaluated on the mortality rates of each country. These results are then compared with the previous studies to get a better insight.

Result and Discussion

These genome sequences can be found in the NCBI database as of November 8th, 2023. 
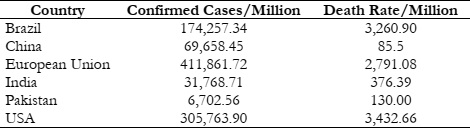
Table 1 provides an estimate of the number of confirmed cases and mortality rates for the aforementioned countries. As the population of these countries differs, to compare death and confirmed cases records, we have analyzed data per million records.

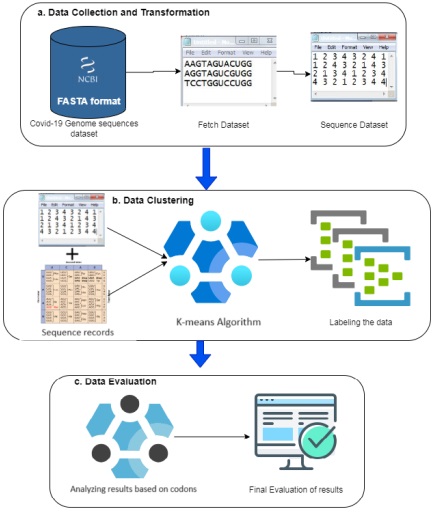
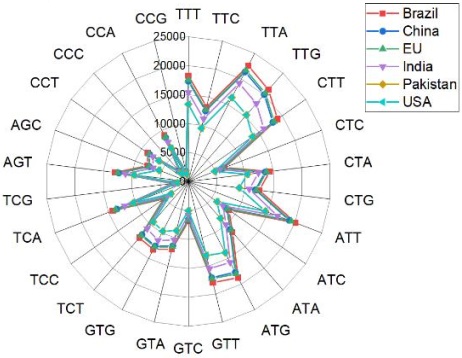
All the experiments were performed using the Bioinformatics library of Python. Figure 3 represents the distribution or frequency of specific amino acid codons across various geographical locations or datasets before applying clustering algorithms. The counts in each cell denote how many times a particular codon for a specific amino acid appeared in the corresponding region. Based on the data presented in Figure 3, it can be observed that Leucine (TTA) has the highest count of amino acids in raw data, occurring 22586 times in Brazil. Similarly, Leucine (TTA) appears 21717 times in the EU and 21377 times in | (TTG) appears 21186 times in Brazil, while Cystine (TGT) appears 20568 times in Brazil, Leucine (TGT) appears 20370 times in the EU, also, Isoleucine (ATT) appears 20092 times in Brazil. After clustering, the count of frequent amino acids is limited compared to the huge count of codons in the original data.

Figure 3: Count of amino acid codons in each dataset

Figure 4: Inertia Vs K plot

Clustering Results:

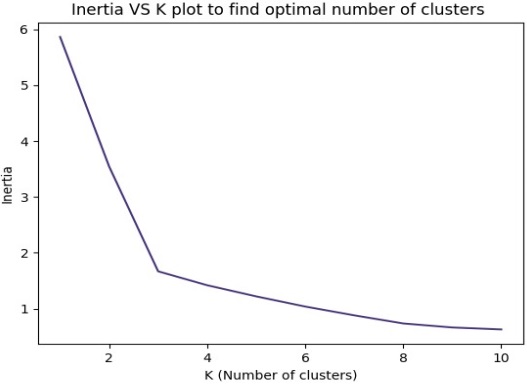
To apply the K-means algorithm [25], we need to determine the number of clusters, denoted as "K". To achieve this, we can use the elbow method. This method involves plotting a line graph between SSE (Sum of Squared Errors) and the number of clusters and identifying the point where the graph changes direction as shown in Figure 4.. This point is known as the "elbow point" and indicates the optimal number of clusters, as it is the point after which SSE or inertia starts decreasing linearly. The elbow point in Figure 4 represents the point in the SSE / Inertia plot where SSE or inertia starts decreasing, Here the elbow point is decreasing at point 3 so the value for k=3.

Count for Amino Acid Codons:

In this subsection, we have applied the TF-IDF method from the Python Bioinformatics library [26]. It can be defined as calculating how relevant a word in a series or corpus is to a text. The weight of a term that occurs in a document is simply proportional to the term frequency.

tf(t,d) = count of t in d / number of words in d

This tests the meaning of the text, which is very similar to TF, in the whole corpus collection. The only difference is that in document d, TF is the frequency counter for a term t, while df is the number of occurrences in the document set of the term t. In other words, the number of papers in which the word is present is DF.

df(t) = occurrence of t in documents

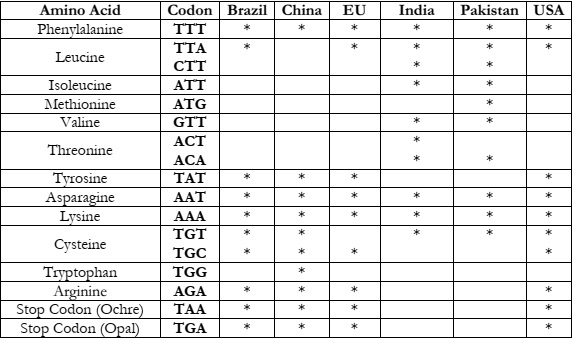
As the value of K is 3, we have obtained 3 clusters for each country. In Table 2-4, we have listed the codons with each amino acid to study their occurrence after clustering. Table 2 displays the frequency of codons present in Cluster 1 for each country, and similarly, Table 3 and Table 4 represent Cluster 2 and Cluster 3, respectively.

It can be observed that Phenylalanine (TTT) and Lysine (AAA) are present in all countries and each cluster so it’s a common amino acid present in all countries. In Table 3 (also named Cluster 1), Asparagine (AAT) is present in all countries. Tryptophan (TTG) is only present in China in Cluster 1 whereas Stop codon (Opal) and Arginine (AGA) are present in all countries except India and Pakistan in Cluster 1. Cluster 1 also shows that in India and Pakistan CTT, ATT, GTT and ACA are present but not in any other country. It is possible that these codons are responsible for the similar effects observed in both countries.

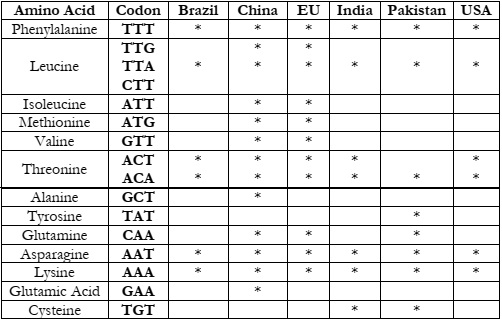
In Table 4, Threonine (ACA) and Asparagine are present in all countries. TTG, ATG, ATT, GTT, and CAA codons are mostly present in China and the European Union only. Stop codons Opal and Ochre are present in all countries except for India and Pakistan. So the abovementioned codons if found in other countries may have similar effects for such pandemics that are found similar in China and the EU.

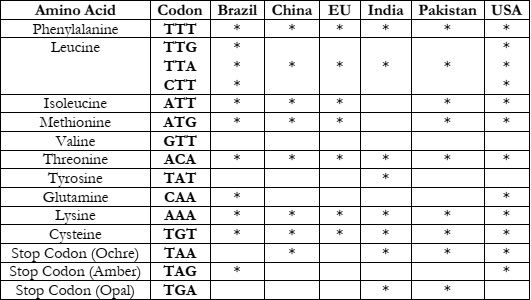
In Table 5, Leucine, threonine, and Cysteine and Lycine amino acids are found in almost all countries. But TTG, CTT, CAA, and TAG are mostly present in Brazil and the USA. As the Brazil and USA are highly affected countries with higher mortality rates it can be observed that these similar codons could be the reason for the similar effects of the COVID-19 pandemic.

Table 3: Codons for Cluster 1

Table 4: Codons for Cluster 2

Table 5: Codons for Cluster 3

Discussion:

Based on the previous results, it can be inferred that China and the EU have a lower mortality rate due to their genome containing similar codons such as TTG, ATG, ATT, GTT, and CAA from cluster 2, which are not commonly found in other countries. Similarly, countries like Pakistan and India, with similar codons in their genome, such as CTT, ATT, GTT, and ACA, have an average death rate and confirmed cases and can be considered medium-risk countries for similar viruses. On the other hand, Brazil and the US have a higher mortality rate and are highly affected countries with matching codons such as TTG, CTT, CAA, and TAG. Therefore, countries with similar codons may have a high potential for such viruses. As in the previous study [18], authors found some frequent amino acids in India, Pakistan, and China for the Covid-19 genome sequence using the Clo Fast algorithm with varying min threshold, it shows the availability of frequent codons in these 3 countries however our study tends to focus on similar codons in different regions which gives better insight specifically for vaccination purposes.

Conclusion and Future Work

In conclusion, COVID-19 has left a historic pandemic in its wake around the world. To prevent future pandemics, it is important to conduct more in-depth genomic studies to control mortality rates and the severity index of such viruses. As this study shows, countries with Leucine (TTG), Isoleucine (CTT), Glutamine (CAA), and Amber (TAG) amino acids in their genomic sequence can be heavily affected, while countries with codons Leucine (TTG), Methionine (ATG), Isoleucine (AT T), and Valine (GTT) amino acids are less affected by such viruses. This study can help different countries to be prepared for future pandemics for such global outbreaks by investing in some precautional vaccines based on their codon structure. It could help bioinformatics to learn more about genomic sequences for different countries and how their codon patterns are similar to one another. This study can be further extended by creating a classification model on the above results, which could make it easier to identify countries with similar codon patterns.

Acknowledgement:

This study is not published anywhere.

Author’s Contribution:

All authors contributed significantly and equally in conducting and writing this research work.

Conflict of Interest:

The authors declare they have no conflict of interest in publishing this manuscript in IJIST.

Project details: This research was not part of any project.

Reference

[1] D. Cucinotta and M. Vanelli, “WHO Declares COVID-19 a Pandemic,” Acta Biomed., vol. 91, no. 1, pp. 157–160, 2020, doi: 10.23750/ABM.V91I1.9397.

[2] A. N. Sajed and K. Amgain, “Coronavirus Disease (COVID-19) Outbreak and the Strategy for Prevention,” Eur. J. Med. Sci. , vol. 2, no. 1, pp. 1–3, Mar. 2020, doi: 10.46405/EJMS.V2I1.38.

[3] F. Wu et al., “A new coronavirus associated with human respiratory disease in China,” Nat. 2020 5797798, vol. 579, no. 7798, pp. 265–269, Feb. 2020, doi: 10.1038/s41586- 020-2008-3.

[4] “COVID-19 cases | WHO COVID-19 dashboard.” Accessed: Mar. 03, 2024. [Online]. Available: https://data.who.int/dashboards/covid19/cases?n=c

[5] S. Raskin, “Genetics of COVID-19,” J. Pediatr. (Rio. J)., vol. 97, no. 4, pp. 378–386, Jul. 2021, doi: 10.1016/J.JPED.2020.09.002.

[6] I. Fricke-Galindo and R. Falfán-Valencia, “Genetics Insight for COVID-19 Susceptibility and Severity: A Review,” Front. Immunol., vol. 12, p. 622176, Apr. 2021, doi: 10.3389/FIMMU.2021.622176/BIBTEX.

[7] P. D. Cristea, “Conversion of nucleotides sequences into genomic signals,” J. Cell. Mol. Med., vol. 6, no. 2, pp. 279–303, Apr. 2002, doi: 10.1111/J.1582-4934.2002.TB00196.X.

[8] F. Castro-Chavez, “Most Used Codons per Amino Acid and per Genome in the Code of Man Compared to Other Organisms According to the Rotating Circular Genetic Code,” Neuroquantology, vol. 9, no. 4, pp. 747–767, 2011, doi: 10.14704/NQ.2011.9.4.500.

[9] T. F. Clarke IV and P. L. Clark, “Rare Codons Cluster,” PLoS One, vol. 3, no. 10, p. e3412, Oct. 2008, doi: 10.1371/JOURNAL.PONE.0003412.

[10] A. Baranova, H. Cao, S. Teng, K. P. Su, and F. Zhang, “Shared genetics and causal associations between COVID-19 and multiple sclerosis,” J. Med. Virol., vol. 95, no. 1, p. e28431, Jan. 2023, doi: 10.1002/JMV.28431.

[11] K. S. te Paske, C. van Tienen, D. Dunk, D. van Pelt, and P. W. Smit, “SARS-CoV-2 transmission among health care workers, an outbreak investigation using whole-genome sequencing,” PLoS One, vol. 18, no. 3, p. e0283292, Mar. 2023, doi: 10.1371/JOURNAL.PONE.0283292.

[12] H. C. Maltezou et al., “SARS-CoV-2 Infection in Healthcare Personnel With High-risk Occupational Exposure: Evaluation of 7-Day Exclusion From Work Policy,” Clin. Infect. Dis., vol. 71, no. 12, pp. 3182–3187, Dec. 2020, doi: 10.1093/CID/CIAA888.

[13] J. Kim, S. Cheon, and I. Ahn, “NGS data vectorization, clustering, and finding key codons in SARS-CoV-2 variations,” BMC Bioinformatics, vol. 23, no. 1, pp. 1–24, Dec. 2022, doi: 10.1186/S12859-022-04718-7/TABLES/4.

[14] B. Korber et al., “Tracking Changes in SARS-CoV-2 Spike: Evidence that D614G Increases Infectivity of the COVID-19 Virus,” Cell, vol. 182, no. 4, pp. 812-827.e19, Aug. 2020, doi: 10.1016/J.CELL.2020.06.043.

[15] L. Zhang et al., “SARS-CoV-2 spike-protein D614G mutation increases virion spike density and infectivity,” Nat. Commun. 2020 111, vol. 11, no. 1, pp. 1–9, Nov. 2020, doi: 10.1038/s41467-020-19808-4.

[16] L. Guruprasad, “Human SARS CoV-2 spike protein mutations,” Proteins Struct. Funct. Bioinforma., vol. 89, no. 5, pp. 569–576, May 2021, doi: 10.1002/PROT.26042.

[17] D. Mercatelli and F. M. Giorgi, “Geographic and Genomic Distribution of SARS-CoV-2 Mutations,” Front. Microbiol., vol. 11, p. 555497, Jul. 2020, doi: 10.3389/FMICB.2020.01800/BIBTEX.

[18] A. Umar, N. A. Mahoto, S. Bhatti, and S. Rathi, “Analysis of Covid-19 Genome Sequences based on Geo-Locations,” Pakistan J. Eng. Technol., vol. 4, no. 4, pp. 41–45, Dec. 2021, doi: 10.51846/VOL4ISS4PP41-45.

[19] M. R. Islam et al., “Genome-wide analysis of SARS-CoV-2 virus strains circulating worldwide implicates heterogeneity,” Sci. Reports 2020 101, vol. 10, no. 1, pp. 1–9, Aug. 2020, doi: 10.1038/s41598-020-70812-6.

[20] N. Marascio et al., “Molecular Characterization and Cluster Analysis of SARS-CoV-2 Viral Isolates in Kahramanmaraş City, Turkey: The Delta VOC Wave within One Month,” Viruses 2023, Vol. 15, Page 802, vol. 15, no. 3, p. 802, Mar. 2023, doi: 10.3390/V15030802.

[21] D. A. Benson, I. Karsch-Mizrachi, D. J. Lipman, J. Ostell, and D. L. Wheeler, “GenBank,” Nucleic Acids Res., vol. 36, no. suppl_1, pp. D25–D30, Jan. 2008, doi: 10.1093/NAR/GKM929.

[22] J. A. Botía et al., “An additional k-means clustering step improves the biological features of WGCNA gene co-expression networks,” BMC Syst. Biol., vol. 11, no. 1, pp. 1–16, Apr. 2017, doi: 10.1186/S12918-017-0420-6/FIGURES/7.

[23] H. Z. Girgis, “MeShClust v3.0: high-quality clustering of DNA sequences using the mean shift algorithm and alignment-free identity scores,” BMC Genomics, vol. 23, no. 1, pp. 1–16, Dec. 2022, doi: 10.1186/S12864-022-08619-0/FIGURES/3.

[24] A. Melnyk et al., “From Alpha to Zeta: Identifying variants and subtypes of SARS-CoV- 2 via clustering,” bioRxiv, p. 2021.08.26.457874, Aug. 2021, doi: 10.1101/2021.08.26.457874.

[25] N. Shi, X. Liu, and Y. Guan, “Research on k-means clustering algorithm: An improved k-means clustering algorithm,” 3rd Int. Symp. Intell. Inf. Technol. Secur. Informatics, IITSI 2010, pp. 63–67, 2010, doi: 10.1109/IITSI.2010.74.

[26] “Biopython · Biopython.” Accessed: Mar. 03, 2024. [Online]. Available: https://biopython.org/