E-ISSN:2709-6130
P-ISSN:2618-1630

Research Article

International Journal of Innovations in Science & Technology

2024 Volume 6 Number 1 Jan-Mar

Algorithmic Implementation and Evaluation for Image Segmentation Techniques

Ijaz. U1, Gillani. F2, Sharif. M. S1, Iqbal. A1 , Anwar. M. F1, Ijaz. A3

1 Department of Electrical Engineering & Technology, GC University, Faisalabad

2 Department of Mechanical Engineering and Technology, GC University, Faisalabad

3 WASA, Faisalabad

Abstract
This research conducts a comprehensive comparative analysis of five prominent image segmentation algorithms, including Thresholding, K-Means Clustering, Mean Shift, Graph-Based Segmentation (Watershed), and U-Net (Deep Learning). The study employs a diverse set of five images and associated masks to rigorously evaluate algorithmic performance using key metrics such as Jaccard Index, Dice Coefficient, Pixel Accuracy, Hausdorff Distance, and Mean Intersection over Union. The findings reveal that the Threshold Algorithm consistently outperformed its counterparts, achieving perfect scores in Jaccard Index, Dice Coefficient, Pixel Accuracy, and Mean Intersection over Union, while minimizing Hausdorff Distance to 0. This emphasized its exceptional accuracy, precision, and agreement with ground truth segmentation, positioning it as an optimal choice for applications demanding precise segmentation, such as medical imaging or object detection. The research underscores the need to carefully consider specific application requirements and tradeoffs when selecting an algorithm, offering valuable guidance to researchers and practitioners in the field of image segmentation. The standardized approach outlined in the material and methods section ensures fair comparisons, making this study a valuable resource for informed decision-making in diverse imaging applications.

Keywords: Image Segmentation, Comparative Analysis, Algorithm Evaluation, Jaccard Index, Dice Coefficient, Pixel Accuracy, Hausdorff Distance, Mean Intersection over Union, Image Processing, Computational Metrics.

Corresponding Author How to Cite this Article
Umer Ijaz, Department of Electrical Engineering & Technology, GC University, Faisalabad
Umer Ijaz, Fouzia Gillani, Muhammad Saad Sharif, Ali Iqbal, Muhammad Fraz Anwar, Abubaker Ijaz, Algorithmic Implementation and Evaluation for Image Segmentation Techniques. IJIST. 2024 ;6(1):249-264 https://journal.50sea.com/index.php/IJIST/article/view/691

Introduction

Image segmentation is a fundamental step in computer vision and medical imaging, essential for extracting meaningful information from visual data. In this context, the current research aims to conduct a comprehensive evaluation of five prominent image segmentation algorithms, namely Thresholding, K-Means Clustering, Mean Shift, Graph-Based Segmentation (Watershed), and U-Net (Deep Learning). The importance of such a comparative analysis stems from the increasing reliance on image segmentation in diverse applications, including object recognition, medical diagnosis, and autonomous systems. Despite the abundance of segmentation algorithms, there exists a research gap in terms of a unified and rigorous evaluation methodology that considers multiple metrics. Existing studies often focus on individual algorithms or limited metrics, lacking a holistic understanding of algorithmic performance across varied conditions. This research aims to bridge this gap by conducting a systematic evaluation based on key metrics, including Jaccard Index, Dice Coefficient, Pixel Accuracy, Hausdorff Distance, and Mean Intersection over Union, thereby providing a nuanced perspective on the strengths and weaknesses of each algorithm. Image segmentation [1] is fundamental to image processing, serving as a crucial step in various applications. Numerous techniques exist for segmenting images, necessitating the development of evaluation methods to assess segmentation quality effectively. Image segmentation [2] involves partitioning an image into meaningful components, facilitating targeted analysis and interpretation. While a plethora of segmentation algorithms exist in the literature, the quest for an efficient technique adaptable to diverse images persists. The crux of an algorithm's efficacy lies in its ability to deliver superior segmentation results. Image segmentation [3] stands at the forefront of digital image processing, serving as a pivotal step with wide-ranging applications across numerous domains. From object co-segmentation to medical imaging and machine vision, its utility spans various tasks crucial for analysis and understanding. Image processing stands as a cornerstone of modern technological advancements, offering a suite of techniques to refine raw images captured from diverse scenes. Central to image analysis and preprocessing, the segmentation process [4], divides images into meaningful components for further analysis. In this context, standard multilevel thresholding methods emerge as highly efficient solutions, renowned for their computational efficiency, reliability, swift convergence, and precision. Image segmentation [5] is a critical process in image analysis, aimed at dividing an image into distinct, non-overlapping parts characterized by similar features. This segmentation serves as the foundation for subsequent tasks such as feature extraction and target recognition. The choice of segmentation method significantly influences the accuracy of these downstream processes. The problem statement revolves around the need for researchers and practitioners to make informed decisions when choosing an image segmentation algorithm, considering the specific requirements of their applications. The proposed solution involves a thorough examination of algorithmic performance under diverse scenarios, enabling a more informed selection process.

Objectives:

The primary objectives include assessing the quantitative performance of each algorithm, identifying their relative strengths and weaknesses, and providing insights into their suitability for specific applications.

Novelty Statement:

A notable novelty in this research lies in its comprehensive approach, considering multiple metrics and diverse images, resulting in a nuanced understanding of algorithmic performance. The novelty is justified by evolving landscape of image segmentation, where a one-size-fits-all approach is often insufficient. By offering a comprehensive evaluation, this research contributes to the existing body of knowledge and guides researchers and practitioners in algorithm selection.

The subsequent sections of the research paper will delve into the Related Work, focusing on discussing the individual blocks of the research paper, identify research gaps, evaluate the feasibility of addressing these gaps, and support discussions with the latest citations and properly cited figures. Material and Methods, presenting a standardized approach for algorithmic evaluation. The focus of the Results and Analysis Section will be on presenting and analyzing graphs, as well as creating and analyzing consolidated tables to effectively communicate the outcomes of the research. The Discussion Section will interpret research findings, explore their implications for practical applications, and analyze tradeoffs and considerations associated with the study. The conclusions will synthesize these findings, emphasizing the practical implications for image segmentation applications and suggesting avenues for future research in this evolving field.

Related Work:

Image segmentation (Figure 1), a foundational task in computer vision, involves the intricate process of dividing a digital image into meaningful and homogeneous regions. The journey begins with the input image, followed by optional preprocessing steps has a noise reduction and smoothing to enhance data quality. Feature extraction offers a nuanced understanding of color, texture, and intensity, influencing subsequent segmentation. The core algorithm, encompassing techniques like thresholding, region growing, and clustering, partitions the image into distinct regions. Optional post-processing refines these segments through region merging/splitting and boundary smoothing. Object recognition, if incorporated, identifies and labels specific patterns within segments. Visualization, crucial for validation, employs techniques such as color assignment. The final output highlights the meticulously delineated regions or objects. Notably, the adaptability of segmentation algorithms to diverse input characteristics and specific task objectives is paramount, with emerging deep learning approaches like convolutional neural networks and semantic segmentation networks advancing the field's capabilities.

Figure 1: Steps of Typical Image Segmentation Algorithms

Figure 2: Steps of Thresholding Algorithm

Existing literature provides valuable insights into each algorithm, emphasizing their unique characteristics and applications. However, a critical examination reveals notable research gaps. In the case of thresholding, recent studies (Figure 2) highlight its simplicity but underscore its sensitivity to noise and varying illumination conditions, necessitating a comprehensive evaluation to understand its limitations.

Thresholding image segmentation [6] is a fundamental technique in medical physics, crucial for accurately identifying tumors and other abnormalities in medical images. This segmentation process involves dividing an image into distinct regions based on intensity levels, allowing for the extraction of valuable information vital for diagnosis and treatment planning. Multilevel thresholding [7] has emerged as a prominent method for improving segmentation accuracy and enabling the extraction of finer details from images. The quality of segmented images hinges on the selection of appropriate threshold values, a process that necessitates careful consideration and optimization techniques. In the pursuit of enhancing research quality, various techniques have been explored, including region-based, threshold-based [8], edge-based, and feature-based clustering methods. Among these, thresholding techniques have gained traction due to their simplicity and effectiveness in segmenting images.

Front-End:

Known for its simplicity in parameter tuning and ease of implementation, making it accessible to users with varying levels of computational expertise [9].

Back-End:

Demonstrates computational efficiency and straightforward integration into existing software environments, contributing to its user-friendliness [10].

Figure 3: Steps of K-Means Clustering Algorithm

K-Means Clustering (Figure 3) has been extensively explored, highlighting its efficacy in color-based segmentation. However, its sensitivity to initial centroids and susceptibility to noise remain in research gaps that require further investigation. The feasibility of our work in addressing these gaps lies in the systematic comparison across multiple metrics, allowing for a nuanced understanding of algorithmic strengths and weaknesses under diverse conditions. The k-means clustering algorithm [11] stands as a cornerstone in data mining, revered for its versatility and efficacy in partitioning data into coherent clusters. Despite its widespread adoption, the algorithm grapples with certain limitations, including issues stemming from random centroid initialization and the need to predefine the number of clusters, leading to suboptimal convergence and sensitivity to outlier effects. Moreover, the algorithm's rigidity in handling diverse data types poses a significant challenge. K-means algorithm [12] is commonly employed for segmentation tasks, its reliance on predefining the number of clusters often leads to manual intervention and may compromise segmentation quality. K-means algorithm [13] stands as a reliable clustering technique, renowned for its simplicity and computational efficiency. However, despite its widespread popularity, the algorithm grapples with several challenges that impede its clustering performance.

Front-End:

Offers a straightforward approach to clustering and segmentation, with intuitive parameter settings [14].

Back-End:

Provides efficient processing, particularly in scenarios with well-separated clusters, making it suitable for integration into various applications [15].

Mean Shift (Figure 4) is acknowledged for its adaptability to data distribution. However, recent literature highlights challenges in effectively handling large datasets and limitations in capturing minute details, underscoring the need for a thorough assessment to inform its optimal utilization. Mean shift image segmentation [16] represents a promising solution to the computational challenges faced by embedding-based deep learning algorithms in cell segmentation and tracking. While embedding-based approaches offer simultaneous instance segmentation and tracking, they suffer from slow inference speeds, limiting their practical deployment. Mean shift image segmentation [17], rooted in an established pattern recognition technique, offers a powerful computational approach for tracking targets in varying backgrounds. Traditionally, in gray level feature domains, spatial information can be lost when background and target histograms overlap. Mean Shift image segmentation [18] offers a robust approach to Network Architecture Search (NAS), addressing stability issues encountered in traditional methods like Differentiable Architecture Search (DARTS). While DARTS excels in efficiency, it often falters when discretizing continuous architectures, leading to deteriorating performance.

Figure 4: Steps of Mean Shift Algorithm

Front-End:

Simplicity in concept and implementation, with fewer parameters to tune compared to other clustering algorithms [19].

Back-End:

Offers robust performance and convergence properties, facilitating its use in automated systems and real-time applications [20].

Figure 5: Steps of Graph-Based Segmentation (Watershed) Algorithm

Graph-Based Segmentation (Watershed) (Figure 5) has demonstrated success in segmenting images with irregular boundaries, but discussions in recent publications highlighted the need for a unified evaluation framework considering multiple metrics. Graph-Based Segmentation [21], particularly Watershed segmentation, offers a powerful solution to automatic and efficient image segmentation, addressing challenges faced by other methods such as Adaptive Morphological Reconstruction (AMR) and density peak clustering. While AMR can be influenced by initial structuring elements and density peak clustering can be complex, our proposed fast and automatic image segmentation algorithm, FAS-SGC, overcomes these limitations. Graph-Based Segmentation [22], particularly Watershed segmentation, is a versatile technique finding increasing utility across various domains including photography, robotics, remote sensing, and medical diagnosis. In the realm of image processing, segmentation methods play a pivotal role in delineating meaningful structures for subsequent analysis. Graph-Based Segmentation [23], particularly Watershed segmentation, has garnered significant attention in the realm of image processing, particularly with the recent advancements in complex networks theory. This approach offers a robust framework for segmenting images into meaningful connected components, leveraging community detection algorithms derived from complex networks.

Front-End:

Provides a clear conceptual framework, allowing users to understand and manipulate segmentation results intuitively [24].

Back-End:

Adaptable to various image types and structures, with efficient algorithms available for implementation, enhancing its usability in diverse contexts [25].

Figure 6: Steps of U-Net Algorithm

U-Net (Deep Learning) (Figure 6) has witnessed extensive adoption in medical image segmentation, leveraging deep learning capabilities. However, concerns about data-hungry training and generalizability underscore the importance of our work in providing a holistic view of its performance. U-Net [26] represents a significant advancement in image segmentation, particularly in the clinical domain where traditional statistical methods have faced challenges in efficiency and generalization. With the emergence of deep learning, convolutional neural networks have emerged as powerful tools for extracting information from data, revolutionizing tasks such as medical image segmentation. U-Net [27] stands as a formidable image segmentation technique tailored specifically for segmentation tasks, particularly in the realm of medical imaging. Its versatility and effectiveness have propelled it to the forefront of the medical imaging community, where it enjoys widespread adoption as the go-to tool for segmentation endeavors. U-Net [28] emerges as a formidable image segmentation technique, primarily tailored for medical image analysis, boasting the remarkable ability to achieve precise segmentation even with limited training data. This characteristic renders U-Net immensely valuable within the medical imaging community, leading to its widespread adoption as the quintessential tool for segmentation tasks. In summary, the related work established the foundation for our research by elucidating the individual strengths and limitations of image segmentation algorithms.

Front-End:

Offers a high degree of automation and adaptability, with pre-trained models available for straightforward use [29].

Back-End:

Requires significant computational resources for training and inference, but once implemented, offers state-of-the-art performance in complex segmentation tasks, particularly in medical imaging and computer vision applications [30].

By systematically addressing the identified research gaps and providing a comparative evaluation across multiple metrics, our work aims to contribute to the existing body of knowledge and guide researchers and practitioners in making informed decisions based on algorithmic performance in various scenarios.

Methodology

The Material and Methods section outlines the systematic approach employed in conducting the comprehensive comparative analysis of image segmentation algorithms. The evaluation is based on key metrics, including Jaccard Index, Dice Coefficient, Pixel Accuracy, Hausdorff Distance, and Mean Intersection over Union. The methodology encompasses data acquisition, performance metrics definition, and the implementation details of the study.

Data Collection:

The dataset used in this research comprises of five diverse images, each associated with their corresponding masks. The dataset [31] incorporates diverse subjects and scenes, considering factors such as image dimensions, color schemes, and intricacy. Ranging from 256x256 to 1024x1024 pixels, the images present a spectrum of attributes, from high-detail 24-bit color compositions to less intricate 8-bit color depictions. This diversity allows for a comprehensive evaluation of algorithm performance across varying color spectrums. The dataset includes two color modes: monochrome and chromatic, covering colors like red, green, and blue. Utilizing this dataset enables a detailed assessment of image enhancement algorithms in a broad spectrum of real-world scenarios, providing invaluable insights into their effectiveness across various image categories and complexities. The inclusion of various images ensured the evaluation's robustness across different visual scenarios. The images and masks were carefully selected to represent a spectrum of challenges, such as varied object shapes, sizes, and background complexities, to comprehensively assess algorithmic performance.

Evaluation Metric:

The performance of each image segmentation algorithm was evaluated using five well-established metrics: Jaccard Index, Dice Coefficient, Pixel Accuracy, Hausdorff Distance, and Mean Intersection over Union. These metrics provide an In-depth view of the algorithms' performance, addressing aspects such as segmentation accuracy, overlap, and boundary precision. Each metric was calculated at the individual image level and subsequently averaged to obtain a comprehensive evaluation across the entire dataset.

Jaccard Index:

The Jaccard Index [32][33][34] also known as the Intersection over Union (IoU), assesses the similarity between two sets by measuring the ratio of their intersection to their union. Ranging from 0 to 1, where 0 signifies no overlap and 1 indicates a perfect match, the Jaccard Index is a critical metric for evaluating the accuracy and precision of image segmentation algorithms. An optimum value of 1 indicates that the segmented region precisely matches the ground truth, highlighting the algorithm's ability to delineate objects accurately.

Dice Coefficient:

The Dice Coefficient [35][36] quantifies the similarity between two sets by considering the intersection and the average size of the sets. Its values range from 0 to 1, where 0 denotes no overlap and 1 represents perfect agreement. This metric turned particularly useful in assessing the robustness of segmentation algorithms, offering insights into how well they capture the true object boundaries. An optimum Dice Coefficient of 1 signifies a flawless segmentation with complete agreement between the segmented and ground truth regions.

Pixel Accuracy:

Pixel Accuracy [1][37] is a metric that measures the ratio of correctly classified pixels to the total number of pixels in the image. Ranging from 0 to 1, where 0 indicates no correct pixels and 1 signifies all pixels are correctly classified, this metric provides a straightforward assessment of algorithmic accuracy. An optimum value of 1 suggests that the segmentation algorithm precisely identifies each pixel, emphasizing the algorithm's capability to achieve accurate pixel-level segmentation.

Hausdorff Distance:

Hausdorff Distance [38][39] quantifies the maximum distance between the boundaries of two sets, providing a measure of dissimilarity. With a range from 0 to ∞, lower values indicate better agreement between the segmented and ground truth boundaries. An optimum value of 0 signifies a perfect match with no distance between boundaries, illustrating the algorithm's efficacy in capturing object shapes accurately, especially in scenarios with irregular or complex boundaries.

Mean Intersection Over Union (IOU):

Mean Intersection over Union (IoU) [40][41] calculates the average ratio of the intersection to the union of two sets and is particularly useful for multi-set evaluations. Ranging from 0 to 1, where 0 indicates no overlap and 1 signifies perfect overlap across sets, Mean IoU offers insights into the algorithm's consistency across multiple images. An optimum value of 1 indicates consistent and accurate segmentation across all sets, emphasizing the algorithm's reliability and robustness in diverse scenarios.

Figure 7: Implementation of Image Segmentation Algorithms Comparative Analysis

Implementation:

Image segmentation algorithms were implemented using MATLAB (version: 9.14.0.2206163 (R2023a)) and the image processing toolbox on a system equipped with an Intel Core i7 processor and 16GB RAM, running Microsoft Windows 10 Pro Version 10.0. This research employed a systematic and rigorous implementation strategy to evaluate the performance of five distinct image segmentation algorithms. Leveraging the MATLAB programming language and relevant libraries, the selected algorithms, including Thresholding, K-Means Clustering, Mean Shift, Graph-Based Segmentation (Watershed), and U-Net (Deep Learning), were systematically executed, as illustrated in Figure 1. The implementation encompasses tasks such as image and mask loading, algorithm execution, metric calculation, and graphical representation of results. The use of MATLAB ensures a standardized and accurate evaluation across various metrics, including Jaccard Index, Dice Coefficient, Pixel Accuracy, Hausdorff Distance, and Mean Intersection over Union. The detailed and graphical presentation of the results enhances the transparency and interpretability of the comparative analysis, contributing to the robustness of the research outcomes. The implementation of image segmentation algorithms is elucidated through Figure 7, providing a visual representation of the workflow and the stages involved in the systematic evaluation of algorithmic performance.

Reproducibility and Seed Parameters:

In ensuring the reproducibility of our study, we emphasized transparency and meticulous documentation of experimental procedures and configurations. The implementation, executed using MATLAB (version: 9.14.0.2206163 (R2023a)), including algorithm execution and metric evaluations, is presented comprehensively in this section. For accurate reproduction, we utilized same MATLAB version, with explicit documentation of library versions, particularly the image processing toolbox. Seed parameters, pivotal for consistency in experiments with random processes, were detailed for each algorithm, ensuring uniformity across different runs. The provided MATLAB script encapsulated the entire process, from loading images to generating graphical representations of Jaccard Index, Dice Coefficient, Pixel Accuracy, Hausdorff Distance, and Mean Intersection over Union metrics for the comparative analysis of image segmentation algorithms.

Parameter Definition and Weight Analysis:

In this section, we provide an overview of the parameters used in each image segmentation algorithm implemented in our research. Understanding these parameters is crucial for comprehending the functioning of the algorithms and their impact on segmentation results. We refer to established literature and standard practices to define these parameters.

Parameter Definition:

Threshold Level:

Thresholding involves selecting a threshold level to binarize the input image based on pixel intensity.

Number of Clusters (k):

K-Means Clustering requires specifying the number of clusters to partition the image into.

Bandwidth, kernel type:

Mean Shift clustering involves selecting a bandwidth parameter and a kernel type to define the kernel function used for density estimation.

Architecture, Learning Rate, Batch Size:

U-Net segmentation involves defining the neural network architecture, along with hyperparameters such as learning rate and batch size for training. Watershed segmentation typically does not require explicit parameter tuning. It relies on the gradient magnitude of the image to identify watershed basins.

Weight Analysis Explanation:

Assigning weights to parameters in image segmentation algorithms is essential for fine-tuning the segmentation process and optimizing results. While our implementation does not explicitly assign weights, we acknowledge the importance of this analysis and offer insights into our approach. Weights can be assigned based on expert knowledge, previous research findings, or assumptions about the relative importance of parameters. In our implementation, we did not perform empirical weight analysis due to constraints (i.e., complexities of image segmentation algorithms). However, we recognize the significance of this analysis in algorithm evaluation. Despite the absence of empirical data-driven weight assignment in our study, we emphasize the need for transparency and reproducibility in future research endeavors.

In this research paper, we highlighted the importance of transparent reporting and encourage future studies to explore empirical weight assignment methodologies for comprehensive algorithm evaluation and comparison. Additionally, we suggested avenues for further research, including conducting experiments to validate parameter weights and exploring alternative weighting methodologies. By incorporating these discussions into our research paper, we aim to provide a comprehensive understanding of the parameter definitions and weight analysis aspects of our image segmentation study, enhancing the clarity and relevance of our findings.

Results and Analysis

In this section we present a detailed examination of various image segmentation algorithms, namely Thresholding, K-Means Clustering, Mean Shift, Graph-Based Segmentation (Watershed), and U-Net (Deep Learning) employing a rigorous evaluation based on key metrics including Jaccard Index, Dice Coefficient, Pixel Accuracy, Hausdorff Distance, and Mean Intersection over Union. The results obtained through extensive experiments shed light on the comparative performance of these algorithms. The Jaccard Index and Dice Coefficient metrics offer insights into the algorithms' ability to accurately delineate object boundaries in segmented images. Pixel Accuracy provides a measure of the overall correctness in pixel classification. Hausdorff Distance quantifies the dissimilarity between segmented contours, and Mean Intersection over Union offers a holistic evaluation of segmentation quality.

Figure 8: Dice Coefficient Comparison Graph

The Dice Coefficient comparison graph (in Figure 8) provides a comprehensive evaluation of image segmentation algorithms, with the Dice Coefficient on the y-axis and specific algorithms on the x-axis. The Threshold Algorithm outperformed with a perfect Dice Coefficient of 1, highlighting flawless segmentation precision. In contrast, the K-Means Clustering Algorithm exhibited a lower Dice Coefficient of 0.325, indicating some challenges in achieving optimal segmentation. The Mean Shift Algorithm performed well with a Dice Coefficient of 0.61, showcasing a balance between accuracy and computational efficiency. The Graph-Based Segmentation (Watershed) achieved a Dice Coefficient of 0.58, indicating effective segmentation with room for improvement. The U-Net Algorithm, a deep learning-based approach, demonstrates a Dice Coefficient of 0.48, providing good but not optimal segmentation.

Figure 9: Hausdorff Distance Comparison Graph

Figure 10: Mean Intersection over Union Comparison Graph

The Haussdorf Distance comparison graph (in Figure 9) offers a comprehensive analysis of image segmentation algorithms, with the Haussdorf Distance represented on the y-axis and specific algorithms on the x-axis. The Threshold Algorithm outperformed with a Haussdorf Distance of 0, indicating perfect alignment with the ground truth and optimal segmentation precision. In contrast, the K-Means Clustering Algorithm exhibited a higher Haussdorf Distance of 91, suggesting some discrepancies and spatial deviations from the ground truth. The Mean Shift Algorithm performed well with a Haussdorf Distance of 64, highlighting a balanced trade-off between precision and spatial accuracy. The Graph-Based Segmentation (Watershed) and U-Net Algorithm demonstrate Haussdorf Distances of 68 and 69, respectively, indicating effective segmentation but with room for improvement in spatial alignment.

The comparative analysis of image segmentation algorithms using Mean Intersection over Union (IoU) as the evaluation metric revealed distinctive performance characteristics as shown in Figure 10. The Threshold Algorithm exceled with a perfect Mean IoU of 1, indicating precise overlap between predicted and ground truth masks. In contrast, the K-Means Clustering Algorithm and U-Net Algorithm exhibited a moderate Mean IoU of 0.35, suggesting challenges in accurately capturing complex image structures. The Mean Shift Algorithm demonstrated good agreement with a Mean IoU of 0.58, highlighting effective segmentation. Graph-based Segmentation (Watershed) falls in between, with a Mean IoU of 0.44, indicating reasonable performance.

Figure 11: Jaccard Index Comparison Graph

The comparative analysis of image segmentation algorithms using the Jaccard Index as the benchmark metric revealed distinct performance characteristics as demonstrated by Figure 11. The Threshold Algorithm performed well with a perfect Jaccard Index of 1, indicating precise overlap between predicted and ground truth masks. In contrast, the K-Means Clustering Algorithm and U-Net Algorithm exhibited a moderate Jaccard Index of 0.25 and 0.34, respectively, suggesting challenges in accurately delineating complex image structures. The Mean Shift Algorithm achieved a moderate Jaccard Index of 0.38, displaying a substantial but improvable overlap. Graph-based Segmentation (Watershed) demonstrated higher effectiveness with a Jaccard Index of 0.42.

Figure 12: Pixel Accuracy Comparison Graph

The comparative analysis of image segmentation algorithms based on Pixel Accuracy unveils notable distinctions in their performance. The Threshold Algorithm out performed with a perfect Pixel Accuracy of 1, indicating precise pixel-level classification and segmentation accuracy. In contrast, the K-Means Clustering Algorithm exhibited a lower Pixel Accuracy of 0.38, pointing to challenges in accurately classifying pixels and capturing intricate segmentation details. The Mean Shift Algorithm impressively achieved a high Pixel Accuracy of 0.68, highlighting its effectiveness in accurate pixel-level classification. Graph-based Segmentation (Watershed) and the U-Net Algorithm demonstrated moderate Pixel Accuracy values of 0.52 and 0.51, respectively, suggesting room for improvement in pixel-level segmentation.

Table 1: Comprehensive Table encompassing values of Thresholding, K-Means Clustering, Mean Shift, Graph-Based Segmentation (Watershed), and U-Net (Deep Learning) Algorithms

In assessing the consolidated performance metrics (shown in Table 1), the Threshold Algorithm consistently emerged as the most robust performer among the considered segmentation algorithms. It attained perfect scores in Jaccard Index, Dice Coefficient, Pixel Accuracy, Haudorff Distance, and Mean Intersection over Union, denoting an unparalleled level of accuracy, precision, and agreement with ground truth segmentation. While other algorithms exhibited varying degrees of efficacy, none consistently achieves the excellence demonstrated by the Threshold Algorithm across all metrics. The Jaccard Index, Dice Coefficient, Pixel Accuracy, Haudorff Distance, and Mean Intersection over Union scores of 1, 1, 1, 0, and 1, respectively, underscored its exceptional ability to precisely delineate segmentation boundaries, achieved perfect pixel-level accuracy, and maintained an elevated level of agreement with ground truth masks. Therefore, based on this comprehensive evaluation, the Threshold Algorithm stood out as the preferred choice for image segmentation, offering unmatched performance across a range of critical metrics.

Discussion

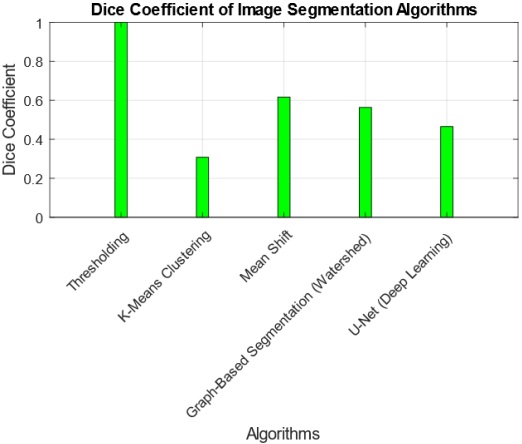
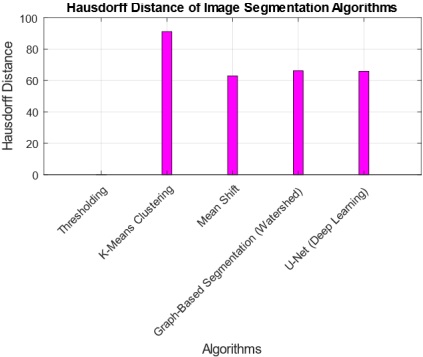
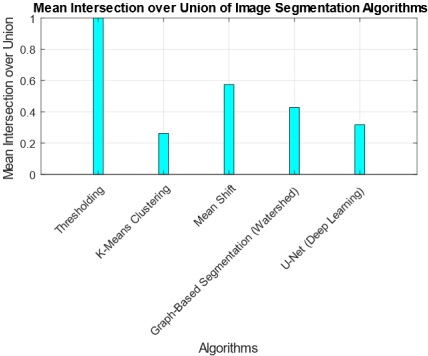
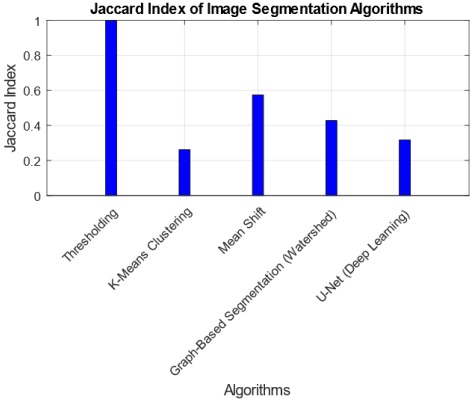
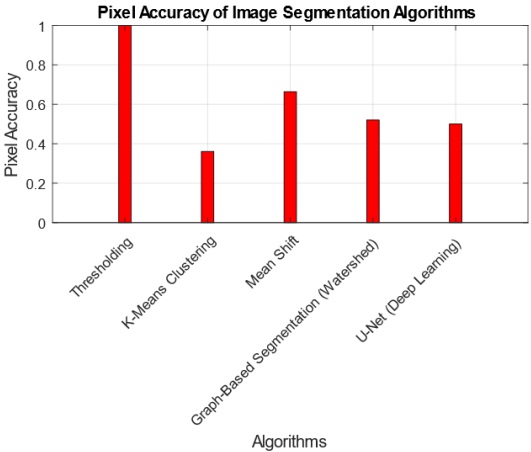
The interpretation of findings from the comparative analysis of five image segmentation algorithms provides valuable insights into their performance across multiple metrics. The Threshold Algorithm consistently outperforms its counterparts, achieving perfect scores in Jaccard Index, Dice Coefficient, Pixel Accuracy, Haudorff Distance, and Mean Intersection over Union. This suggests that the Threshold Algorithm excels in accurately delineating segmentation boundaries and achieving high pixel-level accuracy. Practical implications of these findings indicate that the Threshold Algorithm is a robust choice for applications demanding precise image segmentation, such as medical imaging or object detection. However, the research also highlights tradeoffs, as some algorithms, like K-Means and U-Net, exhibit lower scores in certain metrics, emphasizing the need for careful consideration of specific requirements in choosing an algorithm. The tradeoff between complexity and accuracy is evident, with more complex algorithms potentially introducing challenges in certain scenarios. Overall, these findings contribute to a nuanced understanding of algorithmic performance, guiding practitioners in selecting the most suitable segmentation approach based on their application-specific needs.

Conclusion

In conclusion, the comprehensive evaluation of five image segmentation algorithms based on Jaccard Index, Dice Coefficient, Pixel Accuracy, Hausdorff Distance, and Mean Intersection over Union metrics provides valuable insights into their respective performances. The Threshold Algorithm consistently emerged as the top-performer across all metrics, while achieving a minimal Hausdorff Distance of 0. This underscores its exceptional accuracy, precision, and agreement with ground truth segmentation. The findings suggest that the Threshold Algorithm is a robust choice for applications requiring precise segmentation, such as medical imaging or object detection. However, other algorithms exhibited varying degrees of efficacy, the research emphasizes the importance of considering specific application requirements and tradeoffs when selecting an algorithm. This study contributes to the understanding of image segmentation algorithm performance, guiding practitioners in making informed choices based on the desired balance between complexity and accuracy in diverse imaging applications.

Reference

[1] Z. Wang, E. Wang, and Y. Zhu, “Image segmentation evaluation: a survey of methods,” Artif. Intell. Rev., vol. 53, no. 8, pp. 5637–5674, Dec. 2020, doi: 10.1007/S10462-020-09830-9/METRICS.

[2] P. Jaglan, R. Dass, and M. Duhan, “A Comparative Analysis of Various Image Segmentation Techniques,” Lect. Notes Networks Syst., vol. 46, pp. 359–374, 2019, doi: 10.1007/978-981-13-1217-5_36/COVER.

[3] “A survey on segmentation techniques for image processing.” Accessed: Feb. 26, 2024. [Online]. Available: https://ijeee.edu.iq/Papers/Vol17-Issue2/1570736047.pdf

[4] S. Singh, N. Mittal, D. Thakur, H. Singh, D. Oliva, and A. Demin, “Nature and Biologically Inspired Image Segmentation Techniques,” Arch. Comput. Methods Eng. 2021 293, vol. 29, no. 3, pp. 1415–1442, Jun. 2021, doi: 10.1007/S11831-021-09619-1.

[5] S. Song and T. Gao, “Research on image segmentation algorithm based on threshold,” Proc. - 2021 13th Int. Conf. Meas. Technol. Mechatronics Autom. ICMTMA 2021, pp. 306–308, Jan. 2021, doi: 10.1109/ICMTMA52658.2021.00071.

[6] K. K. D. Ramesh, G. Kiran Kumar, K. Swapna, D. Datta, and S. Suman Rajest, “A Review of Medical Image Segmentation Algorithms,” EAI Endorsed Trans. Pervasive Heal. Technol., vol. “7,” no. 27, Apr. 2021, doi: 10.4108/EAI.12-4-2021.169184.

[7] S. Pare, A. Kumar, G. K. Singh, and V. Bajaj, “Image Segmentation Using Multilevel Thresholding: A Research Review,” Iran. J. Sci. Technol. - Trans. Electr. Eng., vol. 44, no. 1, pp. 1–29, Mar. 2020, doi: 10.1007/S40998-019-00251-1/METRICS.

[8] M. Abdel-Basset, V. Chang, and R. Mohamed, “A novel equilibrium optimization algorithm for multi-thresholding image segmentation problems,” Neural Comput. Appl., vol. 33, no. 17, pp. 10685–10718, Sep. 2021, doi: 10.1007/S00521-020-04820-Y/METRICS.

[9] C. Shi, Y. Zhou, B. Qiu, D. Guo, and M. Li, “CloudU-Net: A Deep Convolutional Neural Network Architecture for Daytime and Nighttime Cloud Images’ Segmentation,” IEEE Geosci. Remote Sens. Lett., vol. 18, no. 10, pp. 1688–1692, Oct. 2021, doi: 10.1109/LGRS.2020.3009227.

[10] H. S. Lee et al., “Efficient Defect Identification via Oxide Memristive Crossbar Array Based Morphological Image Processing,” Adv. Intell. Syst., vol. 3, no. 2, p. 2000202, Feb. 2021, doi: 10.1002/AISY.202000202.

[11] M. Ahmed, R. Seraj, and S. M. S. Islam, “The k-means Algorithm: A Comprehensive Survey and Performance Evaluation,” Electron. 2020, Vol. 9, Page 1295, vol. 9, no. 8, p. 1295, Aug. 2020, doi: 10.3390/ELECTRONICS9081295.

[12] K. Tian, J. Li, J. Zeng, A. Evans, and L. Zhang, “Segmentation of tomato leaf images based on adaptive clustering number of K-means algorithm,” Comput. Electron. Agric., vol. 165, p. 104962, Oct. 2019, doi: 10.1016/J.COMPAG.2019.104962.

[13] A. M. Ikotun, A. E. Ezugwu, L. Abualigah, B. Abuhaija, and J. Heming, “K-means clustering algorithms: A comprehensive review, variants analysis, and advances in the era of big data,” Inf. Sci. (Ny)., vol. 622, pp. 178–210, Apr. 2023, doi: 10.1016/J.INS.2022.11.139.

[14] T. G. Debelee, F. Schwenker, S. Rahimeto, and D. Yohannes, “Evaluation of modified adaptive k-means segmentation algorithm,” Comput. Vis. Media, vol. 5, no. 4, pp. 347–361, Dec. 2019, doi: 10.1007/S41095-019-0151-2/METRICS.

[15] M. S. Yang and K. P. Sinaga, “A feature-reduction multi-view k-means clustering algorithm,” IEEE Access, vol. 7, pp. 114472–114486, 2019, doi: 10.1109/ACCESS.2019.2934179.

[16] M. Zhao et al., “Faster Mean-shift: GPU-accelerated clustering for cosine embedding-based cell segmentation and tracking,” Med. Image Anal., vol. 71, p. 102048, Jul. 2021, doi: 10.1016/J.MEDIA.2021.102048.

[17] S. Yun and S. Kim, “Robust infrared target tracking using thermal information in mean-shift,” https://doi.org/10.1117/12.2519191, vol. 10995, pp. 52–57, May 2019, doi: 10.1117/12.2519191.

[18] J. W. Hsieh, C. H. Chou, M. C. Chang, P. Y. Chen, S. Santra, and C. S. Huang, “Mean-Shift Based Differentiable Architecture Search,” IEEE Trans. Artif. Intell., 2023, doi: 10.1109/TAI.2023.3329792.

[19] J. J. Hwang et al., “SegSort: Segmentation by discriminative sorting of segments,” Proc. IEEE Int. Conf. Comput. Vis., vol. 2019-October, pp. 7333–7343, Oct. 2019, doi: 10.1109/ICCV.2019.00743.

[20] Q. Huang, Y. Huang, Y. Luo, F. Yuan, and X. Li, “Segmentation of breast ultrasound image with semantic classification of superpixels,” Med. Image Anal., vol. 61, p. 101657, Apr. 2020, doi: 10.1016/J.MEDIA.2020.101657.

[21] X. Jia, T. Lei, P. Liu, D. Xue, H. Meng, and A. K. Nandi, “Fast and Automatic Image Segmentation Using Superpixel-Based Graph Clustering,” IEEE Access, 2020, doi: 10.1109/ACCESS.2020.3039742.

[22] A. Ibrahim, “Image Segmentation Methods Based on Superpixel Techniques: A Survey.” Jan. 01, 2020. Accessed: Feb. 26, 2024. [Online]. Available: https://www.academia.edu/70227250/Image_Segmentation_Methods_Based_on_Superpixel_Techniques_A_Survey

[23] Y. Mourchid, M. El Hassouni, and H. Cherifi, “A general framework for complex network-based image segmentation,” Multimed. Tools Appl., vol. 78, no. 14, pp. 20191–20216, Jul. 2019, doi: 10.1007/S11042-019-7304-2/METRICS.

[24] Y. Zhou, G. Gallego, X. Lu, S. Liu, and S. Shen, “Event-Based Motion Segmentation with Spatio-Temporal Graph Cuts,” IEEE Trans. Neural Networks Learn. Syst., vol. 34, no. 8, pp. 4868–4880, Aug. 2023, doi: 10.1109/TNNLS.2021.3124580.

[25] Y. Zhao et al., “Graph-based region and boundary aggregation for biomedical image segmentation,” IEEE Trans. Med. Imaging, vol. 41, no. 3, pp. 690–701, Mar. 2022, doi: 10.1109/TMI.2021.3123567.

[26] S. Momin, Y. Lei, and Z. Tian, “Medical Image Segmentation Based on U-Net,” J. Phys. Conf. Ser., vol. 2547, no. 1, p. 012010, Jul. 2023, doi: 10.1088/1742-6596/2547/1/012010.

[27] N. Siddique, S. Paheding, C. P. Elkin, and V. Devabhaktuni, “U-Net and Its Variants for Medical Image Segmentation: A Review of Theory and Applications,” IEEE Access, vol. 9, pp. 82031–82057, 2021, doi: 10.1109/ACCESS.2021.3086020.

[28] V. D. Nahian Siddique, Paheding Sidike, Colin Elkin, “U-Net and its variants for medical image segmentation: theory and applications”, [Online]. Available: https://arxiv.org/abs/2011.01118

[29] L. Yin et al., “U-Net-STN: A Novel End-to-End Lake Boundary Prediction Model,” L. 2023, Vol. 12, Page 1602, vol. 12, no. 8, p. 1602, Aug. 2023, doi: 10.3390/LAND12081602.

[30] R. Azad, M. Asadi-Aghbolaghi, M. Fathy, and S. Escalera, “Bi-directional ConvLSTM U-net with densley connected convolutions,” Proc. - 2019 Int. Conf. Comput. Vis. Work. ICCVW 2019, pp. 406–415, Oct. 2019, doi: 10.1109/ICCVW.2019.00052.

[31] “SIPI Image Database - Misc.” Accessed: Dec. 02, 2023. [Online]. Available: https://sipi.usc.edu/database/database.php?volume=misc

[32] T. Eelbode et al., “Optimization for Medical Image Segmentation: Theory and Practice When Evaluating With Dice Score or Jaccard Index,” IEEE Trans. Med. Imaging, vol. 39, no. 11, pp. 3679–3690, Nov. 2020, doi: 10.1109/TMI.2020.3002417.

[33] J. Bertels et al., “Optimizing the Dice Score and Jaccard Index for Medical Image Segmentation: Theory and Practice,” Lect. Notes Comput. Sci. (including Subser. Lect. Notes Artif. Intell. Lect. Notes Bioinformatics), vol. 11765 LNCS, pp. 92–100, 2019, doi: 10.1007/978-3-030-32245-8_11/COVER.

[34] N. A. Muhadi, A. F. Abdullah, S. K. Bejo, M. R. Mahadi, and A. Mijic, “Image Segmentation Methods for Flood Monitoring System,” Water 2020, Vol. 12, Page 1825, vol. 12, no. 6, p. 1825, Jun. 2020, doi: 10.3390/W12061825.

[35] R. R. Shamir, Y. Duchin, J. Kim, G. Sapiro, and N. Harel, “Continuous Dice Coefficient: a Method for Evaluating Probabilistic Segmentations,” bioRxiv, p. 306977, Apr. 2018, doi: 10.1101/306977.

[36] R. Zhao et al., “Rethinking dice loss for medical image segmentation,” Proc. - IEEE Int. Conf. Data Mining, ICDM, vol. 2020-November, pp. 851–860, Nov. 2020, doi: 10.1109/ICDM50108.2020.00094.

[37] B. Cheng, R. Girshick, P. Dollár, A. C. Berg, and A. Kirillov, “Boundary IoU: Improving object-centric image segmentation evaluation,” Proc. IEEE Comput. Soc. Conf. Comput. Vis. Pattern Recognit., pp. 15329–15337, 2021, doi: 10.1109/CVPR46437.2021.01508.

[38] É. O. Rodrigues, “An efficient and locality-oriented Hausdorff distance algorithm: Proposal and analysis of paradigms and implementations,” Pattern Recognit., vol. 117, p. 107989, Sep. 2021, doi: 10.1016/J.PATCOG.2021.107989.

[39] J. T. Jeng, C. M. Chen, S. C. Chang, and C. C. Chuang, “IPFCM Clustering Algorithm Under Euclidean and Hausdorff Distance Measure for Symbolic Interval Data,” Int. J. Fuzzy Syst., vol. 21, no. 7, pp. 2102–2119, Oct. 2019, doi: 10.1007/S40815-019-00707-W/METRICS.

[40] Y.-J. Cho, “Weighted Intersection over Union (wIoU): A New Evaluation Metric for Image Segmentation,” Jul. 2021, Accessed: Feb. 26, 2024. [Online]. Available: https://arxiv.org/abs/2107.09858v4

[41] H. Rezatofighi, N. Tsoi, J. Gwak, A. Sadeghian, I. Reid, and S. Savarese, “Generalized intersection over union: A metric and a loss for bounding box regression,” Proc. IEEE Comput. Soc. Conf. Comput. Vis. Pattern Recognit., vol. 2019-June, pp. 658–666, Jun. 2019, doi: 10.1109/CVPR.2019.00075.

Appendix: MATLAB Code for Image Segmentation:

Description:

The MATLAB code provided below implements various image segmentation algorithms and evaluates their performance using different metrics such as Jaccard Index, Dice Coefficient, Pixel Accuracy, Hausdorff Distance, and Mean Intersection over Union.

Code Repository Link:

https://www.kaggle.com/datasets/umerijazrandhawa/matlab-code-for-image-segmentation

Code Files:

Main_Script_Segmentation.m:Main script to perform image segmentation and generate evaluation metrics.

Run_Image_Segmentation_and_Metrics.m: Function to run image segmentation for multiple images and calculate evaluation metrics.

Get_Algorithm_Name.m: Function to map algorithm numbers to algorithm names.

Run_Segmentation_Algorithm.m: Function to run specific segmentation algorithms based on algorithm numbers.

Resize_Mask.m: Function to resize masks to a common size.

Algorithm-specific segmentation functions:

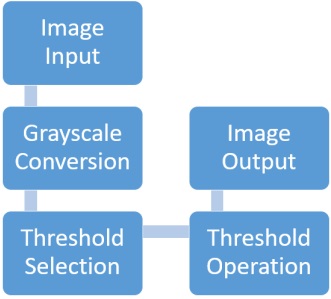
thresholding_segmentation.m

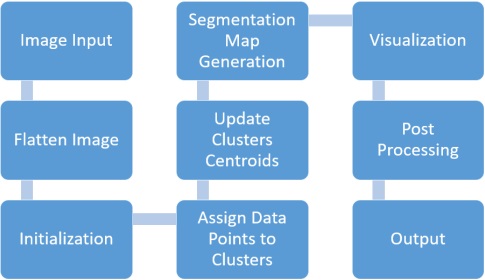
kmeans_clustering_segmentation.m

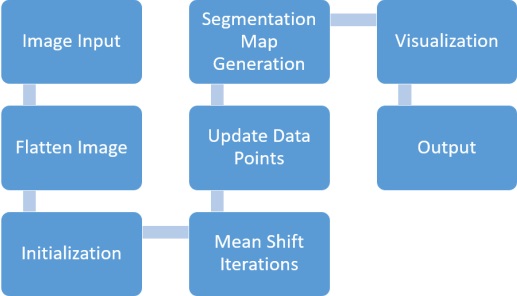
mean_shift_segmentation.m

watershed_segmentation.m

unet_segmentation.m

Evaluation metrics functions:

jaccard_index.m

dice_coefficient.m

pixel_accuracy.m

hausdorff_distance.m

intersection_over_union.m

hausdorff_distance_single.m

kmeans_grayscale.m

mean_shift_grayscale.m

Input Data:

Five sample images (Image1.tiff to Image5.tiff) and their corresponding ground truth masks (mask1.tif to mask5.tif) are used as input data for the image segmentation process.

Output:

The MATLAB code generates graphs illustrating the performance of different segmentation algorithms based on the evaluation metrics mentioned above.

Usage:

Clone or download the repository containing the MATLAB code.

Open MATLAB and navigate to the directory containing the downloaded files.

Run the main_script_segmentation.m script to execute the image segmentation process.