
Appraisal of Deforestation in District Mansehra through Sentinel-2 and Landsat Imagery.
Ghulam Nabi1, Imran Siddique Kaukab1, Syed Shah Zain Abbas2, Muhammad Saifullah1, Maira Malik1, Najma Nazeer1, Nida Farooq1 and Rabia Rasheed1.
1Remote Sensing and GIS group Department of Space Science University of the Punjab Lahore Pakistan.
2 Punjab University Collage of Information Technology (GIS Center)
* Correspondence: Ghulam Nabi E-mail : ghulamnabi.spsc@gmail.com
Citation | Nabi.G, Kaukab.I.S, Zain S.S.A.S, Saif.M, Malik.M, Nazeer.N, Farooq.N and Rasheed.R”. Appraisal of Deforestation in District Mansehra through Sentinel-2 and Landsat imagery. International Journal of Agriculture and Sustainable Development, Vol 01 Issue 01: pp 1-16, 2019.
DOI | https://doi.org/10.33411/IJASD/20190102
Received | Dec 16, 2018; Revised |Jan 26, 2019 Accepted | Jan 28, 2019; Published | Feb, 5 2019.
________________________________________________________________________
Abstract.
Forests are the main source of food/wood and are important for a healthy environment. Removal of trees from forested landcover is known as deforestation. The main objective of this study was to estimate temporal variations in forested landcover located in district Mansehra for the years from 2008 to 2018 with two comparative time periods 1) 2008 to 2013 and 2) 2013 to 2018. Results indicates about deforestation in the study area during 2008-2013 and afforestation in 2013-2018. Vegetative landcover was increased from 43.3% to 47.2%. Afforestation at tehsil level showed that the vegetative area in Balakot was increased from 26.6% to 29.8%. Similarly, vegetation index increased from 72.2% to 74.42% in Manshera and 82.7% to 83.5% in Oghi. Kappa coefficient performed well to access accuracy of classified imagery which was maximum for the classified map obtained using Sentinel-2 dataset, therefore, Sentinel-2 imagery was proved more reliable in comparison to Landsat imagery. The spectral responses of various land use classes were also mapped which are useful of other researches to recognize features through optical datasets. Results proved the sincere efforts of Khyber Pakhtunkhwa government in promotion of vegetated landcover. The coverage of KPK project must be enhanced for increasing vegetation for a green Pakistan.
Keywords: NDVI, Deforestation, Landcover, Afforestation, Optical Imagery.
Introduction.
Forests are considered the largest carbon sinks on the earth with storage of 80% of terrestrial carbon [1, 2]. About 89% of total forest biomass exist above the ground [3] which can be considered as carbon pool in forest biosphere. Forest degradation effects the complete ecosystem that must be prohibited to save carbon reserves to maintain ecological balance. Exact estimation of deforestation at spatial and temporal grounds enables a policy maker to construct a policy in a better way against timber mafia and other culprits. Therefore, monitoring and accurate estimates of above ground biomass are crucial for forest management [4, 5, 6]. The extraction of information about biomass estimates through field survey, is highly accurate but it is laborious, time consuming and cost effective while covering large spatial extents. Also, the revisit of forested landcover for such estimates is consider very much hectic [7, 8]. Remote sensing has played a pivotal role in monitoring, management and estimations of forests with high accuracy [7, 8, 9, 10, 11, 12].
The accuracy in biomass estimations can be enhanced by a collaborative study of remotely sensed [11, 12] imagery with real time field observations. A large variety of remote sensing datasets is available for estimation of forest related parameters including optical data (passive remote sensing), microwave data e.g., Radio Detection and Ranging (RADAR) and Light Detection and Ranging (LIDAR) data etc. [13, 14]. These datasets are reliable for covering large areas in one swipe having high spatial and temporal resolutions. Remote sensing datasets enable us to revisit an area after a duration of a few days, which is near to impossible by visiting the same physically with great accuracy [15]. Optical remote sensing has been proved successful by many researchers for mapping forested landcover, monitoring the forest health, pest and disease attacks. This accuracy is due to high spatial and temporal resolution of various satellite e.g., Quick bird is capable of capturing the investigation site at a spatial resolution up to 0.61 meters. High resolution satellites are capable to extract leaf level information with high accuracy. Optical data is available at very low cost, sometime free at various web links [16, 17].
Famous optical datasets used globally in forest related applications, are produced by the platforms of World View, Ikonos and Quick Bird. Some other optical datasets are also available that include Landsat, SPOT and Moderate Resolution Imaging Spectroradiometer (MODIS) covering wide areas at regional scales having spatial resolution in meters [18, 19]. However, such low-resolution datasets have limited use due to their poor penetration capacity through clouds. Cloud cover is considered as one of the major limitations in mapping temporal changes while using optical imagery due to “off and on” cloud activity over the study site [20]. Therefore, microwave data is preferred but it has multiple limitations including 1) data availability at 1.0 level, 2) complex geometric corrections and 3) unavailability of data managements tools with open source license. Microwave remote sensing is preferred where we have to extract spectral responses of a certain vegetation with a short life span e.g., rice, wheat and maize etc. However, deforestation can be estimated precisely through optical datasets using a defined time window. Also, the considerable deforestation take place in years, therefore, we need data with a temporal window of above one decade to accomplish the task precisely and the microwave remote sensing was not available before 2014. Therefore, researchers are strict to use the products of old satellites having coarse resolution and large swaths widths e.g., Landsat, SPOT and MODIS etc for temporal analysis.
This research aim at mapping the temporal changes in forest area of district Mansehra using Landsat and Sentinel-2 imagery. It also aims at defining ranges for the existing landcover, based on the both NDVI and their spectral responses.
1.0 Material and methods.
Investigation site.
This research was carried out in district Mansehra located in North West Frontier Province (NWFP) Pakistan. The spatial extent of the study site is 4579 km2 located at an elevation of 975m above the sea level [21]. It is situated between 34.18oN to 35.18 oN latitudes and 72.81oE to 74.13oE longitudes. This district is administered by Khyber Pakhtunkhwa government [16]. The spatial extent of the study site is mapped in Figure 1.

Figure 1. Spatial extent of the study site is shown in in-set.
Research design.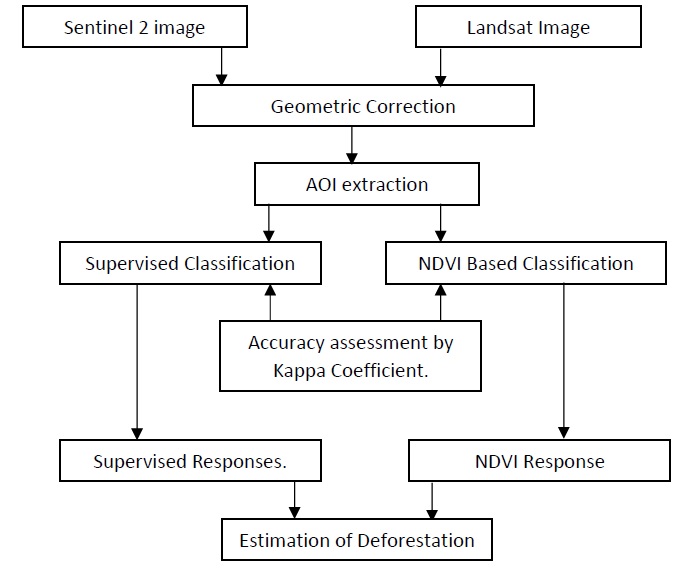
Figure 2. Flow of methodology used in this research.
Methodology.
Various traditional methods are available for data collection from the forest fields. Extraction of block level information is considered most commonly used due to its accuracy more than 90% but it is laborious, time consuming, cost effective and hectic method [22]. This methodology requires a large number of labors carrying instruments in forest fields which is sometime avoided in dense and deep forest, also, the extraction of information from such fields may lead to considerable errors. Therefore, we used remotely sensed datasets produced by platforms of Landsat (for old imagery) and Sentinel-2 (for recent imagery) to estimate deforestation in the investigation site. Dates of image extraction are mentioned in Table 1.
Table 1. Dates of satellite image acquisition.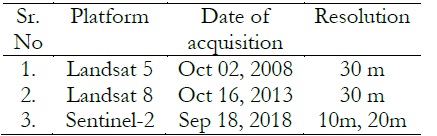
Various researchers have proved that the spectral responses captured by spectral bands in red and near infrared wavelength are very useful to estimate the health, growth and finally the production of forests [18, 19, 20, 21]. Moreover, these responses are used to compute vegetation indices including Normalized Difference Vegetation Index (NDVI) and Ratio Vegetation Index (RVI) etc. These indices are useful to discriminate the vegetative content existing in an area in comparison to other features. We used NDVI for detection of vegetation in the satellite image and defined ranges for all land use features existing in the study area. NDVI can be estimated using the expression as below,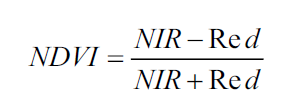
Where, NIR is near infrared.
Vegetation response is captured maximum in NIR and minimum in red wavelength.
Supervised classification.
We executed supervised classification in Erdas Imagine 14 on the stacked satellite image to check the reliability of NDVI based classification. A field survey was conducted using differential GPS to select trainee samples from some remote locations which were not easily detectable on the satellite image with naked eye. We used 64 trainee samples of various places to discriminate features. These trainee samples were selected by applying specific spectral signatures for each field and somewhere using visual interpretation keys.
Accuracy assessment through Kappa Coefficients.
For accuracy assessment of supervised classification, we executed ground validation by creating a relationship between supervised map and the real time google earth imagery. A well-defined index known as Kappa Coefficient was used to estimate accuracy index. In Kappa Coefficient, a relationship is established between classified map features to actual ground reality. In this process, the features are marked with pin point on the classified map to check either that feature is really existing on the ground or not. In this way multiple pin points are marked to find out the correct locations in comparison to misleading. It is also called the accuracy of expert, which can be determined by the formula as below [23].
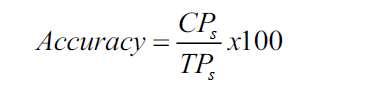
Where CPs and TPs are corrected and total points respectively. Kappa coefficient can be estimated using the expression as below [24]

For calculation of Kappa coefficient, all the input elements are in rows and columns e.g., the input figures for vegetative and non-vegetative area are as below in Table 2,
Table 2. A brief description of Kappa coefficient in rows and columns.
If the Kappa coefficient (K), K>0.80, the results of classified map are in strong agreement, if 0.40<K<0.80, it is moderate accuracy and the values of K<0.40 represents poor accuracy.
Spectral responses.
Spectral responses of various landuse classes are of great importance to obtained accuracy in satellite imagery. Pixel level information is not sufficient to draw spectral response properly therefore, we selected one thousand pixels randomly from each class i.e., vegetative and non-vegetative (soil and water) and mapped their spectral responses.
Results
NDVI based spatial distribution of features helped us to demarcate the vegetative area in comparison to non-vegetative features. The NDVI based maps were generated for the years 2008, 2013 and 2018 to estimate temporal changes in vegetation. Supervised classification of these images resulted in delineation of vegetation types in details e.g., broad leaf plants, sparse broad leaf forest, sparse and dense forest. Classified map of year 2008 is shown in the Figure 3.
Figure 3 represents that the total area of district Mansehra was 4579 km2 which included three tehsils Balakot, Mansehra and Oghi with area distribution of 45.27%, 32.04% and 12.69% respectively. It also describes that 54.84% area was vegetative in 2008 in comparison to non-vegetative area as 45.16%. Tehsil level distribution of vegetation proved Oghi as lush green with 82.72% of vegetation and Balakot as least green with 38.6%.
Figure 3. Classified map of district Mansehra obtained using Landsat satellite image of the year 2008.
For accuracy assessment, 25 sample point were obtained on the classified image of 2008 including 15 for vegetated and 10 for non-vegetated classes as mentioned in the Table 3. We found two classes marked wrong among total 25 classes for the both vegetated and non-vegetated classes and calculated the value of Kappa coefficient as K=0.83. This value of K represents a good accuracy as described in methodology section.
Table 3. Accuracy assessment in the classified map 2008.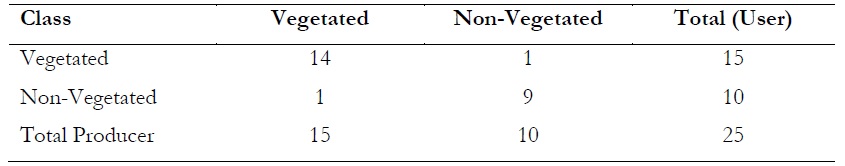
Figure 4 shows that the vegetative land cover reduced from 54.84% to 43.37% within a temporal window of five years and the non-vegetative landcover increased from 45.16% to 56.63% in same duration. Major transformations of vegetative area into human settlements were observed in Balakot where the reduction in vegetation was 28.67% to 26.60%. Both Mansehra and Oghi tehsils also bear a reduction in vegetative landcover by 4% in 2013 in comparison to 2008.
Figure 4. Classified map of District Mansehra obtained using Landsat-8 satellite image of the year 2013.
To determine the accuracy of classified map, we selected 25 points including 15 from vegetative area and 10 from non-vegetative area as described in the Table 4. One point was observed wrong while in cross validation of vegetative area and two points in case of non-vegetative area. In this case, Kappa coefficient was calculated as 74.58% providing middle accuracy.
Table 4. Accuracy assessment in the classified map of 2013.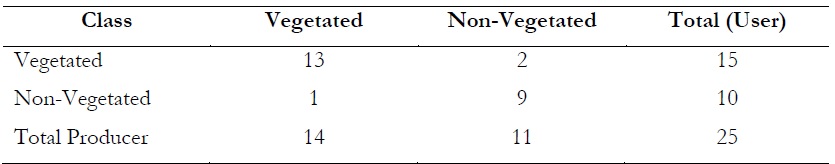
Figure 5 is showing a reverse trend regarding vegetation in the year 2018 as compared to 2013 and 2008. It is showing that vegetative landcover was increased from 43.3% to 47.2%. Tehsilwise distribution showed that the vegetative area in Balakot was increased from 26.6% to 29.8%. Similarly, vegetation index increased from 72.2% to 74.42% in Manshera and 82.7% to 83.5% in Oghi. This increase in vegetation is normally termed as afforestation, shown in Figure 5.

Figure 5: Classified map of district Mansehra obtained using Sentinel-2 image of the year 2018.
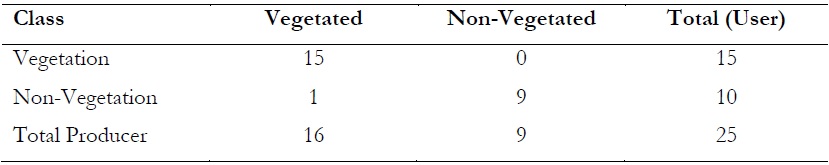
To determine the accuracy of classified map we applied Kappa coefficient to the classified imagery obtained using Sentinel-2. We marked 25 locations on the classified map to cross validate various locations of vegetated and non-vegetated classes including 15 in vegetated and 10 in non-vegetated classes as below in Table 5. We found only one point in disagreement. The Kappa coefficient was computed as 97% which describes a strong agreement.
Table 5. Accuracy assessment of classified imagery for the year 2018.
NDVI based classification of various landuse features is mentioned in the Table 6. These values were obtained by field visits during the cross validation. Table 6 shows that vegetation returned maximum NDVI of 0.7 in comparison to other features e.g., water and bare soil.
The spectral responses of broad leaf tress, water and soil is mapped in the Figure 6 as
below. These spectral profiles corroborate with literature [25, 26, 27].
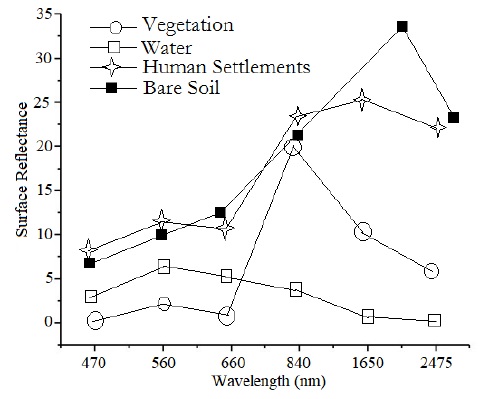
Figure 6. Spectral responses of various landuse classes.
Table 6. NDVI based spectral responses of various landuse features.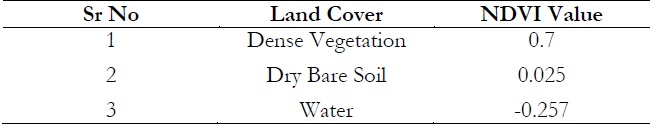
Discussion.
This study describes a detailed methodology to estimate deforestation in district Mansehra. Results indicates about deforestation in the study area during 2008-2013 and afforestation in 2013-2018 as described in the Figure 7a,7b.

Figure 7a. Percentage of forest and non-forest areas from 2008-2018.
Figure 7b: Analytical Map of Vegetation identification
Kappa coefficient performed well to access accuracy of classified imagery which was maximum for the classified map obtained using Sentinel-2 dataset, therefore, Sentinel-2 imagery was proved more reliable in comparison to Landsat imagery. The spectral responses of various land use classes were also mapped which are useful for other researches to recognize features through Remote Sensing [24]. Results proved the sincere efforts of Khyber Pakhtunkhwa government in promotion of vegetated landcover. The coverage of KPK project must be enhanced for increasing vegetation for a green Pakistan.
Conclusion.
Forest reserves are important to build not only the economy but also to maintain the ecological balance. Therefore, we should take care of our forested area through remote sensing technology which is easy to apply covering wide spans.
Acknowledgement.
First of all, I would like to thank to Almighty Allah, who provide me opportunity to research on the natural beauty of the Land and its diversities. After this I would like to express my deepest appreciation and want thank to my parents, family to provide me significant help in anyway.
I dedicate this research to my Mother (late), she always supports me in each and every working and her prayer are always with me.
Author’s Contribution. All the authors contributed equally.
Conflict of interest. We have no conflict of interest for publishing this manuscript in IJASD.
References
[1] J. Olson, J. Watts and L. Allison, "Carbon in Live Vegetation of Major World Ecosystems," in Oak Ridge National Laboratory, TN, USA,, 1983.
[2] K. Liu, J. Wang, W. Zeng and J. Song, "Comparison and evaluation of three methods for estimating forest above ground biomass using TM and GLAS data.," Remote Sens, vol. 9, p. 341, 2017. [Crossref]
[3] M. Cairns, S. Brown, E. Helmer and G. Baumgardner, "Root biomass allocation in the world’s upland forests," Oecologia, vol. 111, pp. 1-11, 1997. [Crossref]
[4] Y. Pan, R. Birdsey, J. Fang, R. Houghton, P. Kauppi, W. Kurz, O. Phillips, A. Shvidenko, S. Lewis, J. Canadell and e. al., "A large and persistent carbon sink in the world’s forests," Science, vol. 333, pp. 988- 993, 2011. [Crossref]
[5] S. Saatchi, N. Harris, S. Brown, M. Lefsky, E. Mitchard, W. Salas, B. Zutta, W. Buermann, S. Lewis, S. Hagen and e. al., "Benchmark map of forest carbon stocks in tropical regions across three continents.," Proc. Natl. Acad. Sci. USA, vol. 108, pp. 9899- 9904, 2011. [Crossref]
[6] R. Deo, M. Russell, G. Domke, H. Andersen, W. Cohen and Woodall.C.W., "Evaluating site-specific and generic spatial models of aboveground forest biomass based on Landsat time-series and LiDAR strip samples in the Eastern USA.," Remote Sens, vol. 9, p. 598, 2017. [Crossref]
[7] L. Ene, E. Naesset, T. Gobakken, T. Gregoire, G. Stahl and S. Holm, "A simulation approach for accuracy assessment of two-phase post-stratified estimation in large-area LiDAR biomass surveys," Remote Sens. Environ, vol. 133, pp. 210-224, 2013. [Crossref]
[8] C. Wu, H. Shen, A. Shen, J. Deng, M. Gan, J. Zhu, H. Xu and K. Wang, "Comparison of machine-learning methods for above-ground biomass estimation based on Landsat imagery," J. Appl. Remote Sens, vol. 10, 2016. [Crossref]
[9] S. Brown, P. Schroeder and R. Birdsey, " Aboveground biomass distribution of US eastern hardwood forests and the use of large trees as an indicator of forest development.," For. Ecol. Manag, vol. 96, pp. 37- 47, 1997. [Crossref]
[10] D. Deb, J. Singh, S. Deb, D. Datta, A. Ghosh and R. Chaurasia, "An alternative approach for estimating above ground biomass using Resourcesat-2 satellite data and artificial neural network in Bundelkhand region of India.," Environ. Monit. Assess, vol. 189, p. 576, 2017. [Crossref]
[11] R. McRoberts, E. Næsset and T. Gobakken, "Inference for lidar-assisted estimation of forest growing stock volume.," Remote Sens. Environ, vol. 128, pp. 268- 275, 2013. [Crossref]
[12] P. Zhao, D. Lu, G. Wang, L. Liu, D. Li, J. Zhu and S. Yu, "Forest aboveground biomass estimation in Zhejiang Province using the integration of Landsat TM and ALOS PALSAR data," Int. J. Appl. Earth Obs, vol. 53, pp. 1- 15, 2016. [Crossref]
[13] L. Kumar, P. Sinha, S. Taylor and A. Alqurashi, "Review of the use of remote sensing for biomass estimation to support renewable energy generation.," J. Appl. Remote Sens, vol. 9, 2015. [Crossref]
[14] Y. Lin and G. ,. West, "Reflecting conifer phenology using mobile terrestrial LiDAR: A case study of Pinus sylvestris growing under the Mediterranean climate in Perth," Australia. Ecol. Indic, vol. 70, pp. 1-9, 2016. [Crossref]
[15] S. M. S. K. A. e. a. .. Raza, "Delineation of Potential Sites for Rice Cultivation Through Multi-Criteria Evaluation (MCE) Using Remote Sensing and GIS," Int. J. Plant Prod, vol. 12, no. 1, pp. 1-12, 2018. [Crossref]
[16] J. Blackard, M. Finco, E. Helmer, G. Holden, M. Hoppus, D. Jacobs, A. Lister, G. Moisen, M. Nelson, R. Riemann and e. al., "Mapping us forest biomass using nationwide forest inventory data and moderate resolution information," Remote Sens.Environ, vol. 112, pp. 1658- 1677, 2008. [Crossref]
[17] L. Cao, J. Pan, R. Li, J. Li and Z. .. Li, "Integrating airborne LiDAR and optical data to estimate forest aboveground biomass in arid and semi-arid regions of China," Remote Sens, vol. 10, p. 532, 2018. [Crossref]
[18] P. Thenkabail, N. Stucky, B. Griscom, M. Ashton, J. Diels, B. van der Meer and E. Enclona, "Biomass estimations and carbon stock calculations in the oil palm plantations of African derived savannas using IKONOS data," Int. J. Remote Sens, vol. 25, pp. 5447- 5472, 2004.
[19] L. Kumar and O. Mutanga, "Remote sensing of above-ground biomass.," Remote Sens, vol. 9, p. 935, 2017. [Crossref]
[20] S. S. M. V. L. S. H. Raza, " Delineation of vulnerable zones for YSB attacks under variable temperatures using remote sensing and GIS.," Sarhad Journal of Agriculture, vol. 34, no. 3, pp. 589-598, 2018. [Crossref]
[21] District Profile of Mansehra, " Small & Medium Enterprises Development Authority Ministry of Industries & Production Government of Pakistan," SMEDA, NWFP, February, 2009.
[22] S. Raza and S. Mahmood, " Estimation of Net Rice Production through Improved CASA Model by Addition of Soil Suitability Constant (ħα)," Sustainability , vol. 10, no. 6, p. 1788, 2018. [Crossref]
[23] R. Smith, "Global Forest Tesurces Assessment 2000 main Report," food and Agriculture Organization:, Rome, 2001.
[24] FAO, "Organaization," 2012.
[25] e. a. Piazza GA, "Mapeamento de Remanescentes em Estágio Inicial de Sucessão na Floresta Subtropical Atlântica do Sul do Brasil.," Boletim de Ciências Geodésicas, vol. 22, no. 4, pp. 774-789, 2016. [Crossref]
[26] S. Y. K. T. Ponzoni FJ, Sensoriamento Remoto da Vegetação, 2 ed., São Paulo : Oficina de Textos,, 2012, p. 176.
[27] e. a. Sothe C, "Abordagens para Classificação do Estádio Sucessional da Vegetação do Parque Nacional de São Joaquim empregando Imagens Landsat-8 e RapidEye.," Boletimde Ciências Geodésicas,, vol. 23, no. 3, pp. 389-404, 2017. [Crossref]