
Estimation of Net Primary Production of Rice Crop using CASA model in Nankana Sahib.
Ayesha Behzad1, Usman Rafique1, Mushtaq Qamar1, Bilal Islam2, H Umer Hameed1, Mubasher Basheer1, Maria Firdos1 and Syed Amer Mahmood1.
1Remote Sensing and GIS group Department of Space Science University of the Punjab Lahore Pakistan.
2 Department of Physics, University of the Punjab Lahore, Pakistan.
* Correspondence: Ayesha Behzad E-mail : ayshabehzad1234@gmail.com
Citation | Behzad.A; Rafique.U; Qamar.M; Islam.B, H Umer Hameed,U.H; Basheer M, Firdos.M and Mahmood.S.A1”. Estimation of Net Primary Production of Rice Crop using CASA model in Nankana Sahib. International Journal of Agriculture and Sustainable Development, Vol 01 Issue 01: pp 30-46, 2019.
DOI | https://doi.org/10.33411/IJASD/2019010103
Received | Dec 30, 2018; Revised |Feb 10, 2019 Accepted | Feb 16, 2019; Published | Feb 18, 2019.
________________________________________________________________________
Abstract.
Estimation of Net Primary Production (NPP) is crucial for the supply of food/wood. Precise estimates of NPP are important for sustainable development. We used Light Use Efficiency (LUE) model to appraise various growth-related processes e.g., photosynthesis, respiration and transpiration, in the rice plant. The study site received 1213 actual sunshine hours in comparison to total possible sunshine hours which were 1595 during the complete Rice Growth Period (RGP). Water stress was estimated throughout the RGP which resulted in surplus of water in early growth stages (W=53) and deficiency in the final ripening stage with W=0.14. Careful results indicate that about 5128 kg/ha of wet biomass was generated during the complete RGP. We applied a harvest index of 0.50 to estimate the dry biomass that was 2564 kg/ha which is about (2.82 ton/ha). These estimates seem to be in exaggeration according to real time field estimates collected by Crop Reporting Service (CRS) department which were (1.83 ton/ha). To manage this exaggeration, we applied the Soil Suitability Constant (ħα) which resulted as 1.99 ton/ha in suitable zone, 1.21 ton/ha in less suitable, 1.76 ton/ha in moderately suitable and 0.73 ton/ha in not suitable zones. The average yield was estimated as 1.62 ton/ha. According to CRS department, the rice area in the study site was reported as 107000 ha and the net rice production was estimated as 1,73,340 tons in the study site. The LUE model is reliable to estimate NPP of rice crop which is useful for decision makers to determine the contribution of rice in Gross Domestic Product (GDP) at regional scales in term of surplus or shortfall.
Keywords: Net Primary Production; Rice Growth Period; Light Use Efficiency; Water stress and Photosynthesis.
Introduction.
About half of world’s population consume rice (Oryza Stiva) as a staple food [1]. Almost 90% of rice production is obtained from Asian countries [2]. The regional contribution in rice production is as follows; China (approx. 211.3 Million Tons (MT)), India (16.95 MT), Indonesia (74.5 MT) Bangladesh (53. MT) Vietnam (44.2 MT), Thailand (34.5 MT), Myanmar (30.4 MT) Philippines (19.7 MT), Brazil (11.4 MT), Japan (10.4 MT) and Pakistan (11.3 MT) [3]. About 488.6 MT was the global rice production in 2018, in which 439.7 MT rice was obtained from Asian Countries. The annual rice productions seem to be insufficient in comparison to demands of increasing population [4]. Speedy growth in population, especially in low income countries [5], and the regional climate change [6,7] have put high pressure on farmers to enhance per hector yield. Large variations in atmospheric composition are recorded over Asia [8] due to addition of a big amount of pollutants and toxic agent in our environment. These pollutants have trapped heat and caused abnormality in climatic events e.g.., we receive rainfall normally in ripening period of rice crop [9] which cause a decline to the final productivity [10]. Precise estimates of Net Primary Production (NPP) have become a challenge for agronomists and economists to assess the exact amount of rice available for export in case of surplus or to import in case of shortfall [5]. Various controlling factors influence the NPP that include soil type, soil pH, soil electric conductivity, climate, topography and the anthropogenic activities. Respiration [11]] and photosynthesis [12] are the key processes which are largely dependent on availability of sunlight. Various researchers have analyzed the impact of sunlight on food or wood generation in diverse ecosystems [10,13,14]. The detailed description of productivity is dependent upon these analyses.
The NPP estimates are crucial to differentiate between various biomasses. Carbon Sequestration and carbon emission can be understood well on sufficient knowledge of NPP [15,16]. Carbon dioxide is stored in plant’s body that support the growth of short-lived and long-lived tissues. The amount of CO2 removal from atmosphere can be examined by estimation of NPP [17]. The ecological disturbances can be examined by evaluation of variations in NPP estimates at global scales, [18,19,20]. Many researches indicate a variety of factors effecting the NPP [20,21], such as temperature, humidity, pressure and the rainfall [22,23]. It is difficult to estimate NPP at regional scales due to diversity in climatic events therefore, the estimated results are calibrated with actual ground validated observations to map temporal changes in agroindustry [24].
Miami model was initially recognized for NPP estimates which was based on statistical techniques. In Miami model, a correlation is developed between the productions with temperature and precipitation levels. [5]. The drawback of this model was the ignorance of other climatic factors which are essential for crop production [25]. The remote sensing datasets have contributed effectively for estimation of NPP at both regional and global scales. A large variety of models, based on remote Sensing, is available now for estimation of NPP in diverse ecosystems [26,27,28,29]. Carranieg Ames Stanford Approach (CASA) model is one of these models which is based on Light Use Efficiency (LUE). CASA model incorporates most of climatic factors that play a vital role in growth and development of rice crop. CASA model has been implemented by many researchers to evaluate the NPP in Australia, North America, South America, Eurasia and Africa [26,18,30,31]. CASA model was implemented in China that presented a clear picture of enhanced Agri-industry of China and its’s impacts on climate change globally [18,32,33]. There were many limitations recorded in CASA model e.g., the value of LUE in fixed as 0.389gc/M for all type of vegetative species that resulted in variation in actual and estimated NPP results [34].
Another limitation in CASA model, was the ignorance of soil nutrients [28] e.g. Raza S.M.H.2018 introduced a soil suitability constant (ħα) in CASA model for precise estimates of NPP. Various researchers have observed exaggerations in NPP estimates due to ignoring the diversity of soil nutrients [35,36,37,38,39,40]. There are basic three type of NPP models process model, LUE model and the climatic model.
The climatic model creates a correlation between NPP and climatology of the region. This model ignores the type of vegetation therefore, large variations are observed while evaluating the actual estimates.
The process model is a complex model which is based on phenology of rice crop that consider the photosynthesis, respiration and dry matter partition [36]. The variable environmental conditions halt in evaluation of Photosynthesis and respiration during the complete growth period of a particular crop that leads to over/under estimates of NPP.
The LUE model is widely used model due to its simple flow from data collection to the final estimates. The LUE model is preferred due to its flexibility and its joint venture with remotely sensed data. This model describes that a portion of solar energy is used in respiration process and the remaining is fixed as net productions [41]. The solar energy is transported to plant organs and finally emitted into the environment by various channels [28]. A dynamic behavior of ecosystem can be determined by creating a balance between incoming and outgoing solar radiations [42]. The physiologic and climatic aspects of vegetation are incorporated by this model therefore, this model is considered more accurate for NPP estimates.
The main objectives of this research were to estimate the NPP of rice crop by incorporation of ecological parameters. It also aims at describing the water stress, light used, photosynthesis, respiration and transpiration of individual day during the complete rice growth period.
Study site.
This research was conducted in District Nankana Sahib located in Punjab province in Pakistan. The spatial extent of the study site is mapped in Figure 1. It is a plane area, where slop factor does not affect the water distribution process. The study site is covered by monsoon therefore, it receives surplus of rainfall during the monsoon season which some time exceeds up to 500mm. Water provision to crop are executed through paved network of water channels administered by Punjab Irrigation Department, (PID). The study site bears large variations in temperature that remains between 1oC in winter to 45 oC in summer season.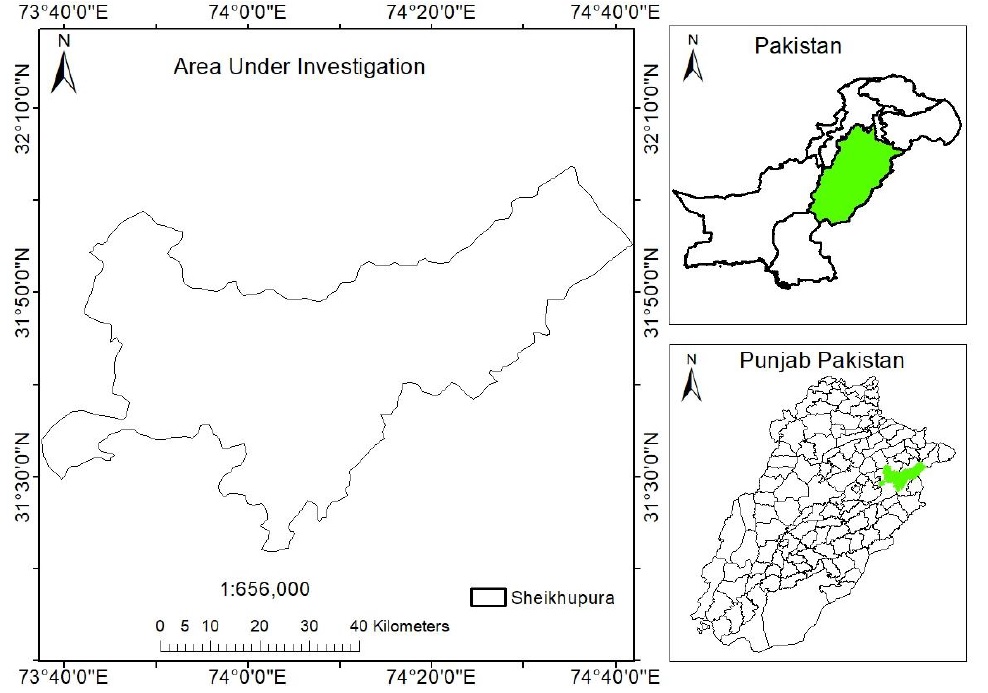
Figure 1. Study site.
Material and Methods.
We used LUE model to evaluate the NPP in the study site. This model is commonly used to map the productivity at regional scales [43,44,45,46] by fixation of solar energy. LUE model is important to diagnose the crop health conditions spatially. The plant characteristics are indispensable [47] which show heterogeneity a various scale due to physiological characteristics of plants. There are many factors influencing the light used by plants including chlorophyll content, the plant growth stage, the intensity of light and the rate of respiration/ photosynthesis. At canopy level, the light used is affected by solar Zenith angle, canopy structure, leaf area index and the inclination of leaf, [37,48].
The CASA model intakes the Normalized Difference Vegetation Index (NDVI) to the fraction of light absorption by plants [28]. NDVI directly relates to estimate the fraction of light absorption by plants [49].
The visible portion of solar energy having a wavelength range between (0.4- 0.7) μm is available for crop canopy during sunshine hours [50,51]. The NPP are calculated as a product of Absorbed Photosynthetic Active Radiation (APAR) with LUE [28,41,52,53,54] as follows in equation (1),
NPP= APAR * LUE (Kg/ha) (1)
Where APAR is the actual fraction of radiation absorbed by crop canopy for photosynthesis. The APAR can be estimated using the expression as below [55,38,56]
APAR= f X PAR (w/m2) (2)
The fraction ‘f’ in equation (2) represents the fraction of absorbed radiations by crop canopy in comparison to available radiations that can be estimated using the expression as below [26] in Equation 3.
f = -0.161+1.257 (NDVI) (3)
The physiological characteristics of plants are important to estimate the amount of light used [57] by a crop canopy. The amount of water content available for various growth processes, is important to consider to estimate. The light use efficiency can be estimated using the expression below
LUE=έ T1 T2 W
Where έ represents the maximum conversion factor to estimate biomass in optimum climatic conditions and a fixed value of 1.8 g C. MJ-1 is considered for rice crop [39]. T1 and T2 represents the heat factors which have considerable impact at global scales and can be ignored at local level estimations [28,47,39]. W is the water stress which describes the availability of water content throughout the rice cultivation period. Raza. S.M.H 2018 estimated the averaged amount of water content for district Nankana Sahib as 0.5838. A value greater than 0.5 is considered surplus of water that remained available throughout the rice cultivation period. A value w=0 represents an oven dry soil [26].
Result and Discussions
The availability of water content in the soil, indicates the water intakes by the rice crop. It is actually a transition between wet and dry crop season. The dry season depends upon the ratio of actual sun shine hours in comparison to total possible sun shine hours. This ratio remains between 0 and 1, where a value near to zero, indicates full cloudy day and 1 represent a day with sunshine. In a full sunny day, a rice plant consumes more amount of water in various processes e.g., 1) The rice plant sucks more amount of water to maintain its body temperature as compare to its surroundings in a sunny day and 2) all the processes that occur in the rice plant body e.g., photosynthesis, respiration and transpiration, execute full fledge actions in a sunny day that require more amount of water. Therefore, a cloud free day is considered with water stress. We require the information of total number of sunshine hours in comparison to total possible sunshine hours to estimate water stress that we collected from Punjab Metrologic department and mapped the results in Figure 2 as below,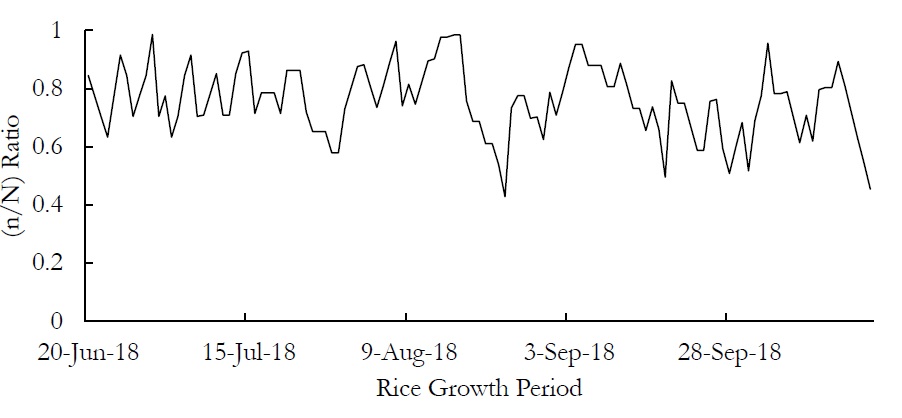
Figure 2. (n/N) ratio throughout the rice growth period
This figure show that we had a total possible sunshine hour of 1595 but we could receive only 1213 hours due to cloud activity in the study site throughout the rice cultivation period.
The water stress is estimated throughout the rice growth season and mapped the results in the Figure 3.
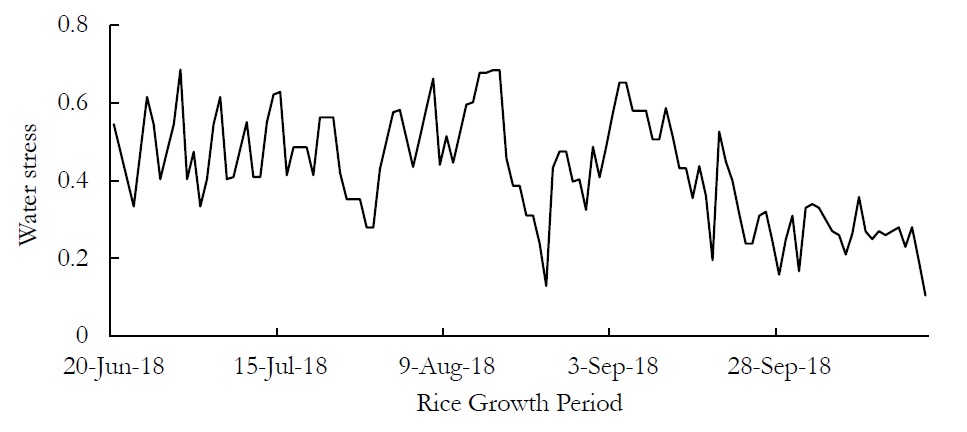
Figure 3. Water stress estimated throughout the RGP.
Figure 3 is partitioned between 0 and 1 on y-axis, where zero indicates oven dry soil and any value greater than 0.5 represents the surplus of water available for rice crop. Figure 3. indicates that W fluctuated between 0.53 and 0.14 in the study site. A value of 0.53 was obtained before ripening stage of rice crop which represents the availability of sufficient amount of water from Rice Growth Period germination to milky dough stage of the rice crop and the deficiency of water in the final ripening stage. Our results corroborate with the literature Raza. S.M.H. 2018 [5].
The light use efficiency determines the generation of glucose as a result of photosynthesis process. Daily variations in light used by rice crop canopy are mapped in Figure 4. By incorporation of W mapped in figure 3 as input parameter. T1 and T2 were ignored while estimating the LUE because both of the heat factors can be ignored at the local scale, however the value of έ was substituted as έ=1.8 g C.MJ-1 and mapped the results in Figure 4.
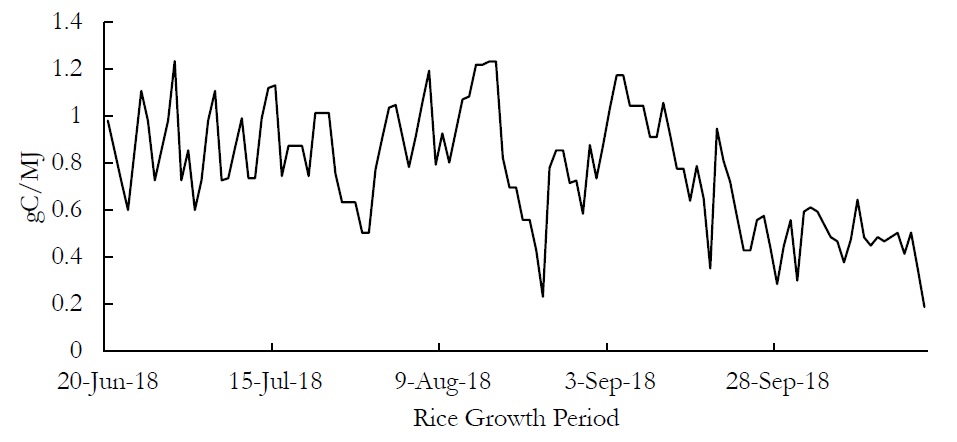
Figure 4. Light used by Rice Crop throughout the RGP
Figure 4 is showing that the rice crop canopy consumed most of light in the early phase of growth and development that declined in the ripening stage. This decline determines that less amount of light is required in the ripening stage. Careful estimates represent that the rice crop used 94.4 gC/MJ throughout the RGP.
Estimation of Biomass
It is important to estimate ‘APAR’, ‘PAR’ and ‘f’ for computation of biomass in Kg/ha. We obtained daily variations in NDVI to compute the value of ‘f’ throughout the rice cultivation period. ‘f’ actually represents the fraction of absorbed photosynthetic active radiations in comparison to total available photosynthetic active radiations. The value of ‘f’ varies between ‘0’ and ‘1’. Where ‘0’ represents that APAR is nil and no radiations were absorbed by the rice canopy for photosynthesis, while a value of ‘f’ =1 represents that all the photosynthesis active radiations were absorbed by rice crop canopy for growth and development. Daily variations in ‘f’ are mapped in the Figure 5.
Figure 5. Ratio of APAR in comparison to PAR throughout the RGP.
Figure 5 is showing that the growth of rice crop is directly associated with the NDVI regardless of weather conditions. As NDVI remained maximum before 30th of September, the APAR was recorded maximum, ‘f’ suddenly declined as NDVI dropped after 30th of September as shown in Figure 5.
We computed the variations in PAR and ‘f’ to estimate the variations in APAR and mapped the results in Figure 6 as below,
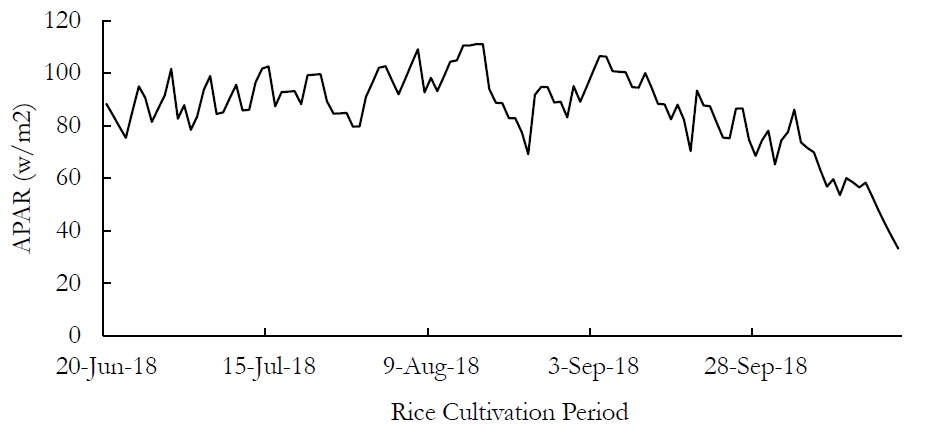
Figure 6. Radiations absorbed by rice crop canopy for photosynthesis.
Figure 6 is showing that maximum glucose production was recorded up to milky dough stage of rice crop that occurred before September 20 in the study site.
Photosynthesis is dependent upon the availability of sunlight therefore; the Figure 6 corroborates with Figure 2. The availability of light, leads to speedy plant growth processes e.g., photosynthesis, respiration and transpiration etc which are important to consider for estimation of net primary productions.
Daily variations in APAR and the LUE were incorporated to estimate the biomass generation throughout the rice growth period and plotted the results in Figure 7.
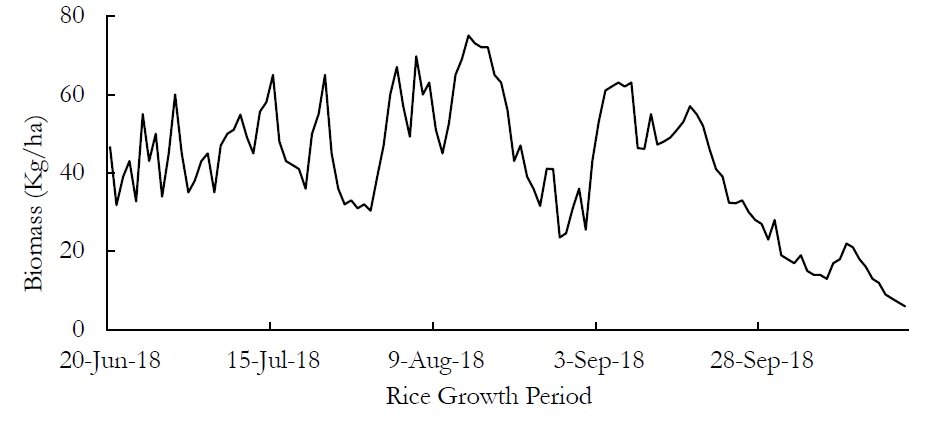
Figure 7. Biomass generation throughout the RGP.
Figure 2 and Figure 7 are in resemblance which shows that more biomass was generated on the day where (n/N) was recorded near to ‘1’ i.e., in a sunny day. The dips and peaks in Figure 7 are showing the variations in biomass generation throughout the cultivation period. Figure 7 shows that maximum biomass was generated before ripening stage of the rice crop and minimum in the ripening stage because ripening stage is the development stage where final product gets mature and the soft/milky dough is hardened.
Careful results indicate that about 5128 kg/ha of wet biomass was generated. We applied a harvest index of 0.50 according to Chen et al 2014 [58] to estimate the dry biomass that was 2564 kg/ha which is about (2.82 ton/ha). These estimates seem to be in exaggeration according to real time field estimates collected by Crop Reporting Service (CRS) department which were (1.93 ton/ha), mentioned at website http://www.crs.agripunjab.gov.pk/
To manage this exaggeration, we applied the Soil Suitability Constant (ħα) developed by Raza. S.M.H.2018 [5]. This constant is useful for calibration of estimated values to the real estimates. To, apply this constant we required the soil suitability map of the study site that was prepared by Raza S.M.H.2018 [59] as shown in Figure 8.
Figure 8. Land suitability map of Nankana sahib.
Figure 8 is showing that a total 108840 hectors area was under observation in which 107000 ha were under rice cultivation. The land suitability distribution of the study site determines that 48150 ha was suitable; 6420 ha was less suitable; 43870 ha was moderately suitable and 8560 ha was not suitable for rice cultivation. The application of (ħα) on these suitability zones resulted as 1.99 ton/ha in suitable zone, 1.21 ton/ha in less suitable, 1.76 ton/ha in moderately suitable and 0.73 ton/ha in not suitable zones. The average yield was estimated as 1.62 ton/ha and the net rice production was estimated as 1,73,340 tons in the study site, which correspond to the estimates of CRS department.
Conclusion
CASA model is based on light use efficiency which is handy to apply in rice fields to estimate net primary productions. CASA model incorporates all the ecological parameters essential for growth and development of rice crop. Therefore, it is recommended that government should establish the centers for awareness of local farmers to apply CASA model to estimate the net rice production.
Reference
1. Mosleh, M.K.; Hassan, Q.K.; Chowdhury, E.H. Development of Remote Sensing Based Rice Yield Forecasting Model. Span. J. Agric. Res. 2016, 14, 3. .[CrossRef]
2. Yang, C.M.; Liu, C.C.; Wang, Y.W. Using FORMOSAT-2 satellite data to estimate leaf area index of rice crop. J. Photogram. Remote Sens. 2008, 13, 253–260.
3. The Statistics Portal. Paddy Rice Production Worldwide in 2017, by Country (in Million Metric Tons). Available online: https://www.statista.com/statistics/255937/leading-rice-producers-worldwide/ (accessed on 5 December 2018).
4. Gillani.S. A, Rehman.S, Ahmad.H.H, Rehman.A, Ali.S, Ahmad.A, Junaid.U, and Ateeq.Z Appraisal of Urban Heat Island over Gujranwala and its Environmental Impact Assessment using Satellite Imagery (1995-2016). International Journal of Innovations in Science and Technology, Vol 01 Issue 01: pp 1-14, 2019. [CrossRef]
5. Raza, S.M.H.; Mahmood, S.A. Estimation of Net Rice Production through Improved CASA Model by Addition of Soil Suitability Constant (ħα). Sustainability 2018, 10, 1788. [CrossRef]
6. Xiao, X.; Boles, S.; Liu, J.; Zhuang, D.; Frolking, S.; Li, C.; Salas, W.; Moore, B., III. Mapping paddy rice agriculture in southern China using multi-temporal MODIS images. Remote Sens. Environ. 2005, 95, 480–492. [CrossRef]
7. Reynolds, C.A.; Yitayew, M.; Slack, D.C.; Hutchinson, C.F.; Huete, A.; Petersen, M.S. Estimation crop yields and production by integrating the FAO crop specific water balance model with real-time satellite data and ground-based ancillary data. Int. J. Remote Sens. 2000, 21, 3487–3508. [CrossRef]
8. Hassan.S.S, Mukhtar.M, Haq.U.H, Aamir.A, Rafique.M.H, Kamran.A, Shah.G, Ali.S and Mahmood.S.A “Additions of Tropospheric Ozone (O3) in Regional Climates (A case study: Saudi Arabia)”. International Journal of Innovations in Science and Technology, Vol 01 Issue 01: pp 33-46, 2019. [CrossRef]
9. Saifullah M, Islam.B, Rehman.S, Shoaib M, Haq.E, Gillani.S.A, Farooq.N, Zafar.M”. Estimation of Water Stress on Rice Crop Using Ecological Parameters. International Journal of Agriculture and Sustainable Development, Vol 01 Issue 01: pp 17-29, 2019. [CrossRef]
10. Zhu, Q.; Zhao, J.; Zhu, Z.; Zhang, H.; Zhang, Z.; Guo, X.; Bi, Y.; Sun, L. Remotely Sensed Estimation of Net Primary Productivity (NPP) and Its Spatial and Temporal Variations in the Greater Khingan Mountain Region, China. Sustainability 2017, 9, 1213. [CrossRef]
International Journal of Agriculture and Sustainable Development
February 2019 | Vol 1|Issue 1 Page | 12
11. Liu, G.S.; Liu, Y.; Xu, D. Comparison of evapotranspiration temporal scaling methods based on lysimeter measurements. J. Remote Sens. 2011, 15, 270–280.
12. Lima, E.D.P.; Sediyama, G.C.; Silva, B.B.D.; Gleriani, J.M.; Soares, V.P. Seasonality of net radiation in two sub-basins of Paracatu by the use of MODIS sensor products. Eng. Agric. 2012, 32, 1184–1196. [CrossRef]
13. Pachavo, G.; Murwira, A. Remote sensing net primary productivity (NPP) estimation with the aid of GIS modelled shortwave radiation (SWR) in a Southern African Savanna. Int. J. Appl. Earth Obs. Geoinform. 2014, 30, 217–226. [CrossRef]
14. Scurlock, J.M.; Johnson, K.; Olson, R.J. Estimating net primary productivity from grassland biomass dynamics measurements. Glob. Chang. Biol. 2002, 8, 736–753. .[CrossRef]
15. Maselli, F.; Argenti, G.; Chiesi, M.; Angeli, L.; Papale, D. Simulation of grassland productivity by the combination of ground and satellite data. Agric. Ecosyst. Environ. 2013, 165, 163–172. [CrossRef]
16. Wang, P.J.; Xie, D.H.; Zhou, Y.Y.; E, Y.H.; Zhu, Q.J. Estimation of net primary productivity using a process-based model in Gansu Province, Northwest China. Environ. Earth Sci. 2014, 71, 647–658. [CrossRef]
17. Canadell, J.G.; Mooney, H.A.; Baldochi, D.D.; Berry, J.A.; Ehleringer, J.R.; Field, C.B.; Gower, S.T.; Hollinger, D.Y.; Hunt, J.E.; Jackson, R.B.; et al. Carbon metabolism of the terrestrial biosphere: A multi-technique approach for improved understanding. Ecosystems 2000, 3, 115–130. [CrossRef]
18. Piao, S.L.; Fang, J.Y.; He, J. Variations in vegetation net primary production in the Qinghai—Xizang plateau, China, from 1982 to 1999. Clim. Chang. 2006, 74, 253–267. [CrossRef]
19. Eisfelder, C.; Klein, I.; Niklaus, M.; Kuenzer, C. Net primary productivity in Kazakhstan, its spatio-temporal patterns and relation to meteorological variables. J. Arid Environ. 2014, 103, 17–30. [CrossRef]
20. Cramer, W.; Kicklighter, D.W.; Bondeau, A.; Moore, B., III; Churkina, G.; Nemry, B.; Ruimy, A.; Schloss, A.L. Comparing global models of terrestrial net primary productivity (NPP): Overview and key results. Glob. Chang. Biol. 1999, 5(Suppl. 1), 1–15. [CrossRef]
21. Lehuger, S.; Gabrielle, B.; Cellier, P.; Loubet, B.; Roche, R.; Béziat, P.; Ceschia, E.; Wattenbach, M. Predicting the net carbon exchanges of crop rotations in Europe with an agro-ecosystem model. Agric. Ecosyst. Environ. 2010, 139, 384–395. [CrossRef]
22. Lauenroth, W.K.; Wade, A.A.; Williamson, M.A.; Ross, B.E.; Kumar, S.; Cariveau, D.P. Uncertainty in calculations of net primary production for grasslands. Ecosystems 2006, 9, 843–851. [CrossRef]
23. Lin, H.L.; Feng, Q.S.; Liang, T.G.; Ren, J.Z. Modelling global-scale potential grassland changes in spatio-temporal patterns to global climate change. Int. J. Sustain. Dev. World Ecol. 2013, 20, 83–96. [CrossRef]
International Journal of Agriculture and Sustainable Development
February 2019 | Vol 1|Issue 1 Page | 13
24. Lin, H.L. A New Model of Grassland Net Primary Productivity (NPP) Based on the Integrated Orderly Classification System of Grassland. In Proceedings of the Sixth International Conference on Fuzzy Systems and Knowledge Discovery, Tianjin, China, 14–16 August 2009; pp. 52–56. [CrossRef]
25. Lieth, H. Modeling the primary productivity of the world. Nat. Resour. 1972, 8, 5–10.
26. Field, C.B.; Randerson, J.T.; Malmström, C.M. Global Net Primary production: Combining ecology and Remote sensing. Remote Sens. Environ. 1995, 51, 74–88. [CrossRef]
27. Potter, C. Microclimate influences on vegetation water availability and net primary production in coastal ecosystems of Central California. Landsc. Ecol.2014, 29, 677–687. [CrossRef]
28. Potter, C.S.; Randerson, J.T.; Field, C.B.; Matson, P.A.; Vitousek, P.M.; Mooney, H.A.; Klooster, S.A. Terrestrial ecosystem production: A process model based on global satellite and surface data. Glob. Biogeochem. Cycles1993, 7, 811–841. [CrossRef]
29. Liang, W.; Yang, Y.T.; Fan, D.M.; Guan, H.D.; Zhang, T.; Long, D.; Zhou, Y.; Bai, D. Analysis of spatial and temporal patterns of net primary production and their climate controls in China from 1982 to 2010. Agric. For. Meteorol. 2015, 204, 22–36. [CrossRef]
30. Hicke, J.A.; Asner, G.P.; Randerson, J.T.; Tucker, C.; Los, S.; Birdsey, R.; Jenkins, J.C.; Field, C.; Holland, E. Satellitederived increases in net primary productivity across North America, 1982–1998. Geophys. Res. Lett. 2002, 29, 69-1–69-4. [CrossRef]
31. Tang, C.J.; Fu, X.Y.; Jiang, D.; Fu, J.Y.; Zhang, X.Y.; Zhou, S. Simulating spatiotemporal dynamics of Sichuan grassland net primary productivity using the CASA model and in situ observations. Sci. World J. 2014, 10, 1–12. [CrossRef]
32. Piao, S.L.; Fang, J.Y.; Zhou, L.M.; Zhu, B.; Tan, K.; Tao, S. Changes in vegetation net primary productivity from 1982 to 1999 in China. Glob. Biogeochem. Cycles 2005, 19, GB2027. [CrossRef]
33. Liu, S.N.; Zhou, T.; Wei, L.Y.; Shu, Y. The spatial distribution of forest carbon sinks and sources in China. Chin. Sci. Bull. 2012, 57, 1699–1707. [CrossRef]
34. Yu, D.Y.; Zhu, W.Q.; Pan, Y.H. The role of atmospheric circulation system playing in coupling relationship between spring NPP and precipitation in East Asia area. Environ. Monit. Assess. 2008, 145, 135–143. [CrossRef]
35. Rui, S.; Zhu, Q. Estimation of net primary productivity in China using remote sensing data. J. Geograph. Sci. 2001, 11, 14–23.
36. Piao, S.L.; Fang, J.Y.; Guo, Q.H. Application of CASA model to the estimation of Chinese terrestrial net primary productivity. Chin. J. Plant Ecol. 2001, 25, 603–608.
37. Ahl, D.E.; Gower, S.T.; Mackay, D.S.; Burrows, S.N.; Norman, J.M.; Diak, G.R. Heterogeneity of light use efficiency in a northern Wisconsin forest: Implications for modeling net primary production with remote sensing. Remote Sens. Environ. 2004, 93, 168–178. [CrossRef]
38. Runyon, J.; Waring, R.H.; Goward, S.N.; Welles, J.M. Environmental limits on net primary production and light-use efficiency across the Oregon transect. Ecol. Appl. 1994, 4, 226–237. [CrossRef]
39. Bastiaanssen, W.G.; Ali, S. A new crop yield forecasting model based on satellite measurements applied across the Indus Basin, Pakistan. Agric. Ecosyst. Environ. 2003, 94, 321–340. [CrossRef]
40. Bastiaanssen, W.G.M.; Pelgrum, H.; Droogers, P.; de Bruin, H.A.R.; Menenti, M. Area-average estimates of evaporation, wetness indicators and top soil moisture during two golden days in EFEDA. Agric. For. Metrol. 1997, 87, 119–137. [CrossRef]
41. Li, A.; Bian, J.; Lei, G.; Huang, C. Estimating the Maximal Light Use Efficiency for Different Vegetation through the CASA Model Combined with Time-Series Remote Sensing Data and Ground Measurements. Remote Sens. 2012, 4, 3857–3876. [CrossRef]
42. Chen, L.J.; Liu, G.H.; Li, H.G. Estimating Net Primary Productivity of Terrestrial Vegetation in China Using Remote Sensing. J. Remote Sens. 2002, 6, 129–135.
43. Wang, H.; Li, X.; Long, H.; Zhu, W. A study of the seasonal dynamics of grassland growth rates in Inner Mongolia based on AVHRR data and a light-use efficiency model. Int. J. Remote Sens. 2009, 30, 3799–3815. [CrossRef]
44. Brogaard, S.; Runnstrom, M.; Seaquist, J.W. Primary production of Inner Mongolia China, between 1982 and 1999 estimated by a satellite data-driven light use efficiency model. Glob. Planet. Chang. 2005, 45, 313–332. [CrossRef]
45. As-Syakur, A.R.; Osawa, T.; Adnyana, I.W.S. Medium spatial resolution satellite imagery to estimate gross primary production in an urban area. Remote Sens.2010, 2, 1496–1507. [CrossRef]
46. Propastin, P.; Kappas, M. Modeling Net Ecosystem exchange for grassland in Central Kazakhstan by combining remote sensing and field data. Remote Sens.2009, 1, 159–183. [CrossRef]
47. Bradford, J.B.; Hicke, J.A.; Lauenroth, W.K. The relative importance of light-use efficiency modifications from environmental conditions and cultivation for estimation of large-scale net primary productivity. Remote Sens. Environ. 2005, 96, 246–255. [CrossRef]
48. Zhu, W.; Pan, Y.; He, J.; Yu, D.; Hu, H. Simulation of maximum light use efficiency for some typical vegetation types in China. Chin. Sci. Bull. 2006, 51, 457–463. [CrossRef]
49. Tucker, C.J. Red and photographic infrared linear combinations for monitoring vegetation. Remote Sens. Environ. 1979, 8, 127–150. .[CrossRef]
50. Colantoni, A.; Monarca, D.; Marucci, A.; Cecchini, M.; Zambon, I.; Di Battista, F.; Maccario, D.; Saporito, M.G.; Beruto, M. Solar Radiation Distribution inside a Greenhouse Prototypal with Photovoltaic Mobile Plant and Effects on Flower Growth. Sustainability 2018, 10, 855. [CrossRef]
51. Hua, L.Z.; Liu, H.; Zhang, X.L.; Zheng, Y.; Man, W.; Yin, K. Estimation Terrestrial Net Primary Productivity Based on CASA Model: A Case Study in Minnan Urban Agglomeration, China. In IOP Conference Series: Earth and Environmental Science; IOP Publishing: Bristol, UK, 2014; Volume 17, pp. 1–6. [CrossRef]
52. Turner, D.P.; Gower, S.T.; Cohen, W.B.; Gregory, M.; Maiersperger, T.K. Effects of spatial variability in light use efficiency on satellite-based NPP monitoring. Remote Sens. Environ. 2002, 80, 397–405. [CrossRef]
53. Dubber, W.; Eklundh, L.; Lagergren, F. Comparing field inventory with mechanistic modelling and light-use efficiency modelling based approaches for estimating forest net primary productivity at a regional level. Boreal Environ. Res. 2017, 22, 337–352.
54. Choudhury, B.J. Estimating gross photosynthesis using satellite and ancillary data: Approach and preliminary results. Remote Sens. Environ. 2001, 75, 1–21. [CrossRef]
55. Bird, D.W.; O’Connell, J.F. Behavioral ecology and archeology. J. Archaeol. Res. 2006, 14, 143–188.
56. Goudriaan, J. Crop Micrometeorology: A Simulation Study; Centre for Agricultural Publishing and Documentation PUDOC: Wageningen, The Netherlands, 1977; p. 249.
57. Monteith, J.L. Solar radiation and productivity in tropical ecosystems. J. Appl. Ecol. 1972, 9, 747–766.
58. Chen, X.; Cui, Z.; Fan, M.; Vitousek, P.; Zhao, M.; Ma, W.; Wang, Z.; Zhang, W.; Yan, X.; Yang, J.; et al. Producing more grain with lower environmental costs. Nature 2014, 514, 486–489.
59. Raza, S.M.H., Mahmood, S.A., Khan, A.A. et al. “Delineation of Potential Sites for Rice Cultivation Through Multi-Criteria Evaluation (MCE) Using Remote Sensing and GIS” Int. J. Plant Prod. (2018) 12: 1. https://doi.org/10.1007/s42106-017-0001-z. [CrossRef]