
Estimation of Net Rice Production for the Fiscal year 2019 using Multisource Datasets
Awais Karamat1, Abdul Rehman1, Muhammad Ayyaz1, Sajid Ali1, Iqra Manzoor1, Hafiz Adnan Ashraf1, Farzeen Riaz1, M Usman Tanveer1 and S Amer Mahmood.
1 Remote sensing and GIS group, Department of Space Science, University of the Punjab Lahore, Pakistan.
* Correspondence: Awais Karamat E-mail: awaiskaramat89@gmail.com
Citation | Karamat.A, Rehman.A, Ayyaz.M, Ali.S, Manzoor.I, Ashraf.A.H, Riaz.F, Tanveer.M.U and Mahmood.S.A”. Estimation of Net Rice Production for the Fiscal year 2019 using Multisource Datasets. International Journal of Agriculture and Sustainable Development, Vol 01 Issue 02: pp 47-65, 2019.
DOI | https://doi.org/10.33411/IJASD/2019010201
Received | Feb 16, 2019; Revised |March 18, 2019 Accepted | March 19, 2019 Published | March 22, 2019.
________________________________________________________________________
Abstract
Smallholder farmers are threatened by various vulnerable risks which include hostile weather conditions, rainfall at odd times, disease outbreaks and the market shocks. Crop insurance is the only solution to mitigate these risks. Crop yield records are of great importance to predict the crop yield/area into a region but the developing countries like Pakistan, have limited availability of crop yield records. Crop Reporting Service (CRS) in Punjab province of Pakistan has taken this initiative to save crop related data. We obtained the CRS based datasets of rice crop from (2008-2018) to predict the rice yield/area for the fiscal year 2019. The CRS based datasets were incorporated in collaboration with remotely sensed dataset to obtain more accurate results. The spectral responses of rice crop were taken as input to compute NDVI/RVI values of each year. We applied linear regression to NDVI/RVI and the CRS based yield to generate regression equations for prediction of rice yield for the year 2019 which was computed as 2.09 (ton/ha). The area under rice cultivation was estimated using supervised classification that was 139616 hectors. The net rice production was estimated as 219797 tons. Spectral responses of rice crop canopy proved efficient to determine the net productions.
Keywords: Historical datasets; CRS; Disease outbreaks; Regression analysis and Remote Sensing.
Introduction:
About half of the world’s population is using rice as an essential food/crop [1]. The major contribution in rice production is obtained from Asian countries. Careful estimates represent that 90% of global rice production is achieved from China, Pakistan, India and Indonesia etc. According to a global survey, about 85% of rice farms are owned by farmer which hold small lands (less than 10 acre) [2]. Such cultivators grow their crops in very challenging conditions to get targeted productions. A big variety of threats always remain in rice fields which may degrade the rice yield e.g., hostile weather conditions, water availability and its application, pest attacks and the inflation in local market which leads to income insecurity [3].Other hostile conditions include rainfall in odd times, droughts, glacial retreat, storm surges and a rise in sea level are the major events that act to intensify the risk of yield degradation [4]. Subtropical regions are mostly hit by these events [5]. The crop phenology has put huge pressure on small farmers to grow healthy for obtaining sufficient grains which is enough to cater the weeds of increasing population [6]. Therefore, it is important to estimate the exact volume of net productions which make a decision maker to construct a concrete strategy for sustainable development [7,8]. Assessment of precise yield, well in time, is of great significance to manage all types of food crisis in a good way [9].
The risk of all the challenges discussed above, can be reduced by increasing per hector yield [10,11,12,13]. Ara –Yield Index Cover (A Y I C) is a promising parameter which assist to compute net productions with limited available resources [14]. AYIC actually consider the historic records to estimate per hector yield. The information about historic rice records is limited in progressing countries like Pakistan, Bangladesh and India which constrains to apply AYIC [14]. Historic crop records are very important due to their replicable and unbiased nature that is good to achieve precise estimates of yield by their collaboration with remotely sensed datasets.
There is a big variety of mechanisms available to estimate the rice yield but the most appropriate among all methods is to generate a correlation between historic records and remotely sensed vegetative responses [15]. The basic theme to understood, is to develop a relationship between the yield and the photosynthetic activity in plants. Various plant related indices e.g., Normalized Different Vegetation Index (NDVI) and Ratio Vegetation Index (RVI), are capable to computed the amount of biomass generated in each day during the growth and development of a crop [16].
Crop information is collected through consecutive field surveys in Pakistan. These surveys are conducted as a result of joint venture by various departments that include, Crop Reporting Service (CRS), Punjab Irrigation and Power Department and the Revenue department. These records are checked and published by statistical department [17]. The CRS department make public these reports after the harvest of a particular crop.
The main objective of this research was to estimate net rice productions for the fiscal year 2019 [18]. It also aims at creating a correlation between the spectral responses of rice crop and the historic records by CRS department.
Material and methods.
Study Area
This research was conducted in Hafizabad in Punjab province of Pakistan [19]. The study site is famous for production of high-quality rice globally. This region receives penalty of rainfall in monsoon which is good for rice cultivation. The test site is mapped in Figure 1.

Figure 1. Study area.
Experimental Design
Figure 2 is showing the flow of methodology used in this research. First, we obtained spectral bands in red and Near Infrared wavelengths recorded by Landsat for the years 2008-2018. These bands are useful to compute NDVI and RVI based datasets. A linear regression was applied to NDVI/RVI values as independent variable and CRS yield/area records as dependent variables. We computed regression equations to compute the expected yield for the fiscal year 2019. Supervised classification was applied to extract the rice area which was validated though ground survey to estimate precise area, which assisted to compute net rice productions. The flow of methodology used in this research is showing in Figure 2.
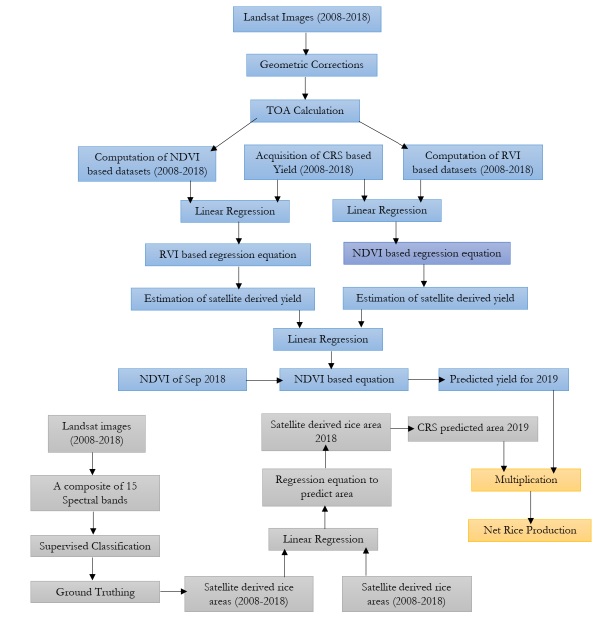
Figure 2. Flow of methodology.
Material and methods.
There is a big number of methods available to estimate crop yield. Field surveys are
commonly used to extract crop related information and to evaluate the exact volume of grains.
Consecutive field visits are commonly adopted globally to predict the crop yield [20]. Satellite
technology provides pixel-based monitoring of large spatial extents at very low cost and
somewhere free while using the services of Landsat and MODIS etc. [21]. These satellites
cover large areas with very high temporal resolution which is near to impossible to obtain by
field visits physically. The spectral responses of crop canopy are captured by various satellite
sensors which are onboard at satellite’s payload. These responses are of great importance to
investigate crop health and the growth index [22].The temporal responses of crop are
evaluated to determine net biomass generated throughout the crop cycle. The spectral bands
collaborate and their combinations provide indices which are helpful to monitor the crop
health in every growth stage. The spectral bands involved in development of vegetative indices,
compare the spectral bands in Near Infrared and red wavelength ranges. It is because of
occurrence of maximum reflectance in Near Infrared (NIR) in comparison to Red.
Commonly used indices include Normalized Difference Vegetation Index (NDVI)
and the Ratio Vegetation Index (RVI) [23]. RVI has capability to filter out vegetative features
only while ignoring the others e.g. snow, water or soil. However, NDVI is commonly used to
evaluate, the growth index. RVI and NDVI can be computed using Equations 1,2 according
to [24].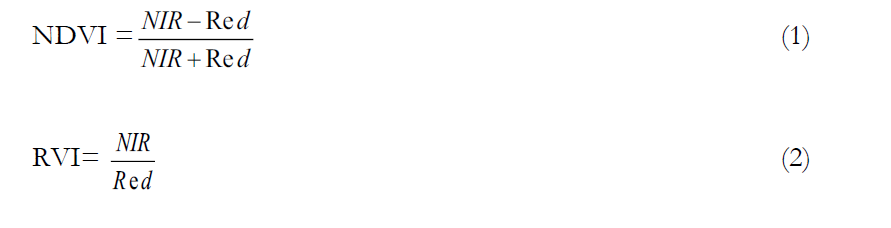
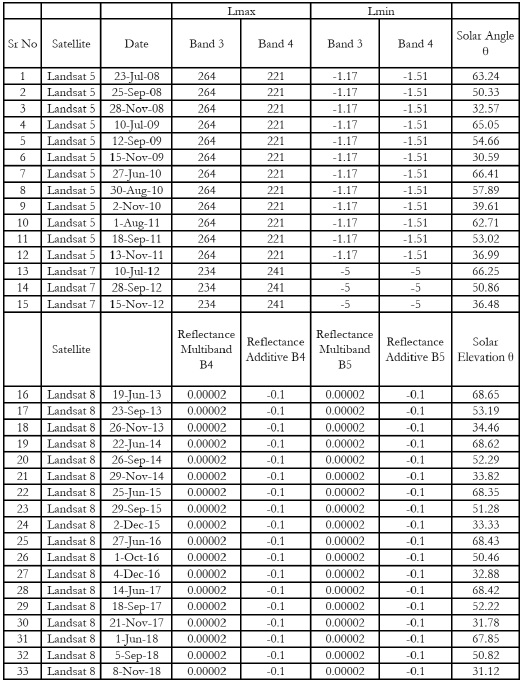
The satellite imagery used in this research, was acquired from United State Geological
Survey (USGS) website for the years (2008 - 2018). We downloaded 33 satellite images for
further processing. Each image consists of various spectral bands. Theses spectral bands were
used to compute vegetative indices. The spatial resolution of these bands was 30 m2 having a
temporal window of 16 days. Image acquisition dates were decided by considering the time
span of actual rice practices in the study site. Detailed description of satellite images is listed
in Table 1.
Table 1. Landsat 5,7 and 8 acquisition dates and metadata.
Scan Line Corrector (SLC) is an important instrument mounted on satellite payload to
remove the back-scatter line automatically from satellite images [25]. SLC mounted on Landsat
7, stopped working on May 31, 2003 therefore, all the images produce after this date had
missing data strips [26]. A careful estimate described that a complete satellite image had 22%
data missing within a swath of 185 km2. We recovered the missing data by its comparison with
google earth historical imagery on visual interpretation basis using, nearest neighbor technique
in Erdas Imagine 14.
In the next, we performed geometric corrections. Geometric correction is the
preprocessing phase which is significant to perform to achieve precise results during geometric
measurements [27]. Geometric correction is a comparative study of spatial location of a
geographic feature mapped in satellite imagery in comparison to its actual location in real
world.
To do so, we marked major land marks e.g. road intersection points, large area
buildings and the water body for cross matching these locations using Differential Global
Positioning System (DGPS). Computation of Top of Atmosphere (TOA) reflectance is
preprocessing phase which is essential to obtain noise free image. Removal of atmospheric
noise is significant to get precise results [28]. Computation of TOA return more precise results
as compared to atmospheric corrections. The mechanism to compute TOA reflectance is
different for different satellites. The procedure to compute TOA is described in equations 3,4
as below
L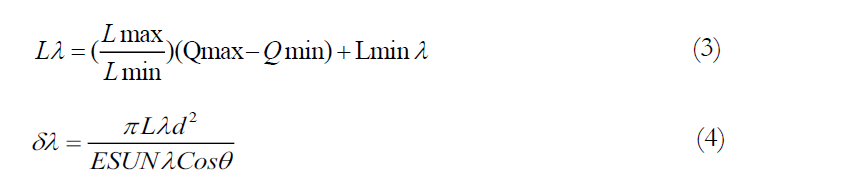
Where Lmax and Lmn are spectral radiances. Qmax and Qmn are representing the quantized
digital number, L is irradiance recorded in w/m2 srμm, d is distance from earth to sun and θ is
solar angle measured in degree decimal.
The algorithm to compute TOA for Landsat 8 is described in equation 5,6 as below.
B4TOA Reflectance = (2xe-5xB4)-0.1/Sin (ɵ*π/180) (5)
B5TOA Reflectance = (2xe-5xB5)-0.1/Sin (ɵ*π/180) (6)
Crop related historical reports are important products of CRS department which
provide mainly two types of information e.g., yield, (kg/ha) and area (km2). We obtained the
annual yield and the rice area for the years from 2008 to 2018 from CRS reports and
incorporated this stuff with remotely sensed spectral responses [25].
To extract the satellite derived rice area for the years (2008-2018), we prepared a
composite of 15 spectral bands for each year e.g., the spectral bands which contributed in the
composite, prepared for the year 2008 was comprised of (5 spectral bands of June 2008, 5
band of September 2008 and 5 bands of November 2008). The layer staking is drawn in Figure
3.
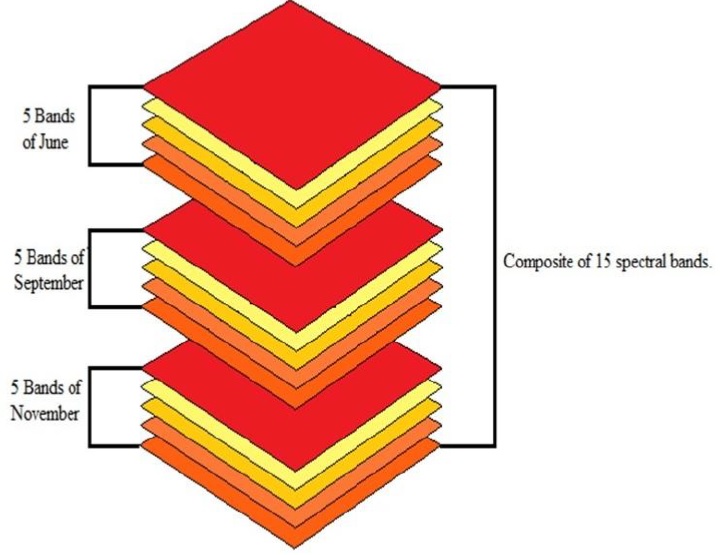
Figure 3. A composite containing 15 spectral bands.
This composite is useful to extract detailed information about Land Use Land Cover
(LULC) existing in the study site. For accuracy assessment, we applied an elegant indicator,
Root Mean Square Error (RMSE) which can be computed using the expression as below.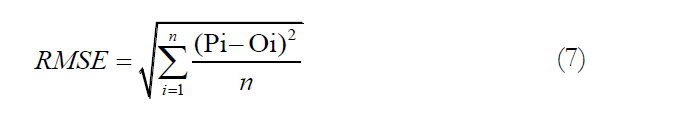
Where pi and Oi are predicted and observed values. A value “RMSE=0” is considered ideal
[15]. The exaggerations (over/under estimations) may be computed by RMSE. It is also used
to determine potential biomass [29].
Results and Discussions
The annual variations in NDVI are mapped in Figure 4 using spectral bands in red and near Infrared wavelengths.
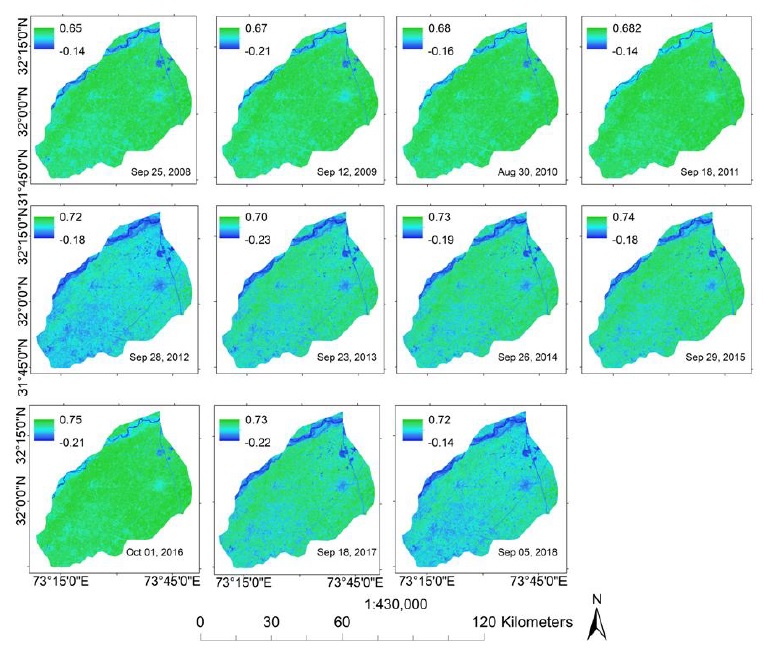
Figure 4. Variations in NDVI for the years from 2008 to 2018.
To compute vegetation indices, we selected the Landsat images for the month of September only because the rice crop reflect maximum in near infrared range in the month of September. The computed NDVI and RVI are listed in Table 2 along with CRS reports yield values.
Table 2. NDVI/RVI values for the complete study period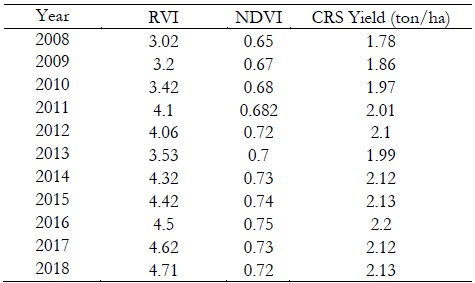
We applied a linear regression model to annually computed NDVI values against the CRS reported yields and mapped the results in Figure 5.

Figure 5. Linear regression between annual NDVI and CRS reported yield.
Figure 5 is showing a fair relationship between both variables with coefficient of determination R2 = 0.92 with a regression equation as below,
y = 3.8576x - 0.6883 (8)
Where ‘y’ and ‘x’ are satellite derived yield and the NDVI respectively.
Again, a linear regression was applied to annual RVI values against the crop related yield and mapped the result in Figure 6 which is showing a strong relationship between both of variables with coefficient of determination R2 =0.86 as below,
y = 3.8576x
y = 3.8576x --0.68830.6883R² = 0.92R² = 0.92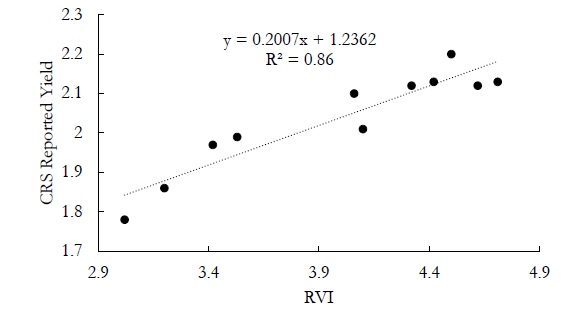
Figure 6. Linear regression between annual RVI and CRS reported yield.
A regression equation based on RVI was generated to compute satellite derived RVI values for upcoming year 2019.
y = 0.2007x + 1.2362 (9)
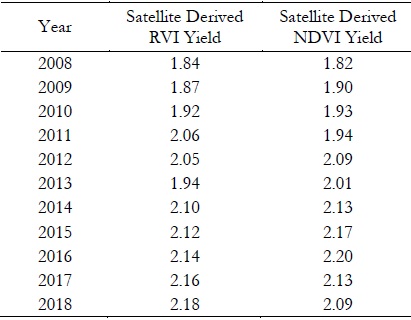
Where ‘y’ and ‘x’ are satellite derived yield and the RVI respectively. We computed the satellite derived yields by substituting annual NDVI and RVI values in Equations 8,9 and the results are listed in Table 3 as below
Table 3. Satellite derived annual yield values.
To choose an appropriate yield equation, we applied a linear regression to both of yields listed in Table 3 and mapped the results in Figure 7.

Figure 7. Linear regression applied to satellite derived NDVI and RVI values.
We found both of yields highly correlated with coefficient of determination R2 =0.8323. This R2 allowed us to choose any one of regression Equation (8 or 9) to predict the rice yield for upcoming year 2019. We selected NDVI based Equation 8 to estimate yield because NDVI is more reliable and widely used index, however, RVI is used to discriminate land cover feature e.g., water, soil and snow. The RMSE was estimated as 0.21 which is ideal and show the accuracy of the model.
Area Estimation
The spatial extent of rice area for the years (2008-2018) was delineated using supervised classification and mapped the spatial extent of rice cultivations in Figure 8. It was impossible to discriminate between various types of vegetative species planted in the study site using supervised classification therefore, we used spectral library and cross matched the spectral responses of grass, rice, sugarcane and Jawar to filter out the rice area precisely. We found that the study site remained under rice cultivation extensively and the weight of non-rice vegetation was less than 1% throughout the study period. Spatial extent of the area under rice cultivation is mapped in Figure 8.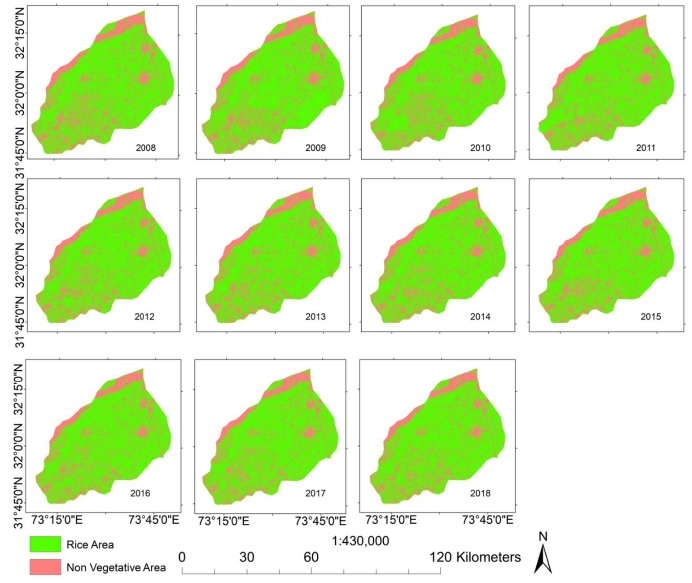
Figure 8. Spatial extent of rice area for the years from 2008 to 2018.
The satellite derived rice area was computed for the years from 2008 to 2018 and listed the results in Table 4.
Table 4. CRS Vs satellite derived area.
We compared the satellite derived areas with CRS reported areas and observed exaggeration in satellite derived area which may be due to the coarse resolution of Landsat imagery which we used in this research. On investigation, we found that Landsat imagery had considered some non-vegetative features in account of rice areas, and such situation was mostly observed for rice plantations along roadside. However, the products of other high-resolution satellites such as Geo-Eye, Quick Bird and World View may provide more accurate classification results but we will have to bear high cost for purchase of such imageries which is uneconomical for large spatial extents.
A linear regression was applied to both of areas CRS reported rice area and the satellite computed rice area and mapped the results in Figure 9. We found a strong relationship between them with coefficient of determination R2 = 0.94. A regression equation was also generated as to predict the rice area for the year 2019 as below,
y = 0.9478x + 9293.7 (10)
Where ‘y’ and ‘x’ are CRS and satellite derived areas respectively

Figure 9. Satellite derived verses CRS reported rice areas.
We acquired a Landsat 8 image of Sep 2018 and extracted the spatial extent of rice area through supervised classification. The total rice area of study site was estimated as 141795 ha. To get rice area more precisely, we conducted a field survey along with survey officer using GPS. Ground Control Points (GCPs) were adjusted at various remote locations which were not recognized easily on satellite images. Many of these locations were found near to human
y = 0.9478x + 9293.7
y = 0.9478x + 9293.7R² = 0.94R² = 0.94
settlements. The accuracy of supervised classification was observed as 89%. Maximum accuracy of supervised classification can be acquired up to 92% [30]. The satellite derived rice area as substituted in equation (10) to predict the CRS reported area which was 139616 ha.
To predict the rice yield for upcoming year 2019, we computed the NDVI of same image which was 0.72. This value of NDVI was substituted in Equation (8) to estimate rice yield which was 2.09 (ton/ha). Finally, the net rice production was predicted as 291797 Ton by taking a product of rice area and the yield.
Conclusions
The significance and reliability of historical datasets is explained in this research. Actually, it is a joint venture of remotely sensed datasets with historical datasets. A simple flow of methodology is discussed in this research which is applicable to all the crops to get precise estimates.
Author’s Contribution. All the authors contributed equally.
Conflict of interest. We have no conflict of interest for publishing this manuscript in IJASD.
References:
1. Mostafa K Malesh., Quazi K. Hassan., Ehsan H. Chowdhury. (2016) “Development of Remote Sensing Based Rice Yield Forecasting Model” Spanish Journal of Agricultural Research,14(2).
2. Nagayet, O. Small Farms: Current Status and Key Trends (2005). “In the Future of Small Farms, Proceedings of a Research Workshop,” Wye, UK, 26–29 June; International Food Policy Research Institute: Washington, DC, USA, pp. 355–367.
3. O’Brien, K., Leichenko, R., Kelkar, U., Venema, H., Aandahl, G., Tompkins, H., Javed, A., Bhadwal, S., Barg, S., Nygaard, L., West, J., et al. (2004). “Mapping vulnerability to multiple stressors: Climate change and globalization in India”. Global environment change.14(4), 303–313.
4. Parry, M.L., Canziani, O.F., Palutikof, J.P., van der Linden, P.J., Hanson, C.E., Eds.; (2007). “Impacts, Adaptation and Vulnerability. Contribution of Working Group II to the Fourth Assessment Report of the Intergovernmental Panel on Climate Change”. Cambridge University Press: Cambridge, UK,
5. Mendelsohn, R. (2009) “The impact of climate change on agriculture in developing countries”. Journal of natural resources.1(1), 5–19.
6. Gillani.S.A, Rehman.S, Ahmad.H.H, Rehman.A, Ali.S, Ahmad.A, Junaid.U, and Ateeq.Z.M Appraisal of Urban Heat Island over Gujranwala and its Environmental Impact
Assessment using Satellite Imagery (1995-2016). International Journal of Innovations in Science and Technology, Vol 01 Issue 01: pp 1-14, 2019.
7. Nabi.G, Kaukab.I.S, Zain S.S.A.S, Saif.M, Malik.M, Nazeer.N, Farooq.N, Rasheed.R and Mahmood S.A”. Appraisal of Deforestation in District Mansehra through Sentinel-2 and Landsat imagery. International Journal of Agriculture and Sustainable Development, Vol 01 Issue 01: pp 1-16, 2019.
8. Saifullah M, Islam.B, Rehman.S, Shoaib M, Haq.E, Gillani.S.A, Farooq.N, Zafar.M”. Estimation of Water Stress on Rice Crop Using Ecological Parameters. International Journal of Agriculture and Sustainable Development, Vol 01 Issue 01: pp 17-29, 2019.
9. Nitika Sandhu and Arvind Kumar (2017)“Bridging the Rice Yield Gaps under Drought: QTLs, Genes, and Their Use in Breeding Programs” Agronomy , 7(2), 27; doi:10.3390/agronomy7020027
10. Miranda, M.J.; Gonzalez-Vega, C. (2011). “Systemic risk, index insurance, and optimal management of agricultural loan portfolios in developing countries”. American journal of agricultural economics. 93(2), 399–406.
11. Shannon, H.D.; Motha, R.P. (2015). “Managing weather and climate risks to agriculture in North America, Central America and the Caribbean”. Weather Climate extremes.10(1), 50–56.
12. Raza, S.M.H.; Mahmood, S.A. 2018 Estimation of Net Rice Production through Improved CASA Model by Addition of Soil Suitability Constant (ħα). Sustainability, 10, 1788.
13. Swain, M. (2014). “Crop Insurance for Adaptation to Climate Change in India”, Asia Research Centre Working Paper. 1-41.
14. Miranda, M.J.; Farrin, K. (2012) “Index insurance for developing countries”. Applied economic perspective, 34 (3), 391–427.
15. Siyal et al., (2015) “Rice yield estimation using ETM+ data” Journal of applied remote sensing, 9, 1-16.
16. Prasad AK, Singh RP, Tare V, Kafatos M (2007) Use of vegetation index and meteorological parameters for the prediction of crop yield in India. International Journal of Remote Sensing 28: 5207–5235.
17. Bala, S.K.; Islam, A.K.M.S. Estimation of Potato Yield in and around Munshiganj Using Remote Sensing NDVI Data; Institute of Water and Flood Management: Dhaka, Bangladesh, 2008; p. 79.
18. Fang, H., Liang, S., Hoogenboom, G., Teasdale, J., Cavigelli, M., (2008). “Corn-yield estimation through assimilation of remotely sensed data into the CSM-CERES-Maize model”. International Journal of Remote Sensing. 29 (10), 3011–3032.
19. J. F. Huang, Tang Shu-chuan, Ousama Abou-Ismail, Wang Ren-chao., et al. (2002) “Rice yield estimation using remote sensing and simulation,” Journal of Zhejiang University-SCIENCE A 3(4), 461–466.
20. Groten SME (1993) NDVI – Crop Monitoring and Early Yield Assessment of Burkina-Faso. International Journal of Remote Sensing 14: 1495–1515.
21. Rahman, A.; Roytman, L.; Krakauer, N.Y.; Nizamuddin, M.; Goldberg, M. Use of vegetation health data for estimation of Aus rice yield in Bangladesh. Sensors 2009, 9, 2968–2975. 35.
22. Huang, J.X.; Wang, X.; Li, H.; Tian, Z. 2013, Remotely sensed rice yield prediction using multi-temporal NDVI data derived from NOAA’s AVHRR. PLoS One 8, e70816
23. Mkhabela MS, Bullock P, Raj S, Wang S, Yang Y (2011) Crop yield forecasting on the Canadian Prairies using MODIS NDVI data. Agricultural and Forest Meteorology 151: 385–393.
24. Bunkei Matsushita, Wei Yang, Jin Chen, Yuyichi Onda, Guoyu Qiu., (2007) “Sensitivity of the Enhanced Vegetation Index (EVI) and Normalized Difference Vegetation Index (NDVI) to Topographic Effects: A Case Study in High-Density Cypress Forest” sensors,7, 2636-2651.
25. Jeffrey G. Masek., Miroslav Honzak., Samuel N Goward., Ping Liu., Edwin Pak., (2001.) et al. Landsat-7 “ETM+ as an observatory for land cover Initial radiometric and geometric comparisons with Landsat-5 Thematic Mapper” “Remote sensing of the environment” 78(1), 118-130
26. Noureldin, N.A.; Aboelghar, M.A.; Saudy, H.S.; Ali, A.M. Rice yield forecasting models using satellite imagery in Egypt. Egypt. J. Remote Sens. Space Sci. 2013, 16, 125–131.
27. Raza, S.M.H.; Mahmood, S.A.; Khan, A.A.; Liesenberg, V. 2018. Delineation of Potential Sites for Rice Cultivation through Multi-Criteria Evaluation (MCE) Using Remote Sensing and GIS. Int. J. Plant Prod. 12, 1–11.
28. Raza, S.M.H., S.A. Mahmood, V. Liesenberg, S.S. Hassan. 2018. Delineation of vulnerable zones for YSB attacks under variable temperatures using remote sensing and GIS. Sarhad Journal of Agriculture, 34(3): 589-598.
29. C. J. Willmott, 1982 “Some comments on the evaluation of model performance,” Bull. Am.Meteorol. Soc. 63(11), 1309–1313.
30. Sisodia P.S, Tiwari V and Kumar A, 2014 “Analysis of supervised maximum likelihood classification for remote sensing image” IEEE international conference on recent advances and innovations in engineering (ICRAIE-2014), May 09-11, 2014, Jaipur, India.