
Identification of Potential Sites for Rice Plant Growth using Multi Criteria Decision (MCE) Technique Through Remote Sensing and GIS
Fareeha Akram1, Faiza Mahmood 2, M.Saifullah 2, Memoona Zafar3, Shazma Saman3, Sumira Yasmeen3, Awais Karamat2 and Muhammad Usman Tanveer2.
1 Soil fertility Agriculture Department
2 University of the Punjab Lahore
3 Kohat University of Science and Technology
* Correspondence: Fareeha Akram E-mail: Fareeha.ch1468@gmail.com
Citation | Akram F, Mahmood F, Saifullah M, Zafar M, Saman S, Yasmeen S, Karamat A and Tanveer. S. U.,”. Identification of Potential Sites for Rice Plant Growth using Multi Criteria Decision (MCE) Technique Through Remote Sensing and GIS. International Journal of Agriculture and Sustainable Development, Vol 01 Issue 04: pp 104-114, 2019.
https://doi.org/10.33411/IJASD/2019010401
Received | July 20, 2019; Revised |Aug 23, 2019 Accepted | Aug 25, 2019; Published | Sep 01, 2019.________________________________________________________________
Rice is one of major corps grown in Pakistan. It is considered as the backbone of Pakistan’s economy. Almost all the rural population of Pakistan is involved in rice preparation from its germination to final harvest. Although its contribution is less in Gross Domestic Product (GDP) of Pakistan, however efforts are on the way to enhance its productivity. The land of Punjab Pakistan produces rice of export quality which is famous throughout the world. Rice crop growth promoting parameters are considered essential to achieve high yield e.g., temperature, humidity, pressure, soil pH, soil type, drainage and electric conductivity. We used Multi-Criteria decision analysis to map temperature base and soil-based rice friendly zones. The results show that the total area under investigation was 3151km2, out of which 2075 km2 was observed highly suitable, 772 km2 was moderately suitable and 303 km2 was not suitable for rice cultivation. On ground validation, it was observed that the areas which were not suitable for rice cultivation, were actually urban area. The urban areas had high temperatures due to anthropogenic activities and fossil fuel emissions. Remote sensing and GIS techniques proved efficient in mapping the suitability zones for rice crop.
Keywords: Gross Domestic Product (GDP); Multi-Criteria decision analysis; Suitability zones; anthropogenic activities; GIS
Introduction
Rice is a staple food/crop widely used throughout the world. Three billion people are eating rice as an essential food [1]. It is considered as the backbone of Pakistan’s economy. Almost all the rural population of Pakistan is involved in rice preparation from its germination to final harvest. Approximately, 10% of Pakistan’s crop area remain under rice cultivation that contribute about 1.6% in total Gross Domestic Product (GDP) of Pakistan [2]. Keeping in view its less contribution in GDP, Government of Pakistan have taken bold steps to enhance the rice production. The land suitable for rice cultivation is decreasing due to increase in population and the speedy urbanization. The Agricultural growth promoting parameters are considered essential to achieve high yield e.g., temperature, humidity, pressure, soil pH, soil type, drainage and electric conductivity [3]. Rice production can be enhanced up to double by incorporating these crop growth parameters. Our local farmer is unaware of modern techniques that cause to decline the net productivity.
Physical characteristics of soil in comparison to crop needs, is termed as suitability [4]. The optimized rice production can be achieved in eco-friendly and socio-economically acceptable way [5]. Ultimate crop productivity can be increased by identifying suitable sites for growth and development of a crop [6]. Therefore, it is essential to analyze the availability of nutrients in a particular soil needed for a particular crop [7].
Many researchers have used a set of powerful tools embedded in Arc GIS to compute various variables e.g. temperature, pressure, rainfall, humidity, soil pH, soil types and soil electric conductivity which effected the productivity [8,9]. Multi Criteria Evaluation (MCE) techniques are widely used to analyze the suitable sites which assist in decision making of a particular problem [10,11]. MCE technique is capable of decision making using alternative inputs [12].
Temperature has high impacts on crop phenology [13,14]. The rice crop bearing less temperature leads to delayed productivity in each growth stage. Ziska et al., 1997 [15] observed a delay of 5-6 days in dry and wet farming. A leaf takes about 100-degree days for its emergence and this time is achieved in 5 days at a temperature of 200C and 4 days at 250C and so on [16]. Yoshida 2012 [17] investigated that a temperature drops of 100C results in a delay of 13 days in heading stage of rice crop.
The main objective of this research was to map suitability zones for rice crop by incorporating both temperature and physical parameters. The physical parameters which were taken in this research include Soil type, Electric conductivity and the pH of soil in the study site. These parameters influence the rice productivity in depth.
Materials and methods.
Study site.
This research was carried out in district Sheikhupura Punjab, Pakistan with spatial extent (31-32.5 N) latitude and (73-75E) longitude as shown in

Figure 1. The study site is laying at an elevation of 230m as compared to sea level.
There is a paved network of water channels for irrigation to agricultural crops which is maintained by Irrigation Department, Punjab. The climate remains very severe which crosses 450C in summer and drops to 10C in winter. Due to a plane topography, water management and distribution to agricultural crops is not a big deal. Figure 1. Investigation site. Material. Satellite images are of great importance to evaluate/monitor large spatial extents with great accuracy. These images have enhanced the temporal resolution to an extent which was impossible to cover using manual ways. The thermal band of Landsat image is capable of capturing land surface temperature pixel by pixel. We acquired Landsat thermal bands by keeping in view the rice crop growth stages in the study site. Dates of image acquisition are as below in Table 1,
Table 1. Thermal band acquisition dates.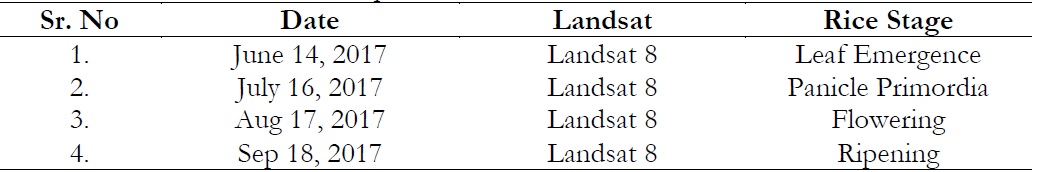
Ripening A thermal band is comprised of a grid of equal sized boxes which have some brightness values stored in each box called a digital number (DN). These DN values were converted to irradiance using a specific algorithm as below:
Irradiance = 0.0003342 * thermal band (1) The irradiance-based datasets were converted to pixel-based temperature values using the following expression. (2) In Equation 2, K1 and K2 are constants and their values are mentioned in the metadata of Landsat 8 image as below. K1 = 774.89, K2 = 1321.08 Where ε in Equation 2 represents emissivity and its value is normally taken as 0.95. Soil related data was acquired from soil survey of Pakistan. The soil parameters included soil pH, soil type and electric conductivity. We obtained soil data in excel form which was converted to shape file to apply Inverse Distance Weightage (IDW) technique. IDW is an interpolation technique which is used to compute the spatially distributed unknown values on the bases of known values. The known values are approximated to compute the unknown values. Flow of methodology. The methodology used to conduct this research is shown as below in Figure 2
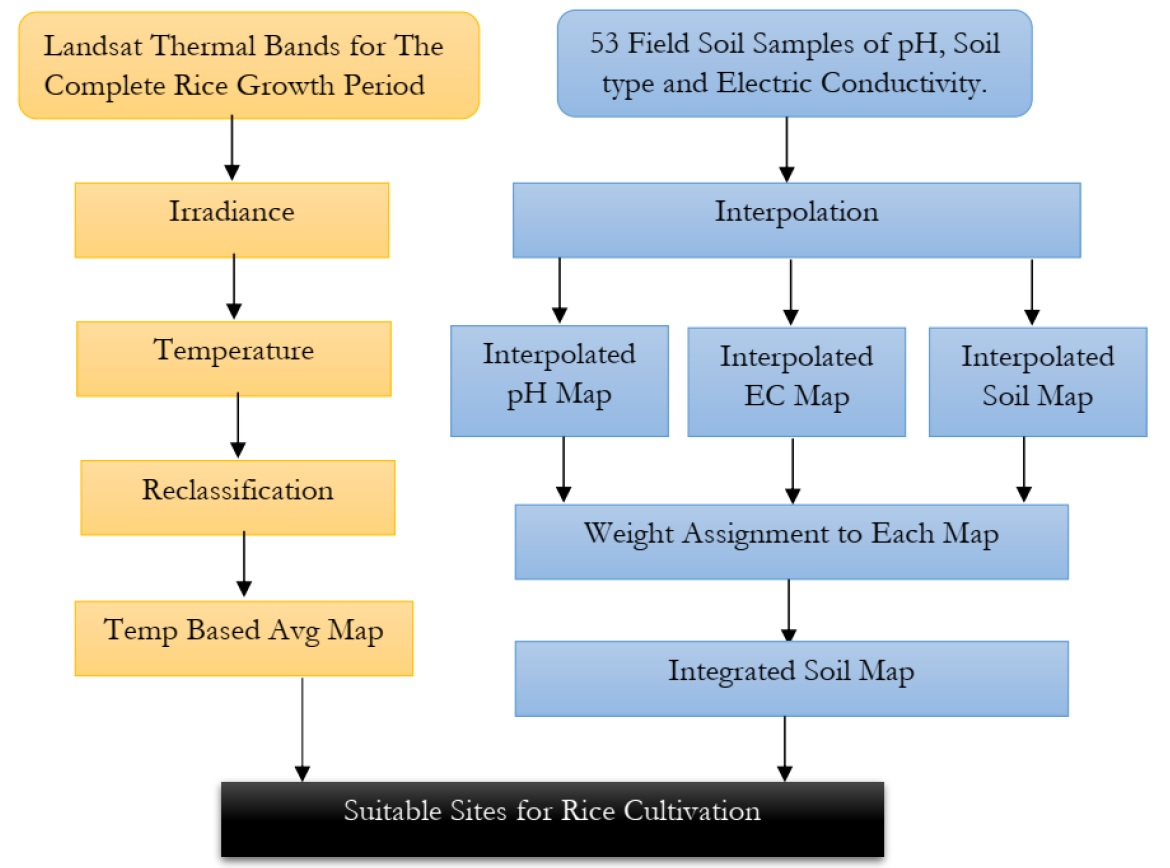
2. Flow of methodology.
Results and discussion.
Table 2. Temperature based growth of rice plant.
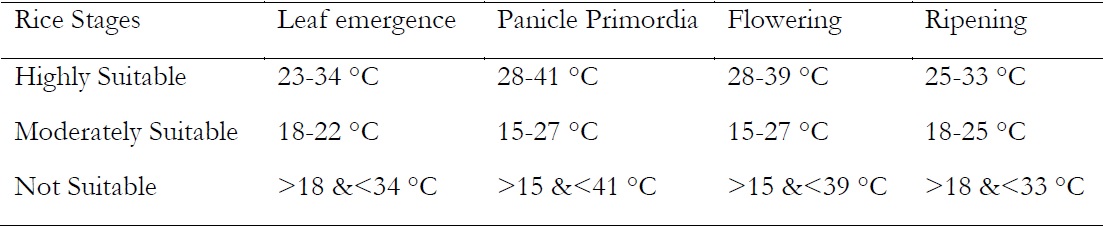
Table 2 describes the temperature base comfort/discomfort zones for rice crop in its each growth stage. Table 2 was prepared using real time field observations which are collected throughout rice growth period. This table shows that all rice crop growth stages were observed sensitive to temperature. As a temperature below 15oC and above 45oC was observed not suitable for any stage of rice crop. However, the suitable temperature ranges were as follows: 23-34 oC for leaf emergence, 28-41 oC for panicle primordia initiation and 25-33 oC for ripening stage. We observed that high temperature values are suitable for rice crop in early stages while low temperature values are good for milky dough and repining stage. All thermal dataset mentioned in Table 1 were used to compute pixel-based temperature values. We assigned them colors according to temperature base suitability levels mentioned in Table 2. We constructed temperature-based map of each stage and mapped in Figure 3 (A-D). An averaged map of these all stage was prepared as shown in Figure 3(E). We found red areas highlighted in maps were urban sites where temperature was increased due to anthropogenic activities which were highly unsuitable for rice cultivation.
Figure 3. Temperature based growth variability zones for rice. Cultivation.
Table 3. Suitability levels for soil-based parameters for rice crop.

Table 3 was prepared by incorporating ground observations which show that clay is highly suitable for rice cultivation because it has high water holding capacity and it is imperfectly drained while sandy clay was proved excessively drained therefore it was not suitable, whereas silty clay was well drained and moderately suitable while sandy clay was less suitable. The electric conductivity of soil has deep impact on the crop productivity. The electric conductivity range between 0.75-1.50 is highly suitable for rice crop and electric conductivity range between 0.00-0.75 is moderately suitable while EC 1.50-2.25 is not suitable for rice crop. We observed that a pH range of 5.5-7.5 is highly suitable for rice crop while pH above 8 or below 4 is not suitable for rice cultivation. Khairo et al., 2013 obtained same results.
For weight assignment, we applied Analytic Hierarchy Process (AHP) as shown in Table 4 and computed the highest weight that was assigned to soil type as 0.3555 and the smallest weight to electric conductivity as 0.2740. It determines that the soil type has great influence on rice crop cultivation. We constructed an integrated map by multiplying each soil parameter to its weight as shown in Figure 4 (A-C) and the integrated map as Figure 4D.
Table 4. Analytical Hierarchy Process (AHP) applied to soil parameters using Pairwise comparison matrix.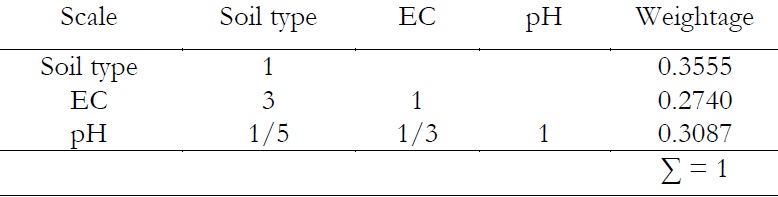
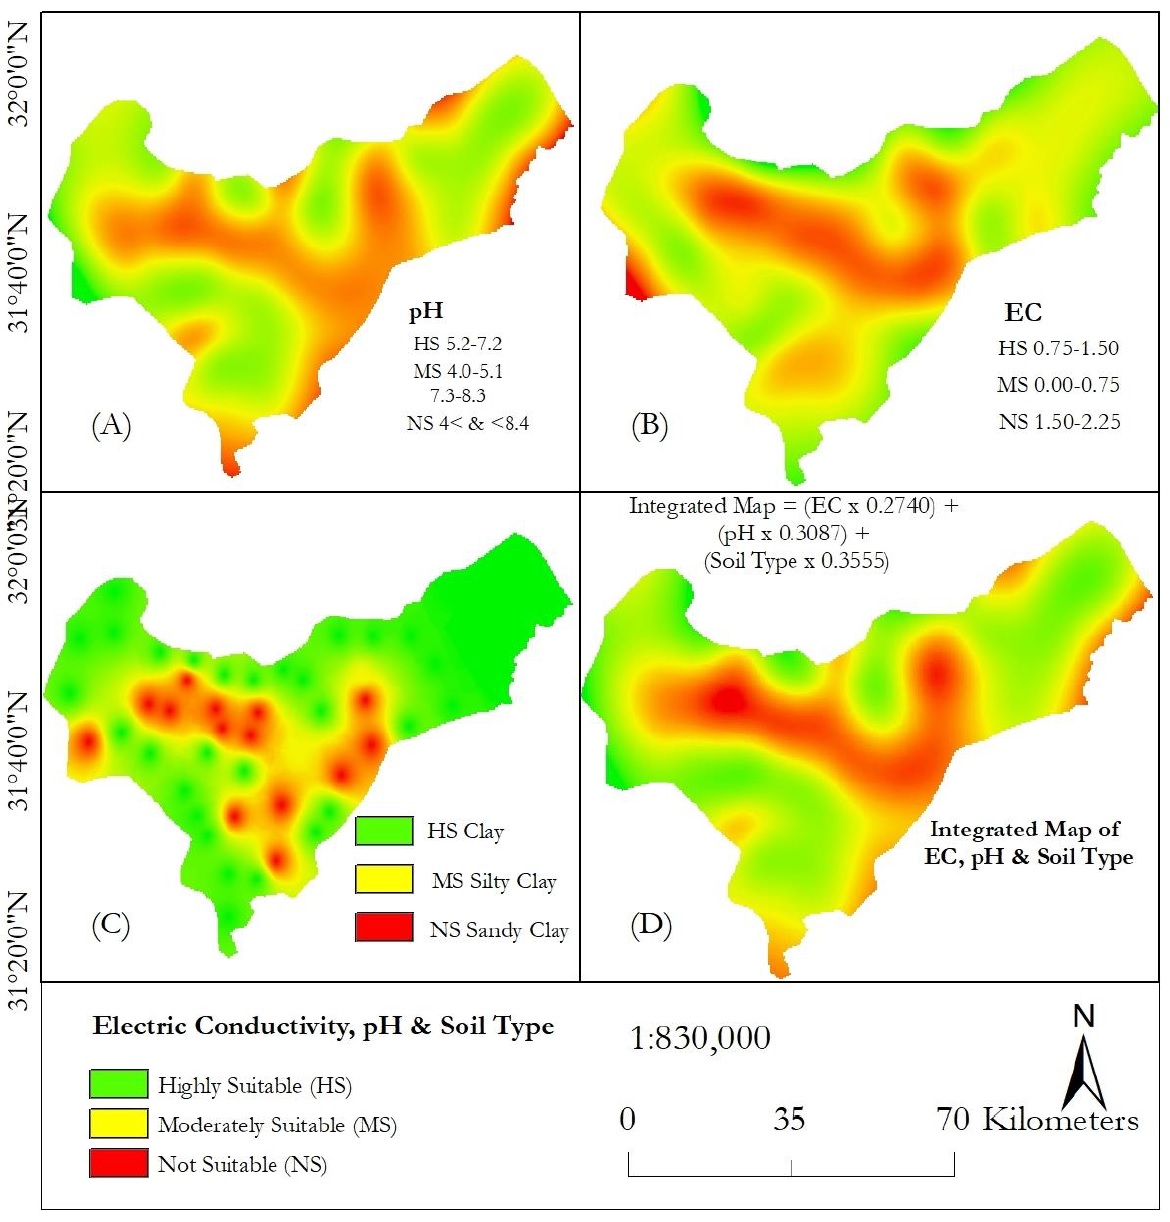
Figure 4. Suitability zones mapped on the bases of pH and Electric Conductivity.
Now the temperature base suitability map Figure 3E and soil suitability map Figure 4D were added and averaged in Figure 5 to draw a final land suitability map based upon temperature and physical parameters.
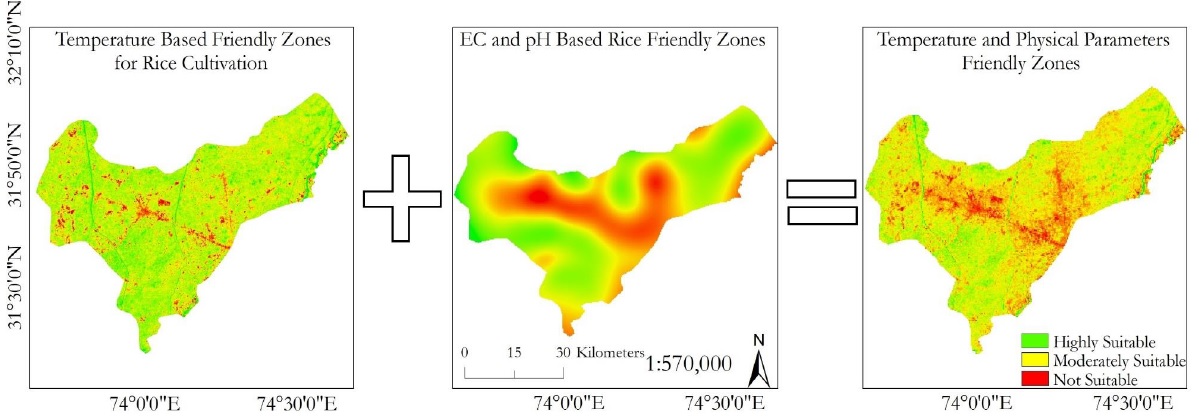
Figure 5. Final integrated rice friendly zones mapped by incorporating temperature and physical parameters.
The results show that the total area under investigation was 3151km2 out of which 2075 km2 was observed highly suitable, 772 km2 was moderately suitable and 303 km2 was not suitable for rice cultivation. On ground validation, it was observed that the areas which were not suitable for rice cultivation, were actually urban areas. The urban areas had high temperatures due to anthropogenic activities and fossil fuel emissions which were not suitable for rice plant growth. Suitable sites were found away from urban centers which are highlighted with light green color in Figure
5 Conclusion.
Multi-Criteria Decision Analysis is an efficient technique to incorporate a big variety of parameters influencing a process in its any phase. Spatial analytical techniques in Arc GIS 10.1, are supportive to figure out or map the suitable sites for rice cultivation. Local farmer is unaware of GIS based techniques therefore he ignores the site selection criteria while doing rice plantation practices and hope for the best yield that often results in vain. It is recommended that Government of Punjab should establish GIS based centers at local level to guide the uneducated farmers for achieving promising yield.
References
1. Mostafa K Malesh et al., 2016 “Development of Remote Sensing Based Rice Yield Forecasting Model” Spanish Journal of Agricultural Research. 14,2.
2. Pakistan Bureau of Statistics, 2015. Pakistan Bureau of Statistics report 2015 (http://www.pbs.gov.pk/content/monthly-bulletin-statistics-october-2015)
3. Zeinab Maddahi et al; 2014. “Land suitability analysis for rice cultivation using multi criteria evaluation approach and GIS” European Journal of Experimental Biology, 4(3),639-648.
4. Mustafa AA, Man S, Sahoo RN, Nayan A, Manoj K and Sarangi A, Mishra AK., 2011. Land suitability analysis for different crops. A multi criteria decision making approach using remote sensing and GIS. Indian Agricultural Research Institute, New Delhi-110-112.
5. Addeo G, Guastadisegni G, Pisante M 2001. Land and water quality for sustainable and precision farming. I World Congress on Conservation Agriculture, Madrid.
6. Nisar Ahamed TR, Gopal Rao K and Murthy JSR. 2000. GIS-based fuzzy membership model for crop-land suitability analysis. Agriculture System 63(2),75–95.
7. Saifullah M, Islam.B, Rehman.S, Shoaib M, Haq.E, Gillani.S.A, Farooq.N, Zafar.M”. Estimation of Water Stress on Rice Crop Using Ecological Parameters. International Journal of Agriculture and Sustainable Development, Vol 01 Issue 01: pp 17-29, 2019.
8. Raza, S.M.H., S.A. Mahmood, A.A. Khan and V. Liesenberg. 2018. Delineation of potential sites for rice cultivation through multi-criteria evaluation (MCE) using remote sensing and GIS. Int. J. Plant Prod. 12: 1–11. https://doi. org/10.1007/s42106-017-0001-z
9. Perveen F, Ryota N, Imtiaz U and Hossain KMD 2007. Crop land suitability analysis using a Mult-Criteria evaluation and GIS approach, 5th International Symposium on Digital Earth. The University of California, Berkeley, USA, 1–8.
10. Janssen R, Rietveld, P. 1990, Multi-Criteria analysis and geographical information systems: an application to agricultural land use in the Netherlands. In: Scholten HJ, Stillwell JCH (Ed) Geographical information systems for urban and regional planning. Kluwer Academic, Dordrecht, The Netherlands, 129–139.
11. Pereira JMC and Duckstein L. 1993. A multiple criteria decision-making approach to GIS-based land suitability evaluation. Int J Geogr Inf Sci 7(5):407–424
12. Jankowski P, Andrienko N, Andrienko G. 2001, Map-cantered exploratory approach to multiple criteria spatial decision making. Int J Geogr Inf Sci 15 (2):101–127.
13. M E Brown et al., 2012, “Global phenological response to climate change in crop areas using satellite remote sensing of vegetation, humidity and temperature over 26 years” Remote Sensing of Environment 12(6),174–183.
14. Raza, S.M.H., S.A. Mahmood, V. Liesenberg and S.S. Hassan. 2018. Delineation of vulnerable zones for YSB attacks under variable temperatures using remote sensing and GIS. Sarhad J. Agric.34(3):589-598.https://doi.org/10.17582/journal.sja/2018/34.3.589.598
15. Ziska E, Fraser D et. al.,1997 “Assessing risks of climate variability and climate change for rice” Science, 240.
16. M R Islam et, al., 2011. “Phenology and degree days of rice cultivars under organic culture” Bangladesh J. Bot. 40(2): 149-153.
17. Shouichi Yoshida. 2012, “Effects of temperature on growth of the rice plant (Oryza Sativa L.) in a controlled environment.” Soil Science and Plant Nutrition. 19(4), 304-307.