
A Study of Active Chaman Fault System (CFS) using SRTM DEM
Khubaib Abuzar1, Saira Batool2, Areeba Amer3, Syed Amer Mahmood4, Hania Arif4, Bushra Talib4, Muhammad Shahazad6, Rana Muhammad Sohail Aslam3
1University of Sindh Jamshoro,
2Center For Integrated Mountain Research (CIMR), University of the Punjab, Lahore.
3Wuhan University China
4 Department of Space Science, University of the Punjab, Lahore
6Department of Technology & engineering, University of the Lahore.
7Department of Computer Science (PUCIT), University of Punjab.
*Corresponding Author: Khubaib Abuzar, Khubaibabuzar72@gmail.com
Citation | Abuzar. K, Batool. S, Amer. A, Mahmood. S. A, Arif. H, Talib. B, Shahazad. M, Aslam. S. M.R, “A Study of Active Chaman Fault System (CFS) using SRTM DEM”. International Journal of Innovations in Science & Technology, Vol 03 Issue 01: pp 24-32, 2021.
Received |Jan 12, 2021; Revised | Jan 25, 2021; Accepted | Feb 12, 2021; Published | Feb 15, 2021.
________________________________________________________________________
Abstract
Chaman fault is a seismically active fault running over 850km in western region of Pakistan and Afghanistan. It is a major geological structure between Indian and Eurasian plates. Chaman fault is a strike slip fault which is slipping nearly at the rate of 10mm per year. This research includes the evaluation of lithological processes and neotectonics activity using Hypsometric Integral (HI). We calculated values of hypsometric integral using SRTM DEM with 90m spatial resolution in active region of Chaman Fault (CF) and in its locality. We analyzed different mean, minimum and maximum elevations using regular square grids and measured the degree of spatial distribution of HI using Local Indices (LI) of Spatial Autocorrelation (LISA). LISA provides auto correlation for the cluster analysis of hotspots and cold spots of HI values to discriminate uplifted and eroded regions.
Keywords: Chaman fault, LISA, DEM, Strike slip, Hypsometric integral, Neotectonics, Pakistan.
Introduction
The Chaman Fault is a seismically active sinisterly fault. It is an arrangement of geological structures that tectonically discriminates Eurasian plate from Indo-Australian plate [1]. It is the most tectonically active fault of Pakistan having almost 200km displacement in Northern region of Afghanistan. In this region the convergence occur which causes the slip displacement of Chaman fault. The Chaman fault is the strike-slip left lateral fault which links Makran and Himalayan subduction zones [2]. These subduction zones are spatially originated by the collision of Indian and Eurasian plates. This is the largest seismically active strike slip fault. The shear zone is the most prominent strain zone located between the western alluvial and eastern meta sediment region of the fault [3].
The basin of Chaman fault is a ~80 × 20 km arc which is asymmetrical basin comprising of alluvial deposits and discontinuous spatial drainage network. The basin has developed in the response of relative uplift in Khojak Pass Mountains [4] in eastern region of fault. The southern edge of Chaman basin consists of complex erosional structures while the eastern edge of basin consists of strike slip and second order thrust fault [5].
The northern edge of Indian plate facing the Eurasian plate is vulnerable to noticeable seismic activity resulting in tectonic landmarks. These landmarks comprise of the frontal Himalayan northern arc, in the northern west of Chaman fault [6]. The two major tectonic structures of Pakistan include the Main Karakorum Thrust (MKT) and Main mantle Thrust (MMT). Thus, the western and northern regions of Pakistan are more vulnerable to the earthquakes, which reside along the Iranian, Afghan and Indian micro plates [7].
The study of distribution of earthquakes in regions having faults is significant. Thus, the main objective of this study is to investigate the seismically active segments of faults and geomorphic features hosting future earthquakes. The study reveals the geomorphic and geodic features of Chaman fault to investigate its spatial variations [8].Study of neotectonics have wide range of applications in geo sciences. The topographic features of earth comprise of erosion, tectonics and climatic changes. The geology of any region plays a vital role in the determination of variations in that region [9]. The regions comprising of homogenous rocks give rise to uniform uplift while the heterogeneous rocks are the cause of varying rates of uplift. Thus, Hypsometric Index (HI) can accurately analyse different developmental stages of geomorphic features of any region. In this study geomorphic features and remote sensing technology was used to study the tectonic characteristics of Chaman fault. The northern region of Chaman fault indicates slip rates ranging from 5.2-18.1mm per year [11].
The analyses of geomorphic features indicate the slip velocities which may cause earthquakes in future. The seismic faults are more vulnerable to floods. Electric strains can cause seismic slip which may generate earthquakes [12]. These faults exhibit sliding behavior within the depths of 10 to 15 km, during an inter-seismic period of fault having static frictional strength. Identification of spatial rates of distribution and depths of faults provides data about the seismic activity, mechanical conditions and slip of fault through seismic hazard analysis [13].
In this study, we used SRTM DEM to investigate the features of aseismic faults. The aseismic faults lie along the southern and central region of Afghanistan and Pakistan [14]. The Chaman fault lies in the neighborhood of Ghazaband fault and has exhibited notable earthquakes. The SRTM DEM also investigates the heterogeneous fault creeps along the Chaman fault. The HI is used to investigate distribution of plain areas concerning to the variations in elevation. The landform age and its characterization can also be evaluated using HI technique [15, 16]. The hypsometry index also analyzes the elevation and geometry of basin along the drainage network.
Study Area
The Chaman Fault is a seismically active major strike slip and laterally left fault which has hosted major earthquakes. This fault extends from Kharan to Kabul in northern boundary and extends toward Indian plate in western boundary. It links Makran to Himalayan convergence region. The fault gouge comprises of the volcanic rocks and limestone clasts [17]. The left lateral has moved up to 450 km along the Chaman fault. In the middle of the Chaman and Bhalla Dhor fault, there lies a transform fault region ranging from 30 to 60 km. This transform fault extends for nearly 975km between Garruk and Qila Abdullah in northern direction [18].
Materials And Methods
We used grid analysis to evaluate HI values for equal squares over DEMs with 90m and 30m resolution. We obtained ASTER GDEM from http://www.ersdac.or.jp/GDEM with 30m resolution. We obtained accurate data related to HI values through DEM SRTM 90m. The HI values indicate variations along lithological and tectonic boundaries [19].
Global Spatial Autocorrelation (Moran’s I)
Spatial autocorrelation evaluates the distribution of HI values in different spatial patterns. The spatial statistical analysis evaluate autocorrelation in geo referenced data and spatial association. The global spatial autocorrelation tool can evaluate clustered, random and dispersed cell value. In this tool none of observations are represented by N and weight of each observation is recorded by SWM [20, 21]. Figure1. Shows the value of Moran which indicate positive and negative correlation. Its value may not be zero but it may be near to zero.
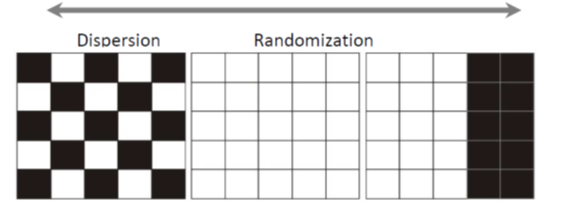
Figure1. The value of Moran remains between -1 to +1, where +1 indicates the positive correlation and -1 gives the negative correlation.
DEM resolution and HI computation
The value of HI for Chaman fault and its surrounding can be calculated using SRTM DEM with 30m and 90m resolution. The drainage channels of Hindukush are less wide than 1km so we used grid of 1 km for analysis. The grids of different sizes were used for the analysis of dependency of distribution of HI values on scale.
HI value is mainly calculated through this equation.
Topographic Surface roughness (TSR)
The texture of surface can be evaluated through topographic surface roughness method. This tool is quite helpful in study of terrain as it displays various geographical features which include erosion, crenulations allocation and features of landform. The ratio of surface area to plane area is known as surface coarseness which is used for the analysis of morphological structures. We computed the surface coarseness using SRTM DEM surface tools v. 2.1.254 for ArcGIS [22].
Results and Discussions
Chaman is a seismically active fault, hosting a number of Earthquakes having magnitude ranging from 7 to 8.1. According to Pakistan’s geological survey, the acceleration ranged from 0.24 to 0.4 for Chaman fault system. SRTM data suggests that the four faults of Chaman face variation up to 110 km which is nearly 7.8mm per year. The SRTM DEM investigation indicates that northern region of Chaman fault is experiencing aseismic slip movement.
The results show that the northern region of Chaman fault indicates slip rates ranging from 5.2-18.1mm per year. The HI GI* Hot spots extracted through SRTM DEM are shown in Figure 2-7, the slope and TSR is mapped in Figure 8,9.
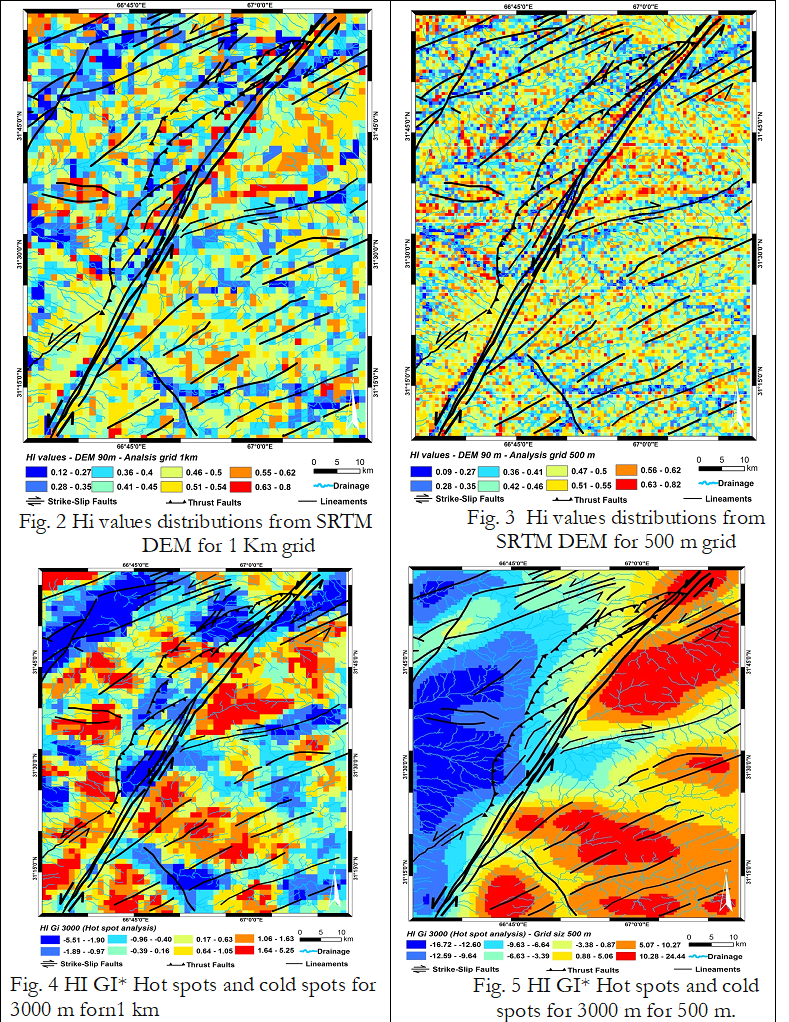
The hotspot investigations made with different DEMs and the similar grid size are comparable, but when the square grid size is increased the resolution of the hot spot is also lost (e.g., the spatial resolution of hotspots for a grid size of 1 km, 2 km, and 4 km is dissimilar). As a result, we can say that GMI and Gi* investigations of HI values are scale dependent but are more robust with increasing DEM spatial resolution. The hot spots are spatially distributed along almost NE-SW–along the NE-SW oriented CF-system and adjoining regions. The CF and its plays are generally NE-SW and N-S oriented. In contrast, the general pattern of younger recent faults is being transformed from NE to the NW, cutting across the NE-trending older faults. The noticeable variation between the older NE-directing faults and the younger N to NW-trending features propose that a change in deformation style has occurred, from an preliminary stage of shortening to a more recent phase of shearing and NW-directed crustal extrusion along strike-slip fault zones. The style of broad deformation is consistent as found in the slope and topographic surface maps as well (Figures 8 and 9.)The global Moran index (GMI) statistics demonstrate that the HI-values are spatially auto-correlated and show high positive z-scores. As the investigation grid becomes coarser for the similar DEM, the z-scores reduce; indicating that the spatially disseminated autocorrelation patterns are dependent on scale.DEM spatial resolution also influences the z-scores. For SRTM data, z-scores are reduced in contrary to values from GDEM data; though, these changes are small.
Conclusions
Chaman fault is a seismically active fault running over 850km in western region of Pakistan and Afghanistan. We calculated values of hypsometric integral using SRTM DEM with 90m spatial resolution in active region of Chaman Fault (CF) and in its locality. The results show that the northern region of Chaman fault indicates slip rates ranging from 5.2-18.1mm per year.
The results depend upon the techniques and methods applied on Chaman fault. We calculated values of hypsometric integral using SRTM DEM with 90m spatial resolution in active region of Chaman Fault (CF) and in its locality. High and low HI values and global Moran’s Index are tools used to evaluate geomorphic structures of Chaman fault and its vicinity. These tools identify and calculate the spatial patterns in datasets.
References
- Apel, E.R., Burgmann, P., Bannerjee, and B. Nagarajan, 2006, “Geodetically constrained Indian plate motion and implications for plate boundary deformation”, in American Geophysical Union, Fall Meeting 2006.
- Abdullah, S., and V.M. Chmyriov, Map of mineral resources of Afghanistan: Ministry of Mines and Industries of the Democratic Republic of Afghanistan, Department of Geological and Mineral Survey, 1977.
- Amrhein, C., and H. Reynolds, “Using the Getis statistic to explore method aggregation effects in metropolitan Toronto census data”, Canadian Geographer, Vol 41, issue 2, pp : 137-149, 1997.
- Andermann, C., and R. Gloaguen, “Estimation of erosion in tectonically active orogenies.Example from the Bhotekoshi catchment, Himalaya (Nepal)”, International Journal of Remote Sensing, Vol 30, issue 12, pp; 3075-3096, 2009.
- Anselin, L., “Local indicators of spatial association-LISA”, Geographical Analysis, Vol 27, issue 2, pp: 93-115, 1995.
- Bannert, D., Cheema, A, and A. Ahmad, “The geology of the Western Fold Felt: Structural interpretation of the Landsat-MSS Satellite Imagery”. Hannover: Federal Institute of Geosciences and Natural Resources, 1992.
- Blanchard, S.D., Rogan, J., and D.W. Woodcock, “Geomorphic Change Analysis Using ASTER and SRTM Digital Elevation Models in Central Massachusetts, USA”, GIScience and Remote Sensing, Vol 47, issue 1, pp: 1-24, 2010.
- Burtman, V., and P. Molnar, Geological and geophysical evidence for deep subduction of continental crust beneath the Pamir, Special Paper Geological Society of America, Vol 281, pp: 82, 1993.
- Calkins, J., Jamiluudin, S., Bhuyan, K., and A.Hussain, “Geology and mineral resources of the chitral partsan area, hindukush range, northern Pakistan”, United States Geological Survey Paper, Vol 33, pp: 716, 1981.
- Chen, Y.C., Sung, Q. and K.Y. Cheng, “Along-strike variations of morphotectonics features in the Western Foothills of Taiwan: Tectonic implications based on stream-gradient and hypsometric analysis”, Geomorphology, Vol 56, issue 1-2, pp: 109-137, 2003.
- Chou, Y., Exploring Spatial Anaylsis in Geographic information systems. Santa Fe: Onward Press, pp: 474, 1997.
- Cliff, A. and J.K. Ord, Spatial processes, models and applications. London: Pion Ltd., pp: 260, 1981.
- Doebrich, J.L., and R.R.Wahl, Geological and mineral resources map of Afghanistan, version 1, compiled by USGS, 2006.
- Dewey, J., “The tectonic evolution of the india-eurasia collision zone”, Eclogae Geologicae Helveticae, Vol 82, issue 3, pp: 717-734, 1989.
- Diniz-Filho, J. A. F., Bini, L. M. and Hawkins, B. A., “Spatial autocorrelation and red herrings in geographical ecology”, Global Ecology and Biogeography, Vol 12, issue 1, pp: 53-64, 2003.
- Gansser, A., Geology of the Himalayas, New York: Interscience, 1964.
- Getis, A., and K. Ord, “Local spatial statistics: An overview”, in Spatial Analysis: Modelling in a GIS Environment, Cambridge: GeoInf. Int., pp: 261-277, 1996.
- Gloaguen, R., Marpu, P. R., and I. Niemeyer, “Automatic extraction of faults and fractal analysis from remote sensing data”, Nonlinear Processes in Geophysics, Vol 14, pp: 131-138, 2007.
- Haining, R., Spatial data analysis in the social and environmental sciences.Cambridge: Cambridge university press., pp: 410, 1990.
- Hildebrand, P.R., Searle, M.P., Shakirullah, Z. A. K., and H.J. van Heijst, “Geological evolution of the Hindu Kush, NW Pakistan: Active margin to continent-continent collision zone”, in Tectonics of the Nanga Parbat syntaxis and the western Himalaya, Geological Society, London, Special Publications Vol 170, pp: 277–293, 2000.
- Humayon, M., Lillie, R.J. and Lawrence, R.D., “Structural interpretation of eastern Sulaiman foldbelt and foredeep, Pakistan”, Tectonics, Vol 10, issue 2, pp: 299-324, 1991.
- Hildebrand, P.R., Noble, S.R., Searle, M.P., Waters, D. J., and R.R. Parrish, “Old origin for an active mountain range: Geology and geochronology of the eastern Hindu Kush, Pakistan”, Geological Society America Bulletin, Vol 113, issue 5, pp: 625-639, 2001.


