
Active Surface deformation from DEM Based Surface Dynamics in Upstream of Mangla Reservoir and eastern Potwar Plateau
Rao Mansoor Ali Khan1, Azam Sohail1, Syeda Areeba Gillani1, Syed Shehzad Hassan1, Syed Amer Mahmood1
1 Department of Space Science University of the Punjab Lahore.
* Correspondence: Rao Mansoor Ali Khan: raomansor@gmail.com
Citation | Khan.R.M.A, Sohail.A, Gillani.S.A, Hassan.S.S, Mahmood.S.A “Active Surface deformation from DEM Based Surface Dynamics in Upstream of Mangla Reservoir and eastern Potwar Plateau” International Journal of Innovations in Science and Technology Vol 02 Issue 02: pp 51-60, 2020.
Received |May, 15 2020; Revised | June 01, 2020; Accepted | June 12, 2020; Published | June 14, 2020.
________________________________________________________________________
Digital Elevation Model (DEM) acquired by Shutter Radar Topographic Mission (SRTM) is useful to compute Surface Dynamics (SDs) including, Drainage Density (DD), Topographic Relative Relief (TRR), Iso Base-Levels (IBL) and Topographic Vertical Dissection (TVD). It provides detailed information about the lithology based on erosional boundaries as well as delineation of active tectonic scarps. It confers a well-built connection among diverse stream Strahler ordering and the localized erosive or neotectonics conditions in an actively deforming topography. These techniques are rapid, proficient, and consistent to demarcate tectonic control even along or over the similar lithologies. This investigation appraises the eroding and uplifting landforms along upstream of Mangla reservoir in lower Jhelum valley. The aim is to delineate margins for lithological demarcation and to distinguish whether these are affected by neotectonics or not. We noticed unusual local-base-level inconsistency that may be related to the well-known active tectonic expressions.
Keywords: SRTM DEM, Surface dynamics, local base level, drainage density, topographic relative relief, topographic vertical dissection and Mangla reservoir.
1. Introduction.
The continental plates are pulverized with each other by head to head which are subducted and superseded e.g. Indian plate has been subducted by Eurasian plate therefore, it is broken from various points which are called the fault zones [1]. A pressure is induced underneath these plates due to which the rocks are twisted, pressed, or elongated. The strain underneath these rock units enhances and a point comes beyond which these plates get burst and spread [2]. This discharge of energy is impulsive in nature which trigger the seismic waves to move in all directions from the epicenter [3]. The result of these scenarios is lethal which cause massive earthquakes, landslides, continental rifting, active faulting, and devastating tsunamis [4]. The Topographic Relative Relief (TRR) has become a significant issue for man-oriented environment. The TRR and cartograph are in inverse relation to physical science relating to earth’s surface.
The utilization of Digital Elevation Model (DEM) in various fields of life has motivated researchers to visualize mountainous topography in 3D to determine attitudinal variations [5]. GIS based datasets along with earth surveillance data is widely used in investigation of geomorphometric indices [6]. These investigations have resulted in modeling of terrain geologically and hydrologically.
Morphometry is a term used for investigation of topography based on arithmetic measurements of landforms [7]. These indices are capable of investigating the TRR characteristics of a region [8]. Lower Jhelum valley is comprised of topography with changing elevations, dimensions, magnitudes, and scales. The estimation of topography relief requires the detailed information of slope and aspect.
The main objective of this research was to investigate study site using seven surface indices including Topography Slope (TS), Drainage Density (DD), Topography Aspect (TA), Topography Vertical Direction (TVD), Iso Base Level (IBL), Hack Gradient index (HGI) and Topographic Relative Relief (TRR). The Satellite Remote Sensing (SRS) and GIS built-in procedures are capable to evaluate the above mentioned seven indices using DEM. Therefore, the basic input was the acquisition of high resolution, dipressionless DEM which is geometrically accurate.
Study Site:
Potwar plateau is situated at a latitude 33-34N and at 73-74E longitude, having surprising topography. The study site has its topographic importance due to Main Boundary Thrust (MBT) in the NW and NE direction [9]. Some unique structures e.g., Risai and Kotli thrust is located in SE-NW direction and the Jehlum fault is oriented in the same fashion. Rawat thrust is in SE-NE direction which expresses various surface deformation styles existing over or beneath the surface [10]. The test site is a deformed part of western Himalayan fold mentioned in Figure 1, having Neogene deformations surged in south to salt range thrust, in comparison to MBT. The lineaments and outcrop trends are roughly at right angle to the movements of tectonic structures, having average shortening of 16mm/year [11]. Figure 1 (b) is showing the location of study area with earthquakes locations in red and thick 273 black lines represent thrust faulting with teeth symbols showing direction 274 of thrust movements.
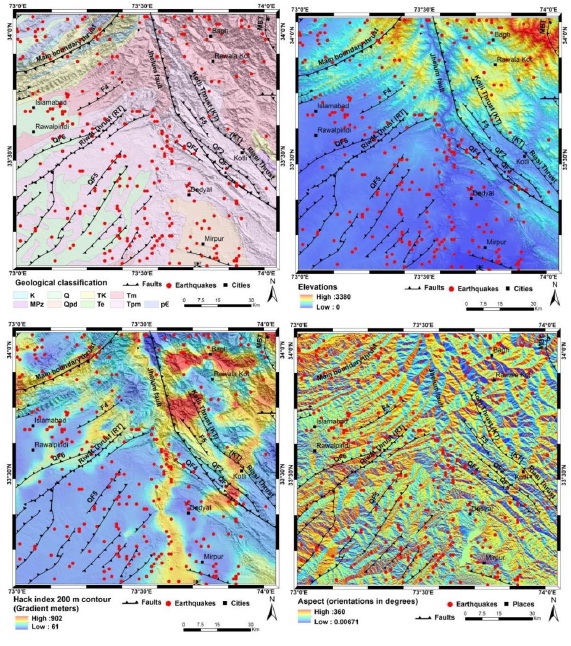
Figure 1. (a) Geology Map, (b) Investigation Site, (c) Hack Gradient message and (d) Aspect map.
Materials and Methods:
SRTM DEM is freely available for downloading from Global Land Cover Facility (GLCF) in Tagged Information File Format (TIFF) with 30m resolution. The study site was analyzed for various indices including HGI, TA, TS, TVD, IBL, DD and TRR and examined the geometric grids for each procedure. The slope gradient algorithm (SGA) expresses high correlations for formulation of dissimilar results. The SGA along with aspect map provides raw values to be used in eigenvector algorithm, therefore the SGA may affect the final output. [10] introduced Steepest Adjacent Neighborhood Algorithm (SANA), however the four nearest neighborhood algorithm (FNNA) is most authentic and widely used algorithm according to [11]. The eight-neighborhood algorithm was introduced by EVANS [12]. A dissimilarity between FNNA and SANA explore the impacts of SANA on geomorphometric factors. Slope of topography was computed using eight-neighborhood algorithm. SANA was employed to compute singular solitary and slope values at the mid location [13]. The illustration of Iso base and TVD mechanism is shown in Figure 2,
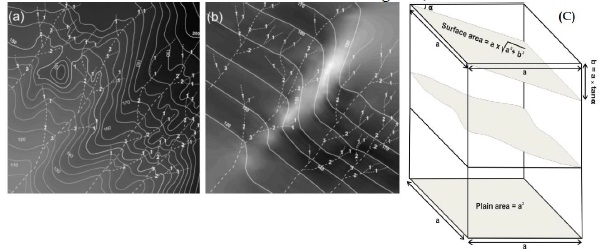
Figure 2. (a,b) Illustration of Iso base and (c) TVD mechanism.
Results and discussion:
The geomorphometric indices which were analyzed includes Iso base level (IBL), Drainage Density (DD), Topography Vertical Direction (TVD), and Topographic Relative Relief (TRR). These indices are capable to isolate landforms into a number of morphometric units to evaluate the hydrologic environments and subcategories of landforms. The geographic and spatial distribution of study site is explained below.
The IBL were obtained from 2nd or 3rd Strahler order coding and the results are mapped in Figure 3.
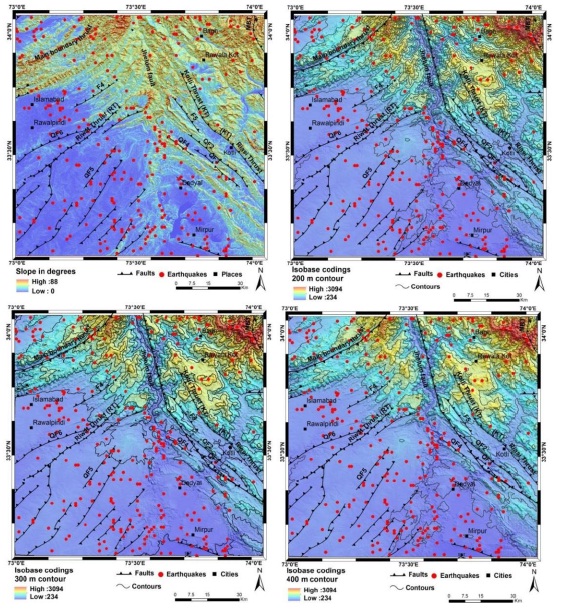
Figure 3. (a) Slope map showing slope variation in degree while red showing steep slopes and cyan region with less gentle slopes, (d) Slope map showing various Isobase maps with isobase contour lines with a spatial interval of 200 m, 300 m and 400 m.
The lineaments were extracted using SRTM DEM. The NNW-SE and NE-SW directed fault lines are directly linked with configuration of study area as shown in Figure 1. The Eastward orientation of Iso-base level lines directed in NE-NNW direction over inflexion of Nelum and Jehlum rivers. It was identified that the SW and NE orientation of IBL lines transvers to NW-SE of iso-base lines and Kotli and Riasi faults were identified.
Drainage density (DD)
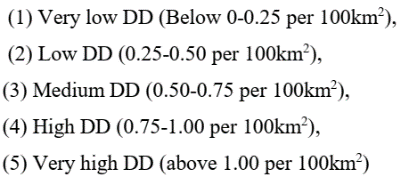
Drainage density (DD) was computed by taking stream length per channel per hundred square kilometer area. DD can be influenced by various factors e.g., climate, geology/lithology and soil types [9]. DD is further subdivided in five different classes as below in Figure 4
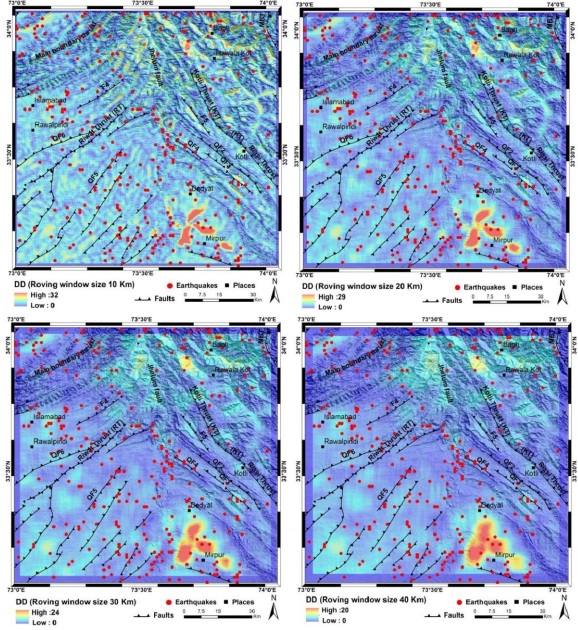
Figure 4. Drainage density maps extracted from SRTM DEM with variable spatial roving window sizes of 10, 20, 30 and 40 m
Almost 50% of study area was found under intermediate DD, which may be due to presences of majority of hard rocks and less uplift rates with less erosion. The DD is further classified into following classes
Topographic Relative Relief (TRR)
The TRR is related to variations in height over a specified area covering one ridge and one valley. The computation of TRR is considered efficient due to its uniqueness for representation of a surface without considering the Absolute Sea Level (ASL). TRR is a function of height above the sea level, however there is a difference between local and altitudinal TRR. The TRR is further distributed in low, moderate, high and very TRRs as below in Figure 5,
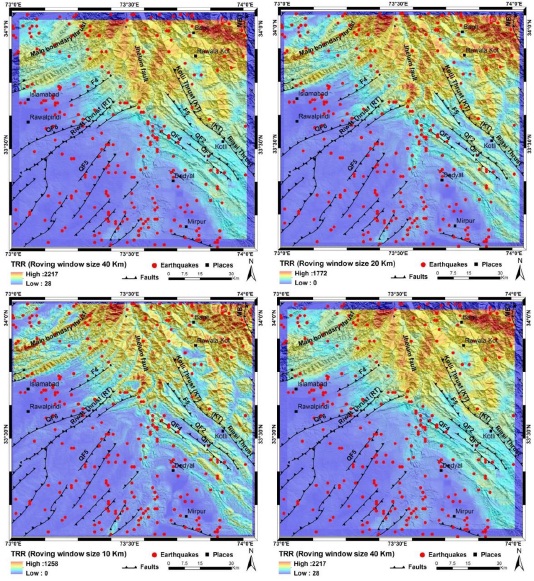
Figure 5. Topographic relative relief maps of investigation site with variable roving widow sizes.
Low TRR (Bluish Color)
The TRR map represents the inconsistency in the investigation site which cover only 20-25% of total area. In our case it engages lower valley slopes of study site.
Moderate TRR (Cyanic Color)
This kind of TRR covered about 25-30% area of study site. This area included ridges above and below the RT and KT, lower part of Jhelum, Riwat thrust and some areas of Main Boundary Thrust representing the gentle slopes of study site.
High TRR (Orange Color)
The category of TRR covered 30-35% in term of area of the study site. This group of TRR covered NW, eastern and northern side of investigation site which covered high uplift rates. The sites are around RT, KT, MBT and the Jhelum Fault.
Very TRR (Reddish Color)
This TRR covered 15-20% area of the study site. This type of TRR covered the upper reaches of Mangla catchment and the upper part of Hazara Kashmir Syntaxis (HKS). The footprints of this TRR were observed in the area of Bagh, Upper MBT, Upper Jehlum Fault, Bagh and Tawlakot as shown in Figure 5. This category of TRR falls in region of erosional/Tectonic scarps having very steepy slopes.
Topographic Vertical Dissection (TVD)
TVD describes, how a valley is dissected and advanced by erosional process in vertical direction. It was related to the slope variations in degrees, relative relief gradients as shown in Figure 6. The TVD map describes inhomogeneous spatially distributed bands of lower and higher values of TVD which relates to unraveling low and high dissection areas. Finally, the higher values of TVD are considered as recent uplift scenarios along KT, RT, MBT, Riwat Thrust and upper Jhelum Fault Figure 6. The higher values of TVD indicate the existence of lineaments in excess which represents that the topography is in youth and continuously uplifting due to neotectonics in the study site. Lower values of TVD were found in SE and SSE parts of intermountain watershed having fresh and active deposits and sedimentations. The high values of TVD were found in upper-central and Northern, NW and NE sides of study site which represent the existence of neotectonics in the study site.
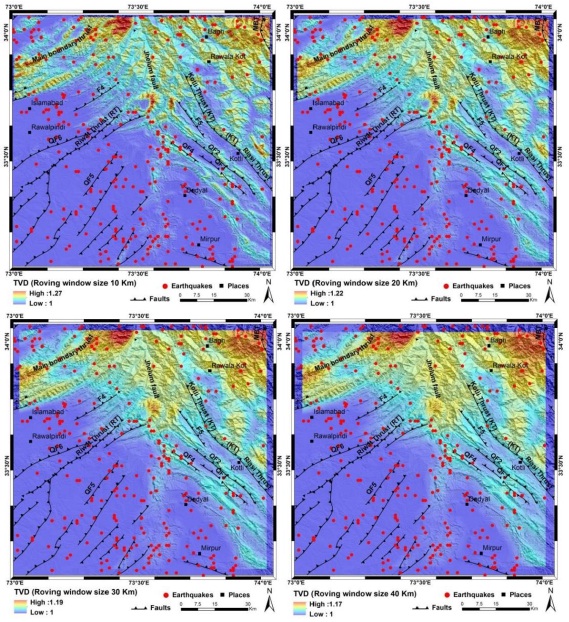
Figure 6. TVD maps for the study area with variable roving window size of 10, 20, 30 and 40Km.
Conclusions
The automated surface dynamic analysis performed using SRTM DEM which reveals that TRR characterizes spatially distributed topographic patterns and active structures within an investigation site. The TRR represents irregular disseminations, which relates to the existence of neotectonics in the study site. Lower values of TVD were in the SW of the study site. The highest values of TVD represent the instable landscape/topography present in N, NE, NW parts of study site. Various factors control drainage density e.g., climatic episodes, lithology, and topsoil permeability. The Iso Base Level map is efficient to demonstrate the active tectonic scraps and types of faults. Higher values of IBL were found in NE and in Northern part of investigation site which indicates that the topography was younger or evolving. Finally, it is recommended that the outcomes can be used in evaluation of physical topographic examination, hydrology, tectonic geomorphology, environment, and ecology related management of study site.
REFERENCES
1. Golts, S. & E. Rosenthal, E. A morphotectonic map of the northern Arava in Israel derived form is obase lines. Geomorphology, 1993. 7: 305-315 (1993).
2. Grohmann, C.H., C. Riccomini, & F.M. Alves. SRTM-based morphotectonic analysis of the Po\\c cos de Caldas Alkaline Massif, southeastern Brazil, Computers & Geosciences. 33(1) :10-19 (2007).
3. Garrote,J., G.G.Heydt, & R.T.Cox. Multi-stream order analyses in basin asymmetry: A tool to discriminate the influence of neotectonics in fluvial landscape development (Madrid basin,central Spain). Geomorphology. 102 :130 -144 (2008).
4. Filosofov, V. Brief guide to morphometric methods in search of tectonic structures. Saratov: Saratov University Public House (1960). (Russian language).
5. Pennock, E., R.J. Lillie, A. Zaman, & M.Yousaf. Structural Interpretation of Seismic Reflection Data from the Eastern Salt Range and Potwar Plateau. Pakistan, Bull. Amer Assoc.Petrol. Geol.73(7) : 841-857(1989).
6. Lillie, R.J., G.D.Johnson, M. Yousaf, A.S.H. Zamin, & R.S. Yeats. Structural Development within the Himalayan Foreland Fold-And-Thrust Belt of Pakistan. Beaumont & Tankard (eds.) Sedimentary basins and basin forming mechanisms. Can Soc. Petro. Geol., Memoir. 73(7): 379-382 (1987).9
7. Mahmood, S. A. & R. Gloguen. Analysing spatial autocorrelation for hypsometric integral to discriminate neotectonics and lithologies using DEMs and GIS. GIScience and remote sensing.48(4): 541-565 (2011).
8. Strahler, A. N. Hypsometric (area-altitude) analysis of erosional topography, Geol. Soc. Am.Bull. 63(11): 1117 – 1142 (1952).
9. Grohmann, C.H., C. Riccomini, & M.A.C. Chamani. Regional scale analysis of landform configuration with base-level (isobase) maps. Hydrology and earth system sciences.15: 1493-1504 (2011).
10. Stewart, I. & P. Hannock. What is a fault scarp? Episodes,61: 256–263 (1990).
11. Zuchiewicz, W. & R. Oaks. Geomorphology and structure of the Bear River Range, north eastern Utah: a morphometric approach, Z. Geomorphol., Suppl.-Bd. 94: 41–55 (1993).
12. Sant’Anna, L. G., H.D Schorscher. & C. Riccomini. Cenozoic tectonics of the Fonseca Basin region, eastern Quadril´ateroFerr´ıfero, MG, Brazil, J. S. Am. Earth Sci. 10:275–284 (1997).
13. Mahmood, S. A., S. Siddiqui, V. Liesenberg, R. Gloguen, & M. Rahnama. DEM based analysis of active deformation in Hindukush using river profiles, surface dynamics and polynomial trend surfaces, (in review) Geomorphology, 2012.


