
Additions of Tropospheric Ozone (O3) in Regional Climates (A case study: Saudi Arabia)
Syed Shehzad Hassan1, Maham Mukhtar3, Ehsan ul Haq2, Muneeb Aamir2, Hafiz M Rafique1, Ali Kamran1, Ghulam Shah2, Safeer Ali2 and Syed Amer Mahmood2.
1 Department of Physics, University of the Punjab Lahore.
2 Remote Sensing group Department of Space Science University of the Punjab Lahore Punjab Pakistan.
3 Institute of Management Science (Pak AIMS) Lahore.
*Correspondence | Syed Shehzad Hassan, sshm.mesp72@gmail.com Department of Physics, University of the Punjab Lahore Pakistan.
Citation | Hassan.S.S, Mukhtar.M, Haq.U.E, Aamir.A, Rafique.M.H, Kamran.A, Shah.G, Ali.S and Mahmood S.A“Additions of Tropospheric Ozone (O3) in Regional Climates (A case study: Saudi Arabia)”. International Journal of Innovations in Science and Technology, Vol 01 Issue 01: pp 33-46, 2019.
DOI | https://doi.org/10.33411/IJIST/2019010103
Received | Dec 15, 2018; Revised |Jan 27, 2019 Accepted | Jan 28, 2019; Published | Jan 30, 2019.__________________________________________________________________
ABSTRACT
Anthropogenic activities are responsible for enhancing the concentration of various toxic gases that produces bad Ozone in the troposphere which is harmful to human health. The specific objective of this research was to analyze the spatiotemporal variations in a vertical column of Ozone (O3) over Saudi Arabia during 2006-2016 using Atmospheric Infrared Sounder (AIRS) onboard AQUA platform and AErosol RObotic NETwork (AERONET) data. The results show that the optical depth of Ozone column varied from 252 Dobson Units (DU) to 264 DU. The main reason of this variation corresponds to the increase in O3 precursors including Carbon Dioxide (CO2), Nitrogen Dioxide (NO2) and Sulfur Dioxide (SO2). The concentration of CO2 varied between (379-401) Parts Per Million (PPM), SO2 varied (3.5x10⁻⁶ - 4x10⁻⁶kg m-2) kg m-2 and NO2 varies (2.25x10¹⁵ - 2.5x10¹⁵)1/cm2 during the investigated timeframe. The results confirm that NO2 and SO2 have contributed directly in O3 formation while CO2 just increased regional temperatures that enhanced the optical depth of O3.
Keywords: AIRS, AERONET, Carbon dioxide, Nitrogen dioxide, Sulfur dioxide, Aerosol optical depth and Dopson Unit.
1. Introduction:
Ozone is the allotropic form of Oxygen [1]which contributes only 0.6 PPM to the atmospheric composition [2]. Over the last few decades, anthropogenic activities have changed the chemical composition of our atmosphere that influenced the earth’s climate by increasing the Ozone level in the troposphere. Two fundamental activities responsible for an increment of Ozone concentration in the atmosphere includes the oxidation of Volatile Organic Compounds (VOCs) and the addition of Non-Methane Hydrocarbons (NMHCs) [3]that resulted in the transportation of Ozone from stratosphere toward troposphere. VOCs are controlled and catalyzed by oxides of nitrogen, carbon and sulfurs. Nitrogen oxides (NOx), Carbon oxides (COx) and Sulfur oxides (SOx) are formed by the direct combustion of hydrocarbons, volcanic eruptions and biomass burning [4]. Nitrogen oxides affect the tropospheric O3 because of photochemical reactions [5]. Coal burning in industries and electrical power generators contribute mainly to the production of nitrogen oxides. Therefore, the regions having coal burning plants may be a cause of the increase in Ozone level [6, 1, 2]. Spatiotemporal variations in Ozone vertical column have been analyzed by many researchers [4, 7], they pointed out various sources including hydrocarbon engines, aircrafts and volcanic eruptions responsible for an increment of O3 in atmosphere. The chemical compounds involved in Ozone formation include carbon monoxide, VOCs and water vapors [8]. The possible reaction of Ozone formation is given below: •OH + CO → •HOCO •HOCO + O2 → HO2• + CO2 Per-Oxy radicals react with nitrogen oxide (NO) to give NO2, which gives atomic oxygen and nitrogen mono oxide through the phenomenon of photolysis [9]. Radicals of oxygen formed by this process finally convert into Ozone as given below: HO2• + NO → •OH + NO2 NO2 + hν → NO + O(3P) O(3P) + O2 → O3 The balance of this chemical reactions is as below, CO + 2O2 + hν → CO2 + O3 [10] The above discussion verifies that tropospheric ozone is formed by photochemistry of toxic pollutants in the atmosphere. Summer season is proved favorable by many researchers [11, 10, 9] due to high temperatures. The elevated temperature act as catalyst in all chemical reactions like oxidation or reduction of VOCs, hydrocarbons, and the oxides of nitrogen, carbon and Sulphur which are commonly known as Ozone precursors. These oxides play a vital role in bad ozone formation through complex chemical reactions. Therefore, it is significant to investigate the participation of ozone precursors in formation of O3. The optimum range of these precursors is important to determine for making our environment healthy, clean and green. The specific objectives of this research were to delineate the spatiotemporal variations in O3 concentration from 2006 to 2016 over Saudi Arabia. It also aims at describing the contribution of ozone precursors in O3 formation by direct or indirect chemical reactions. This research will open new avenues for scientists and researchers to control various toxic gasses for a sustainable regional environment.
2. Material and Methods.
Study area.
Saudi Arabia (23.88590 N, 45.07920 E) is situated in the middle east. It is bordered by Yemen, Iraq, Jordan, Oman, Qatar and UAE. Saudi Arabia is a peninsula that is generally described as the region of the desert which receives less rainfall and remain hot throughout the year, while some areas near to the sea are relatively cold [12]. Rain is most likely to fall in February to April in Riyadh, and December to March in eastern Saudi Arabia. In the mountainous zone, average rain fall is recorded more than 15 inches (50 centimeters) annually. It has an arid and hot climate with harsh weather conditions that sometimes shoot up to 520 C at noon in summer season while descends by 00 C in the night. The spatial extent of the study site is mapped in Figure 1
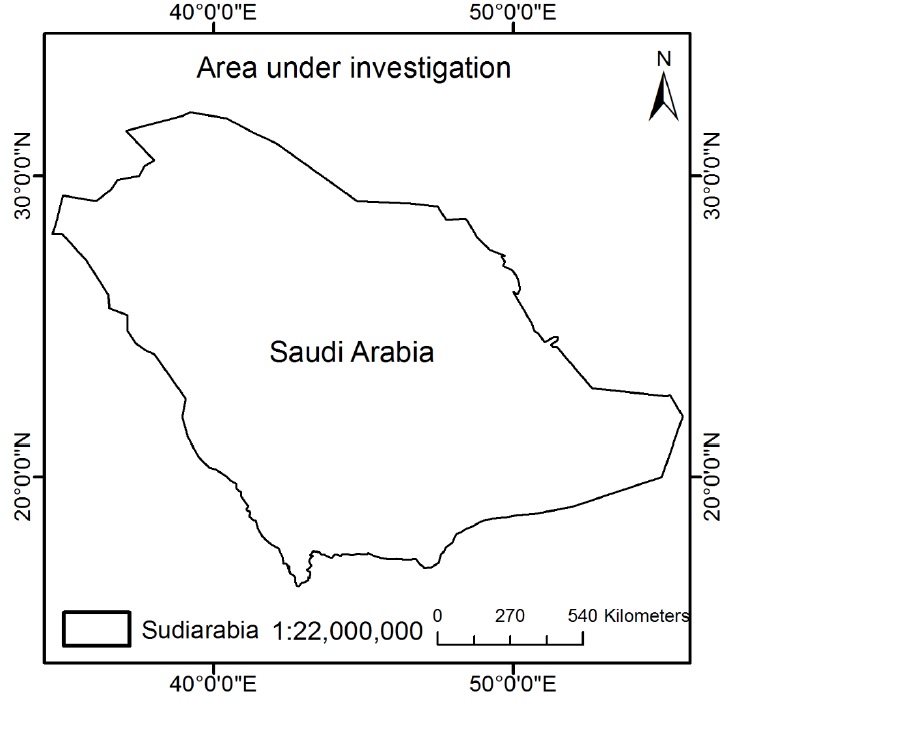
. Figure 1. Study site.Most of industrial expansion occurred during 2000-2016 in Saudi Arabia to boost its economy. The increasing GDP reveals the activism of oil refineries, electrical power plants and coal burning chambers which participated directly or indirectly in O3 production [13]. We obtained the AErosol RObotic NETwork (AERONET) and Atmospheric InfraRed Sounder (AIRS) data from GIOVAANI to map the temporal changes in O3. Methods. AERONET data. The AERONET is a constellation of instruments administered by NASA (Hoben et al., 1998) to establish a balance between atmospheric gasses. AERONET provides valuable information regarding aerosol concentration, their physical properties along with their movement. The AERONET data is available at basic three processing levels: level 1 is under screened: level 1.5 is cloud screened and level 2 is quality assured. The spectral ranges defined for measuring the sky and sun radiances are 340-1020 nm and 440-1020 nm respectively [14]. Aerosol optical depth can be computed by direct sun radiance however, refractive index, scattering albedo and asymmetry parameters can be computed by sky radiance.
We used AERONET data to evaluate the variations in ozone concentration and its optical depth in Dopson Unit (DU) as mentioned below in Table 1
Table 1. Ozone concentration in DU from 2006-2016.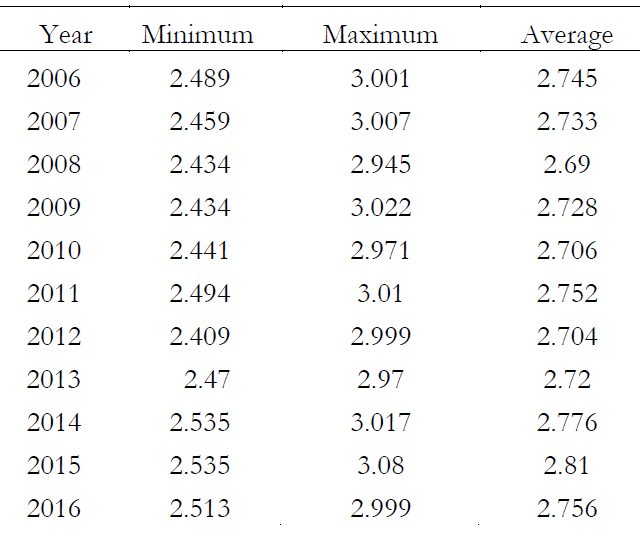
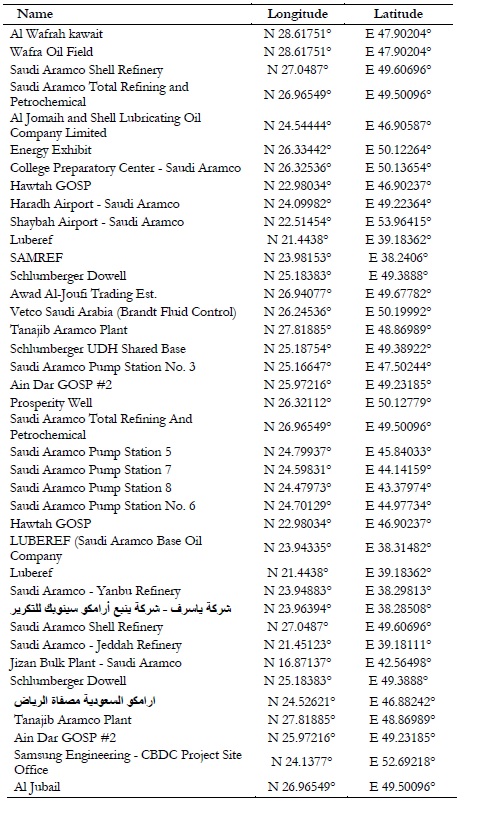
2.756 AIRS data. The AIRS is an instrument mounted on NASA’S aqua satellite launched on May 04, 2002. AIRS is designed to monitor the variations in concentration of atmospheric gases, air and surface temperature, cloud properties and water vapors. All these observations are taken through infrared technology. It also provides the interpolated spatial patterns for all the gases existing in our atmosphere. We downloaded time series datasets as recorded by AIRS instrument from GIOVANNI website to study spatiotemporal variations in Ozone concentration with a spatial resolution of 10 (~110km) over the investigation site (Figure 1). The data was acquired only for day timings because the industries produce maximum toxic gases in sunshine hours. Another advantage of data collection for the same hours, was the sharp variations in day-night temperatures due to sandy texture. High temperature leads to big concentration of Ozone in troposphere [9]. Spatial interpolation techniques [15] are commonly used to plot temporal trends of Ozone fluctuations [16]. The time series graphs of Ozone precursors are compared with graphical variations of toxic gasses to determine similarities and dissimilarities obtained in both graphical and interpolated results that give true representation of our environment [12]. These precursors emit oxides of the Carbon (COx), Nitrogen (NOx) and Sulfur (SOx) [17] along with VOCs [18]. The oxidation of precursors in presence of sunlight causes formation, transportation [19] and dilution of Ozone in the atmosphere [12]. The main sources of Ozone precursors are petrol pumps, industries, the residual smoke from factories, automobile emissions, water desalination plants and gas-based power stations. The spatial distribution of these plants is listed in the Table 2 as below.
Table 2. Spatial locations of Ozone production plants.
Regression is a set of statistical processes for estimating the relationship among variables [20]. We used the linear regression to determine the contribution of each pollutant in formation of bad Ozone over Saudi Arabia for the investigated period.
1. Results.
Spatiotemporal variations in Ozone vertical column are mapped in Figure 2 which shows that North west of Saudi Arabia is completely occupied by bad ozone in comparison to south east. The concentration of the Ozone was observed maximum at spatial location (330 N and 400 E) in all the maps of Figure 2 and minimum at (200 N and 500 E). The highest value of bad ozone was recorded as 300DU in comparison to the lowest as 244 DU. Red zones in Figure 2 were found with large number of anthropogenic activities. About 79% of industries, power plants and oil refineries mentioned in Table 2 were actually existing in the North west of Saudi Arabia that mainly contributed in formation of bad ozone. While, the blue areas in Figure 2 were found comparatively less polluted. The trend shows that the spatial extent of red and orange zones is increasing speedily toward south which is very alarming situation.
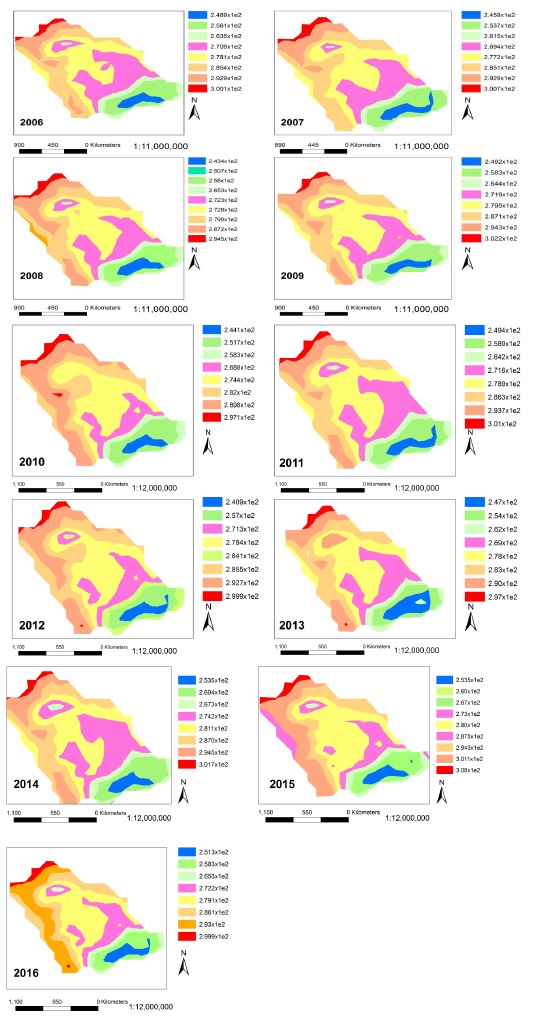
Figure 2: Spatiotemporal variations in Ozone vertical column with spatial resolution of 1 deg from 2006 –2016 over Saudi Arabia
5.1 Concentration of toxic gasses in comparison to GDP of Saudi Arabia.
AERONET data provided us annual variations in the concentration of toxic gasses (CO2, SO2 and NO2) emitted by combustion chambers of industries existing in Saudi Arabia as mentioned in Table 3. These pollutants were found responsible for O3 formation by chemical reaction. Industrial activism is a term used for the regions where GDP is increased rapidly. We collected the annual increment in GDP of Saudi Arabia from World Bank as mentioned in Table 3.
Table 3. Annual variations in concentration of toxic gases against GDP and O3.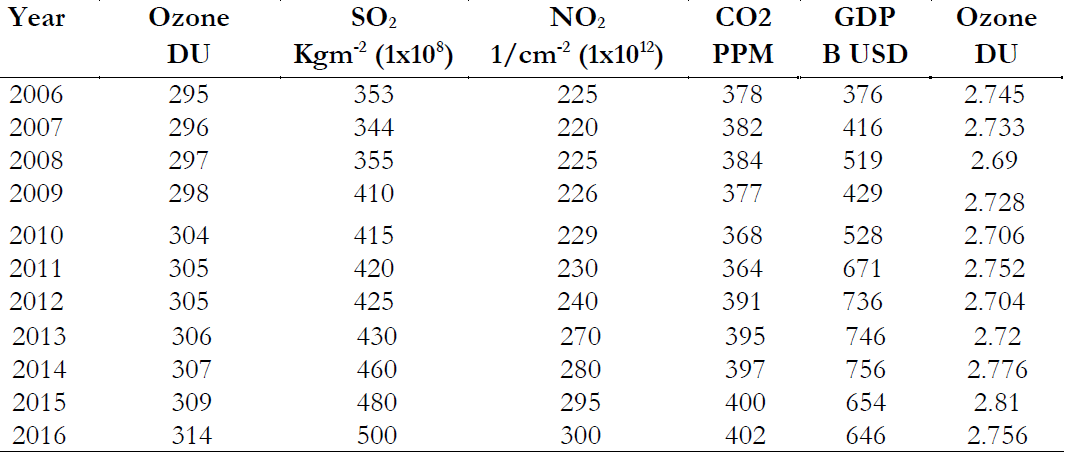
2.756 These variations are plotted as below in Figure 3. Figure 3. Variations in CO2, SO2, NO2, O3 and GDP during 2006-2016.
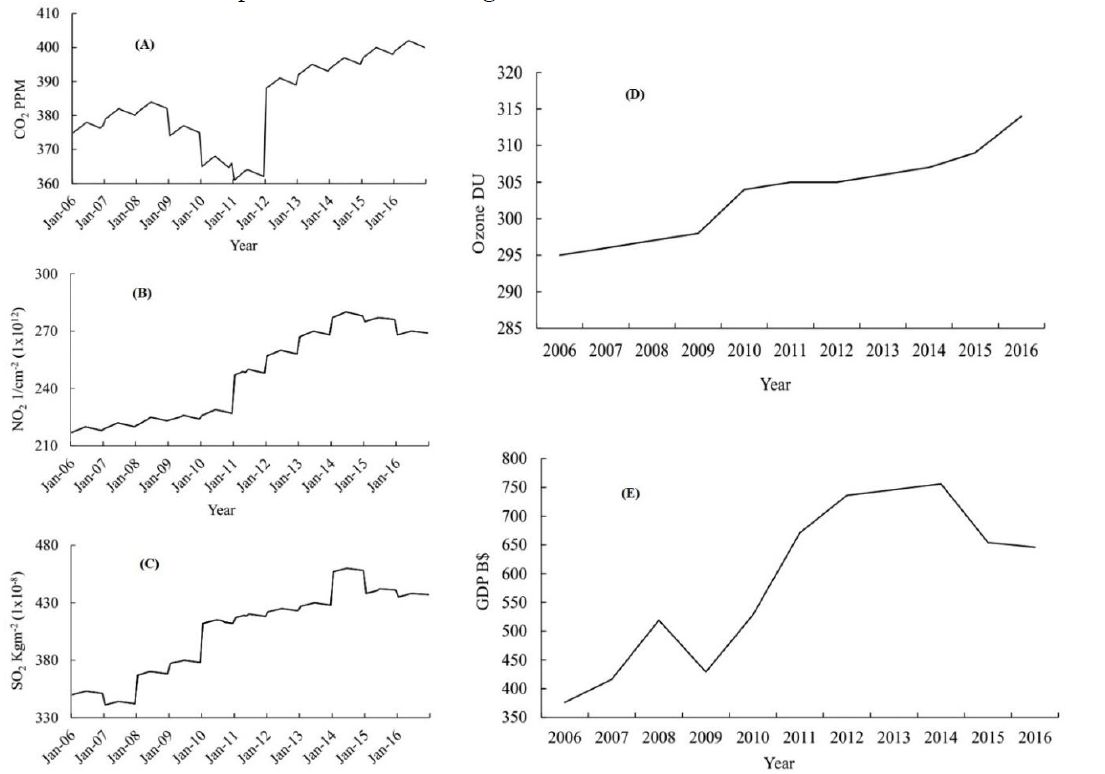
Figure 3(A) is showing an increasing trend for CO2 concentration that varied from 378 PPM in 2006 to 402 PPM in 2016. This increased level of CO2 created a natural greenhouse effect resulting in increment to regional temperatures. Figure 3(B) determines that the highest value of NO2 was recorded in the year 2014 in comparison to 2006. The concentration of Nitrogen oxide was recorded as 2.25x10¹⁵ 1/cm2 in 2006 that increased to 3 x10¹⁵ 1/cm2 in 2016. Sunlight dissociates nitrogen dioxide into nitric oxide and oxygen atoms as follows
,
NO2 + Sunlight NO + O
A single atom of oxygen combines with the oxygen molecule to give Ozone as below,
O + O2 O3Similarly, SO2 is showing the same trend in Figure 3(C) as NO2 in Figure 3(B). SO2 reacts with ultraviolet light and produces an Ozone precursor (O). Variations in SO2 were observed in mole fraction that varied from 3.5x10⁻⁶ kg m-2 in 2006 to 4x10⁻⁶kg m-2 in 2016. Possible reactions of Sulphur that
contributes in Ozone formation are given below,
SO2 + hv = SO + O
SO + O2 = SO2 + O
(O + O2 = O3)
3O2 = 2O3
Figure 3(D) is showing that the concentration of O3 is continuously increasing in the troposphere due to oxidation of ozone precursors. We applied a linear regression model to determine the relationship between Ozone and the GDP. We found a strong relationship between these two variables with R2=0.858 as shown in Figure 4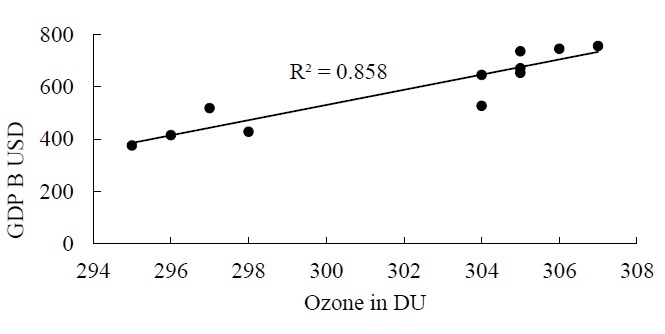
Figure 4. Linear regression applied to GDP (Billion USD) against Ozone concentration in DU.
The regression analysis applied in Figure 4 verifies that the industrial revolution in Saudi Arabia has not only increased the GDP but also a penalty of ozone precursors is being added in the troposphere by industries/oil refineries that produced harmful O3 in access through oxidation/reduction processes. Such ozone is harmful not only for humans but the whole ecological balance is disturbed badly.
We assumed three types of ozone precursors to evaluate the contribution of each precursor in O3 formation. To do so, a linear regression is applied to the concentration of NO2, SO2, CO2 against the GDP. As we have proved in Figure 4 that GDP and O3 are in direct relation with each other. The results of linear regression are mention in Figure 5 as below.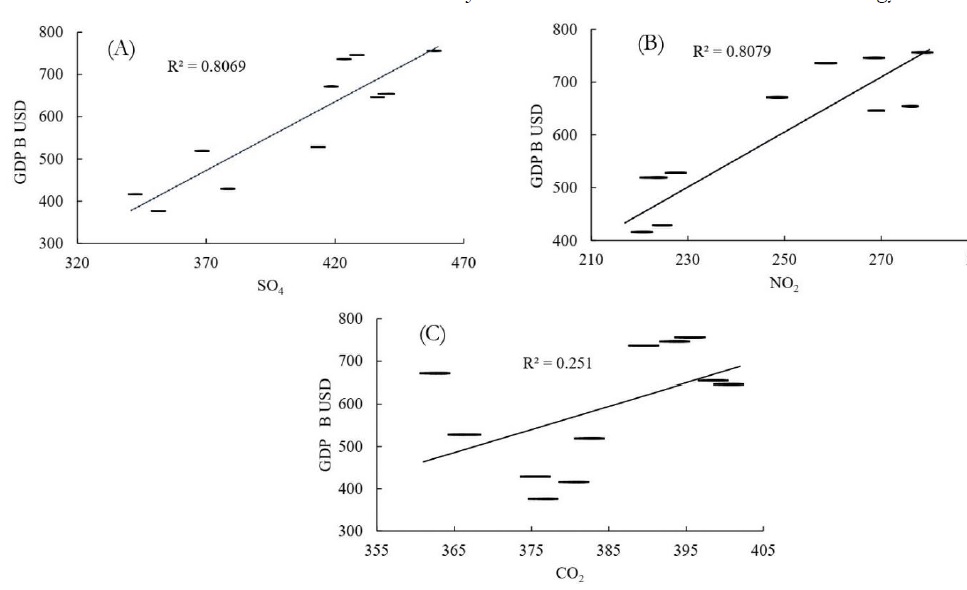
Figure 5. Linear regression applied to Ozone precursors (NO2, SO4 and CO2) against GDP.
Figure 5 (A,B) are showing fair relationship with coefficients of determination as 0.8069 and 0.8079 respectively which is a clear proof that SO4 and NO2 contributed directly in O3 formation. On the other hand, there exist a very weak relation between CO2 and GDP with R2=0.251 which indicates that CO2 did not contribute directly in O3 formation but it raised the regional temperatures and this elevated temperature catalyzed the oxidation of ozone precursors.
5. Discussion
Nitrogen dioxide and sulfur dioxide are the precursors of the Ozone, which decompose into their components in day timing in the presence of light and form Ozone by oxidation/reduction. These precursors were identified by environmental protection department of Saudi Arabia in collaboration with NASA. They found that the concentration of nitrogen dioxide and Sulphur dioxide is increased by 0.05% annually. These gases produced natural greenhouse effect by capturing thermal radiations that played a vital role in Ozone formation by making conducive environment for photolysis. Oil refineries, petrol pumps and water purification plants are the main sources of production of nitrogen dioxide and sulfur dioxide.
Sunlight act as catalyst in oxidation of Nitrogen and Sulphur which are detergents for ozone formation. Nitrogen is highly electronegative element with a lone pair after completion of its octet. This lone pair creates an effect of electrostatic interaction between partial positive and partial negative elements. Partial positive charge creates due to electro negativity difference between the bonding
molecules. Therefore, the coulomb’s interaction between partial positive and partial negative element weaken the nitrogen bond with oxygen. When sunlight hit this weak bond, the nitrogen dioxide dissociates into nitrogen mono oxide and oxygen radical. Oxygen radical interacts with the already existing oxygen molecule and produces Ozone.
The spatiotemporal variations in Ozone vertical column were observed due to enhanced nitrogen dioxide and sulfur dioxide in the atmosphere. It was observed that CO2 was not directly involved in Ozone formation. The spatial locations with elevated Ozone concentration were observed having elevated temperatures, which reveals that high temperature expedites the process of oxidation and reduction. The increase in Ozone concentration was recorded by 1.2% per year from 2006 to 2016.
7. Conclusion
There exists a global race to build regional economies through industrialization. This industrial revolution is responsible for addition of various toxic gasses in our environments which are dangerous for human survival and sustainable development. Therefore, efficient ways are required to handle these pollutants to save our environments for a green future.
8. Acknowledgement
We would like to acknowledge the profound services of NASA for providing reliable global data at Giovanni website (http://giovanni.gsfc.nasa.gov/).
8. References:
[1] Ryan D. McCulla, "Atomic Oxygen O(3P): Photogeneration and Reactions with Biomolecules.," ACS Chemistry for life, 2010.
[2] A. G. Streng, ""Tables of Ozone Properties".," Journal of Chemical Engineering Data., vol. 6, no. 3, p. 431–436., 1961. (Crossref)
[3] G. a. Tzanis, "Study of stratosphere-troposphere exchange events of Ozone in India and Greece using Ozonesonde ascent.," Meteorological applications, vol. 18, no. 4, pp. 467-474, 2011.
[4] Fishman et al., "Ozone in the boundary layer of the equatorial Atlantic Ocean," Tellus B, vol. 3, pp. 314-322, 1989.
[5] Vukovich, "A time dependant photochemical model of Ozone near the ground.," geophysical research, vol. 81, 1976.
[6] G. A., R. Shukla, S. Bhattacharya and V. Dadhwal, "Subregion (district) and sector level SO2 and NOx emissions for India: assessment of inventories and mitigation flexibility," Atmospheric Environment, vol. 35, pp. 703-713, 2001. (Crossref)
[7] L. Chan, L. H.Y., K. Lam and T. Wang, "Analysis of seasonal behavior of tropospheric Ozone at Hong Kong.," Atmospheric Environment, vol. 32, pp. 159-168, 1998. (Crossref)
[8] J. Stedman and M. Williams, "A trajectory model of the relationship between Ozone and precursor emissions.," Atmospheric Environment, Vols. 26A,, pp. 1271-1281, 1992. (Crossref)
[9] J. Allen, "Tango in the Atmosphere: Ozone and Climate Change," NASA Earth Observatory, 2004.
[10] J. R. Barker, Problems and Progress in Atmospheric Chemistry, vol. 3, Advanced Series in Physical Chemistry, Ed., Singapore: World Scientific, 1995.
[11] J. M. Prospero, P. Ginoux, O. Torres, S. E. Nicholson and T. E. E. Gill, "environmental characterization global sources of atmospheric soil dust identified with the Nimbus 7 total ozone mapping spectrometer (TOMS) absorbing aerosol product.," Rev. Geophys, vol. 40, p. 1002, 2002. (Crossref)
[12] J. H. Seinfeld and S. N. Pandis, Atmospheric Chemistry and Physics - From Air Pollution to Climate Change., Vols. ISBN 0-471-17816-0, John Wiley and Sons, 1998.
[13] C. R., G. R. and G. A., "Ultraviolet radiation and ground-level Ozone variation in Lithuania.," Journal of Environmental Engineering and Landscape Management, vol. 1, pp. 31-36, 2004.
[14] B. N. Holben, T. F. Eck, I. Slutsker, D. Tanré, J. P. Buis, A. Setzer, E. Vermote, J. A. Reagan, Y. J. Kaufman, T. Nakajima, F. Lavenu, I. Jankowiak and A. Smirnov, "AERONET-A federated instrument network and data archive for aerosol characterization," Remote Sensing of Environment, vol. 66, pp. 1-16, 1998. (Crossref)
[15] Liji Mary David, I. A. Girach and P. R. Nair, "Distribution of Ozone and its precursors over Bay of Bengal during winter," Role of meteorology, vol. 29, 2009. (Crossref)
[16] Eric Grosjean and D. Grosjean, "Formation of Ozone in Urban Air by Photochemical Oxidation of Hydrocarbons: Captive Air Experiments in Porto Alegre," RS Journal of the Brazilian Chemical Society, vol. 9, 1997. (Crossref)
[17] Hesham A. Al-Jeelani et al., "Diurnal and Seasonal Variations of Surface Ozone and Its Precursors in the Atmosphere of Yanbu, Saudi Arabia," Journal of Environmental Protection, vol. 5, pp. 408-422, 2014. (Crossref)
[18] Amann, Derwent and Forsberg, Health risks of Ozone from long-range transboundary air pollution, ISBN 978-92-890-4289-5 ed., Publication of World Healt Organization Europe, 2008.
[19 ]Huff and K. ., "The Effects of Volcanic Sulfur Dioxide on the Ozone Layer," Atmospheric Chemistry, 1996.
[20] Liujia, Bailang Yu, Zuoqi Chen, Bailiang Li and J. Wu., "Investigating the Temporal and Spatial Variability of Total Ozone Column in the Yangtze River Delta Using Satellite Data: 1978–2013," Remote Sens., vol. 6, pp. 12527-12543, 2014. (Crossref)


