
An Automated Framework for Corona Virus Severity Detection Using Combination of AlexNet and Faster RCNN
Muhammad Haris Munir1, Rabbia Mahum2, Muhammad Nafees3, Muhammad Aitazaz4,
Aun Irtaza5
1,2,3,4,5 Department of Computer Science, University of Engineering and Technology-Taxila,Taxila 47050, Pakistan
1mharis.munir@students.uettaxila.edu.pk, 2,*rabbia.mahum@uettaxila.edu.pk, 3muhammad.nafees@students.uettaxila.edu.pk, 4muhammad.aitzaz@ students.uettaxila.edu.pk, 5aun.irtaza@uettaxila.edu.pk
Citation | Munir. M. H, Mahum. R, Nafees. M, Aitazaz. M, Irtaza. A, “An Automated Framework for Corona Virus Severity Detection Using Combination of AlexNet and Faster RCNN”. International Journal of Innovations in Science and Technology. Vol 3, Special Issue, pp: 197-209, 2022.
Received | Dec 27, 2021; Revised | Feb 2, 2022 Accepted | Feb 4, 2022; Published |Feb 19, 2022.
Abstract.
Coronavirus has affected daily lives of people all around the globe. Lungs being the respiratory organ are the most affected by such a virus. Alternative techniques for diagnosing the coronavirus involving X-rays and CT scans of the chest have been proposed. The severity of the disease, on the other hand, is a crucial component in the patient's treatment. As a consequence, an automated approach to ascertain the severity of the coronavirus on the lungs is designed to decrease the impacts of the coronavirus on the lungs and practice the right treatment. In this manuscript, we proposed a deep learning-based model for identifying the severity level of coronavirus on the lungs which is further categorized in high, moderate, and low. We employed AlexNet for the disease detection and Faster RCNN for the severity level prediction based on the affected area of the lungs. The evaluation is assessed using X-rays and CT scans of the lungs. Total 1400 images have been employed for the training and performance evaluation of the proposed system. The metrics that we considered for the performance evaluation are accuracy, precision, recall, error rate, and time. The results showed that our proposed model attained about 98.4% accuracy and 98.15% precision.
Keywords: Classification; Detection; Deep Learning; Severity Detection and Disease Identification.
INTRODUCTION
An outbreak of the COVID-19 virus emerged in December 2019 in Wuhan, the capital of central China's Hubei province. Although it had a zoonotic origin however, its widespread human-human transmission has resulted in the spread of the virus all over the world. This virus's emergence has been officially labeled as a global pandemic, and it has impacted the complete lifestyle around the world [1] [2]. The common symptoms of this virus are fever and cough with other non-specific symptoms like dyspnea, headache, muscle soreness, and fatigue. Initial analysis in Wuhan reveals the presence of some bilateral lungs opacities on chest CT scans in infected patients. Moreover, the lobular and sub-segmental area of consolidation is considered as one of the most important factors in the infected patients [3]. The chest CT scan is witnessed worst approximately 10 days after symptoms [4].
Due to advancement in Deep Learning (DL) techniques, various models of DL have been developed for the detection of corona virus. However, lab results are also considered for the validation of decisions by physicians. Transfer learning models have been employed i.e. GoogleNet, inception_V3 for virus detection that was trained on 320 images. The accuracy of this model was 82.5%. Xu, Xiaowei, et al. (2020) [5] have applied the VNET–IR–RPN model for both Segmentation and classification of CT scan images to detect the virus. Their model was trained upon 528 CT scan images. The overall accuracy was observed as 86.7%. Song, Ying, et al.(2021) [6] applied DRENet based upon pre-trained ResNet50, very robust to detect objects within images. About 777 images participated in this analysis to train their model and achieved an accuracy of 93%.
El Asnaoui, Khalid, and Youness Chawk (2020) [7] have done a comparative analysis using modern Deep Learning models (VGG-16, VGG19, DenseNet201, Inception_ResNet_V2, Inception_V3, Resnet50, andMobileNet_V2) to check which model does better detection and classification. Dataset of 6087 images of CT and X-rays scans were availed to train the models. Results proved that inception_Resnet_V2 and Densnet201 provided good results comparatively (92.18% and 88.09 % respectively). Rajaraman et al. [8] has developed a DL technique using X-ray images named as CXR images. He attained the 55% and 65% accuracies on test data using Twitter and Montreal CXR images. Gozes et al. (2020) [9] have built a model that enables covid patients to be distinguished from non-covid patients. Their approach generated a lung anomaly localization map as well as measurements. This approach was divided into two parts:
Part I: To detect nodules, for that 3D analysis was used. Small opacities were created using software, followed by localization and measurements.
Part II: The lung Crop stage is the first phase in Part II. A lung segmentation module was used to extract the lungs region of interest (ROI) (U-net architecture). The next step is to use ResNet50, a deep convolutional neural network model to detect coronavirus abnormalities. Narin et al. [10] Have built an autonomous and deep learning based technique for predicting Covid using X-ray images (2020). Three Deep Convolutions Architectures were used in the suggested technique. They have used a dataset comprising of 50 images of covid patient’s X-ray and 50 images of healthy person’s X-ray. The X-rays, as well as all other images, were scaled to 224x224 pixels. To get around the issue of a restricted number of datasets, the Transfer learning models were utilized by the authors. The DCNN was a transfer learning models that utilized the k-fold method and the transfer learning methodology and achieved an accuracy of 98%.
A deep learning classifiers system called "COVIDX-Net" was proposed by Hemdan et al. (2020) [11] to assist radiologists in automatically identifying Covid19. The framework created enables for the classification of Covid X-rays into covid positive and covid negative categories. They have used a set of data that included 50 X-ray images were divided into two groups: normal and Covid positive. Instances that are favorable, each consists of 25 X-rays images. The photographs were shrunk to 224x224 pixels. For the project, 80% of the photographs were used for testing and 20% for training. By using VGG19 and DenseNet models they have attained results, with F-1 scores of 89% and 91% for normal and covid positive patient, respectively.
Farooq and Hafeez (2020) [12] introduced CNN to distinguish Covid patients from other Pneumonia and healthy patients. They used COVIDX dataset [13]. They used 5941 chest radiography images in the dataset, gathered from 2839 patients. They employed a subset of the COVIDX dataset, which was separated into four batches. Covid with 48 images, Bacterial with 660 images, Viral with 931 images, and Normal with 1203 images the training stage, which was completed in three parts. The results showed that the suggested Covid Res-Net worked well. Shan et al. [14] have proposed a new DL model that can segregate and quantify infected areas in CT images of Covid patients. In order to assist radiologists in clarifying automatic annotation of each case, the authors used VB-Net Neural Network and (HITL) technique. They then employed evaluation metrics to analyze the model's performance. The CT scans were sorted into categories. The segmentation network has been trained using these CT images.
The segmentation findings were manually corrected by radiologists and used to feed the model as updated data. They iteratively created the model. The study (Xu et al., 2020) used deep learning algorithms to identify COVID-19 from Influenza-A viral pneumonia and healthy pictures. To classify Computed Tomography (CT) images, they employed multiple CNN. The procedure can be broken down into four steps: 1) The photos were pre-processed in order to extract the most useful pulmonary areas. 2) Multiple candidate picture cubes were segmented using a 3D CNN. 3) To distinguish the pictures patch into Covid, Influenza-A, and healthy, an image classification model was applied. 4) An overall analysis report for one CT sample was created using the noisy-or Bayesian function. For segmentation, the VNET-IR-RPN model was utilized, and for classification, the ResNet-18 model with the location attention mechanism model were used. They have achieved an accuracy of 86.7%.
El Asnaoui et al. (2020) compared contemporary DCNN architecture for binary categorization of pneumonia images using fine-tuned VGG16. They achieved accuracy of 96%. The authors of Zhang et al. (2020) [15] demonstrated a deep learning algorithm for detecting Covid in patients using X-ray pictures of chest. The model consisted of three parts: The main network, which is made up of 18 layers of residual convolutional neural networks (RCNN), is the first. It extracts high level features from an X-rays of the chest. The second is the classification head, which is responsible for generating the Pcls classification score. It was driven by the main network's extracted features. The anomaly detection head is the third component, and it allows Pano to generate a scalar anomaly score. The choice was made based on a threshold T after calculating the categorization score and scalar anomaly score. The findings revealed that the sensitivity was high as 96% for T = 0.15.
In this research, we introduce a novel technique that will help the radiologist and the physicians to detect the presence of coronavirus and the severity of COVID-19 manifestation using the Deep Learning model. Hence, considering the sensitiveness of this disease, time does matter and any delay in the diagnosis and isolation of patients affects the treatment and prognosis and ultimately affects the control of the COVID-19 epidemic.
The main contributions of the proposed framework are as follows: We proposed an effective coronavirus severity detection technique through a hybrid deep learning model i.e. AlexNet [16] and FasterRCNN [17]. Our proposed framework is robust to the input images of lungs i.e X-ray and CT Scans while existing state-of-the-art techniques are based on either X-ray or CT scan images. Our detection method effectively extracts the attributes from the images using modified AlexNet and categorizes the severity using Faster RCNN into three levels i.e. moderate, high, and low.
Material and Methods.
This study proposes a two-step technique for the detection of the corona virus's severity. In the first step, AlexNet was availed for the classification of the images to detect the virus's affected images. In the second step, faster RCNN was trained on multi-class images to determine the severity of the coronavirus. We have made the following block diagram shown in Figure 1 using Microsoft Visio showing the complete working of proposed model.
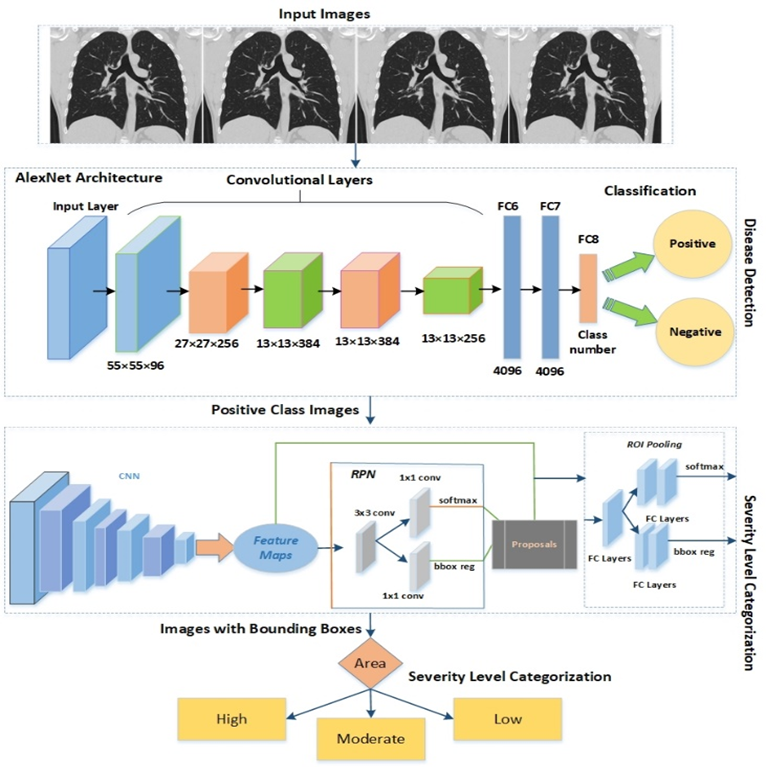
Figure 1. Architecture of the Proposed System.
AlexNet CNN for Detection of Corona Virus
We displayed an AlexNet Convolutional Neural Network (CNN) for corona virus identification in the proposed strategy. Five convolutional layers, two fully hidden layers (totally connected), and one output layer make up the CNN's total of 25 layers (fully connected). Moreover, three maximum pooling layers having size 3x3 were manipulated with a stride of 1 after the three convolutional layers i.e. first, third, and fifth. After each convolutional layer and the first two fully connected layers, we exploited Rectified Linear Unit (ReLU) layers. Normalization layers having window size 5 were adopted after the second and third layers. Dropout value of 0.5 was applied before the first and second Fully Connected (FC) layers. A softmax layer was employed after the last FC layer. Moreover, the AlexNet accepts the size of the image as 227x227, however, images from our dataset had a resolution of 340x320x3, therefore down-sampled to the size of 227x227x3 for the AlexNet algorithm as AlexNet architecture accept image’s dimension of 227x227. The input image was convolved on the first convolutional layer with a filter of 11x11. The size of the window was reduced to 5x5 in the next layer. The window size for the third, fourth, and fifth layers was set to 3x3. Fully linked layers with 4096 nodes were deployed after convolutional layers. Two nodes for the binary classification were added in the final FC layers: affected and non-effected. The parameter of learning rate was set to 0.01 and the batch size was set to 75.
Problem Formation

Faster RCNN for Disease Severity Detection
The Faster RCNN is a modified version of existing models such as RCNN and Fast RCNN, that operate the Edge Box to create the region proposals for the detection of objects. Faster RCNN exercises a Region Proposal Network (RPN) instead of the Edge Boxes technique to form the region proposals. Therefore, the complexity of Faster RCNN is reduced than existing models. The image sample and the position of the affected area of the image sample are the two types of input for the faster RCNN. Faster RCNN is trained on images that fall into one of three categories based on the area of the bounding box that depicts the damaged lungs.
Faster RCNN produces two outputs: 1) classified images based on training, and 2) bounding box coordinates.
Image Annotation
Image annotation is a process to label the classes for the classification in multi-class object recognition. In the proposed system, we have applied the labeling technique for annotation of the images and generated a manual box around the affected part of the lungs under the guidance of a medical expert. These annotations were saved in XML files that have three classes named "High", “Medium” and “low” for the affected part of the lungs and other properties such as x-minimum, y-minimum, x-maximum, y-maximum, width, and height according to the class. For all images, there exists an XML file that was employed to create the CSV file. At last, the training file is created to get benefit in a training phase.
Classification
For classification of the images, according to COVID-19 virus severity effect on lungs, we apply trained faster RCNN. The Faster RCNN is trained on images of the lungs with three severity levels based on the bounding box area. COVID-19-related training is based on photos with a bounding box around the afflicted region of the lungs.
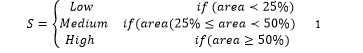
Using factors such as height and width to show the diseased section of the lungs, we calculated the maximum area of the bounding boxes. The severity level is classified as mild if the region covers less than 25% of the lungs. The severity level is classed as medium if the area covers between 25% and 50% of the lungs. The level is classified as high if it is greater than 50%. Furthermore, the model complexity is lowered due to fewer bounding boxes in training photos. Hence, classified images of severity levels of patients, help the physicians to decide the further treatment. The severity level is defined as S, computed as described in equation 1.
Dataset: The proposed model was evaluated on a dataset of 1400 unenhanced chest CT scans (700) [18] and X-ray images (700) [19] of lungs. The age range of patients was from 5 to 85 years. The dataset was divided into 350 non-covid images of X-ray, 350 non-covid images of CT Scans, 350 covid positive images of X-rays, and 350 covid positive images of CT Scans. Most of the patients were having co-existing diseases such as coronary heart disease, hypertension, diabetes, and pneumonia. Images were acquired of the inpatients having positive Reverse Transcription Polymerase Chain Reaction (RT-PCR) test, additionally convoyed by clinical symptoms. The range of scanning was from the apex to the lungs. Moreover, the Image format was DICOM consisting of 16-bits grayscale values with the size of 512x512. Therefore, all images were down-sampled to (227x227 & 224x224) exploited for the training and testing. We selected 60% samples for the training of AlexNet and Faster RCNN and 40% for the testing of the model. For the training of AlexNet and Faster RCNN, images were down-sampled to the resolution of 227x227x3 and 224x224x3 respectively. We altered various parameters in the training phase such as learning rate, epochs, and mini-batch size. We attained the best results for the CT Scan datasets as the images are more high-quality than the X-ray.
Experimental Evaluation.
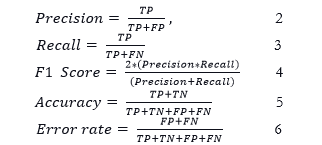
In this section we evaluated the performance of the proposed model, the metrics that we considered were precision, recall, accuracy, f1-score, and error rates. Both precision (percentage of true positive) and recall (percentage predicted as true positive) are vital metrics for retrieving performance information of the model. We are employing these metrics to evaluate the performance percentage of classification of positive cases using our proposed model and also in our case positive class retrieval should be accurately performed than the negative class as we don’t want to miss any covid positive case patient. Therefore, recall should be high as in critical medical cases we can compromise on precision and we cannot compromise on recall. Moreover, true positive (TP), false positive (FP) and false negative (FN) are employed in Precision and Recall as shown in figure 2 and 3. F1-score is the harmonic mean of both precision and recall. It is computed using FP and FN. More precisely, FP represents the number of images classified incorrectly as positive case and FN refers to the cases that are positive in reality however are classified as negative case.. It also provides us significant performance evaluation even in the case of unbalanced dataset. Furthermore, we have used accuracy as performance metric to compute the performance percentage of our proposed model over testing data. We have computed error rate to evaluate the percentage of our testing data that is misclassified.
Formulae of above-mentioned metrics are given below:
Confusion matrix is a summary table that exhibited the performance of our mode in term of prediction of the examples of every class. Axes of below matrix shows predicted-labels vs actual labels. Entries of following table tells us the number of positive covid cases the proposed model has correctly predicted i.e. TP, how many positive covid cases it has falsely predicted i.e FP, number of negative covid cases it has predicted correctly i.e. TN, and how many negative covid cases it has falsely predicted i.e. FN. In the following confusion matrix, we have utilized 560 testing images of x-rays and CT-scans. These images include 300 images of positive class and 260 images of negative class. The positive class images showed various severity levels, however in this experiment we are considering results of binary classification. The results are exhibiting the classification performance of the proposed system that is how many cases were correctly classified as positive and negative cases. The confusion matrix is shown below.
We have made the following confusion matrix Microsoft Visio after results calculation.
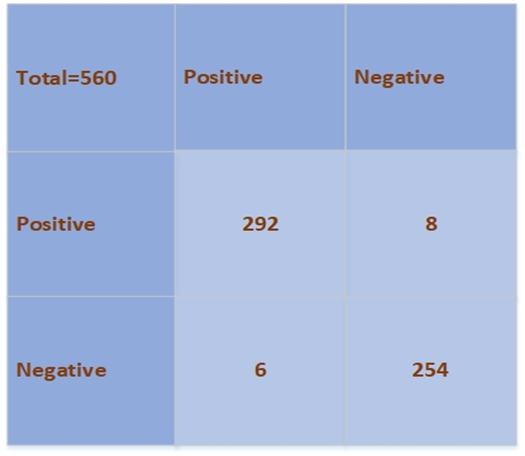
Figure 2. Confusion matrix for binary classification
In the second evaluation step, we computed the performance of our proposed algorithm on both datasets i.e. CT Scans and X-ray images. The performance of our proposed model over both datasets images such as X-rays and CT Scans is considerable. The accuracy of the proposed model is 98.3% over CT Scans images and 98.5% over X-ray images and error rates are 1.7% and 1.5% respectively. Furthermore, overall performance of our model is showing significance of the technique to use it in medical field. The accuracy of the model is 98.4%, precision is 98.15%, and recall is 98.3%. Other than the evaluation results, our proposed algorithm is a generalized model that can be trained on less number of images for classification as compared to traditional machine learning based models which makes it capable to employ it for other disease detection problems. The detail of the results is reported in Table 1. The graph is shown in figure 3.
Table 1. Performance Evaluation on the Datasets.
|
Dataset(Image) |
Precision (%) |
Recall (%) |
F1-Score (%) |
Accuracy (%) |
Error (%) |
|
CT scans |
98 |
98.1 |
98.05 |
98.3 |
1.7 |
|
X-ray |
98.3 |
98.5 |
98.4 |
98.5 |
1.5 |
|
Average |
98.15 |
98.3 |
98.22 |
98.4 |
1.6 |
In our second experiment, we trained Faster RCNN, and AlexNet on training data separately to compare results with the proposed hybrid model. Faster RCNN takes a training time of 150 minutes for training images while AlexNet takes 175 minutes. Moreover, AlexNet performs classification on the bases of visual features whereas Faster RCNN employs bounding box for the object detection and performs classification. In our scenario, Faster RCNN is trained over effected are of lungs in Xrays and CT Scans. The bounding box locations representing the affected area of lungs are fed to the model and then classification is achieved to assess the performance. The AlexNet algorithm achieves the 96% accuracy while Faster RCNN attains 96.8% accuracy. Furthermore, our proposed hybrid model achieves the 98.4% accuracy that shows the efficacy of the system. The comparative results are reported in Table 2.
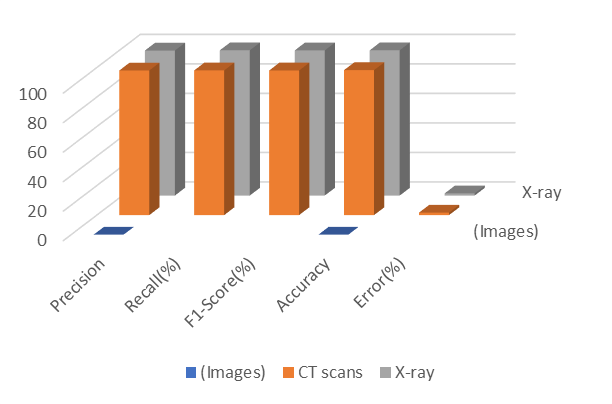
Figure 3 Performance Plot for the Proposed Model.
We have made the graph shown in figure 3 using Microsoft Excel sheets after results generation.
Table 2. Evaluation Metrics for the Proposed System.
|
Model |
Precision (%) |
Recall (%) |
Accuracy (%) |
Error (%) |
|
AlexNet |
92 |
93 |
96 |
4 |
|
Faster RCNN |
94 |
94.8 |
96.8 |
3.2 |
|
The Proposed Model |
98.15 |
98.3 |
98.4 |
1.6 |
In our last experiment, we compared the performance of our hybrid deep learning model against the various automated deep learning techniques i.e. Xception, ResNet_V2, DenseNet201, ResNet50, MobileNet_V2, and SqueezeNet employing the same dataset for training and validation. We tuned training parameters for the proposed system such as initial learning rate of 0.001, batch size of 35, and epochs of 20. Our proposed algorithm takes minimum time for training i.e. 39,200 seconds. Additionally, for efficiency evaluation, we employed different datasets images i.e. CT scans and X-ray images of Covid and pneumonia patients. The algorithm takes the same time for the training of both datasets. In Table 3, the detection performance comparison is shown. From the reported results, it is shown that our hybrid model outperforms the other deep learning methods. The comparison is shown in figure 4. Furthermore, some of the positive class tested images are shown in figure 5.
Table 3. Comparative Analysis with the other Deep Learning Models.
|
Method of Covid-19 Detection |
Accuracy(%) |
Time(seconds) |
|
Xception |
95.70 |
49,820 |
|
ResNet_V2 |
93.18 |
48,921 |
|
DenseNet201 |
90 |
40,829 |
|
ResNet50 |
89.01 |
48,920 |
|
MobileNet_V2 |
91 |
41,293 |
|
SqueezeNet |
92.3 |
43,232 |
|
The Proposed Model |
98.4 |
39,200 |
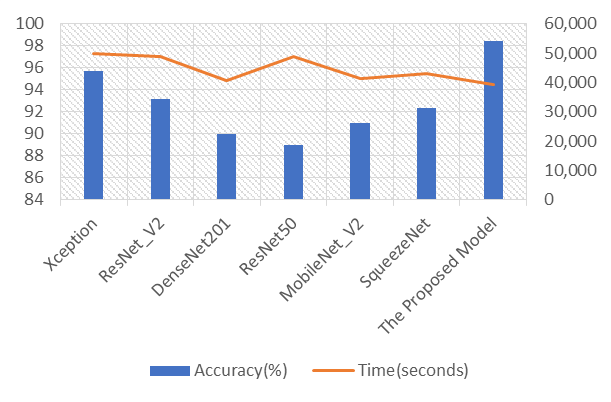
Figure 4. Comparison with the Existing DL Techniques.
Figure 4 is showing the effectiveness of our proposed model in comparison to already existing models.
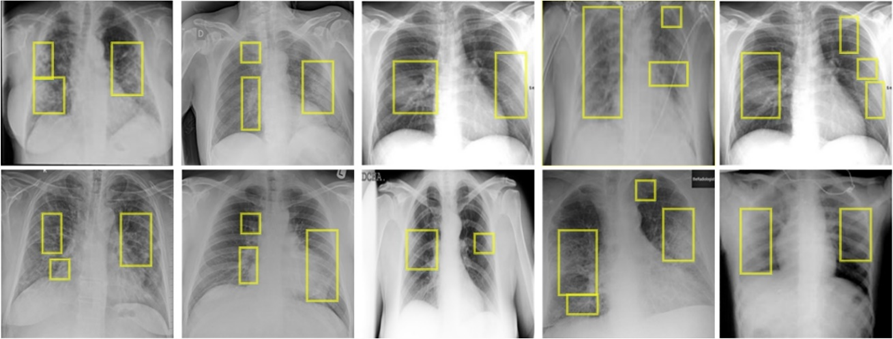
Figure 5. Detection results on test data
The images in figure above were generated after implementation of technique on the input images, then after that we have formatted/combined those images in Microsoft Visio.
We have employed various experiments to evaluate the results and efficacy of our proposed model. It is depicted from the results that our proposed algorithm outperformed the existing detection techniques of the corona virus detection. Our proposed model is based on transfer learning mechanism that is already trained over millions of images. Therefore, it can be utilized for other disease detection problems. The training time of our proposed system is also comparable to other existing techniques. Moreover, Faster RCNN algorithm extracts the most representative features from the images due to implication of bounding boxes, which is not a characteristic of the other existing classification models for corona virus detection.
Conclusion.
This study proposes an effective Covid-19 severity detection framework using a combination of deep learning models. We harnessed AlexNet deep learning model for coronavirus detection to filter the virus-affected images. Next, we employed the Faster RCNN algorithm to detect the affected area of the lungs due to the virus. The severity of the ailment was determined based on the area. X-rays and CT scans of the lungs are maneuvered to assess the examination. For the training and performance evaluation of the proposed system, a total of 1400 photos were employed. The average accuracy of our proposed model is 98.3 percent, indicating the framework's effectiveness. The performance of our proposed framework degrades to some extent when X-ray images of pneumonia were classified as Covid-19 positive. We are planning to overcome this restraint in the future.
Acknowledgement. We thank Dr. Syed Aun Irtaza (Chairman CS Dept. at University of Engineering and Technology, Taxila) for his kind support by supervising and reviewing our work and we also thank Rabbia Mahum (Lecturer CS Dept. at University of Engineering and Technology, Taxila) for her supervision and assistance in technique implementation and drafting. This research was supported by University of Engineering and Technology, Taxila.
Author’s Contribution.
- RabbiaMahum, Muhammad Haris Munir : Drafting and Implementation of Technique.
- Muhammad Nafees, Muhammad Aitazaz : Validation of Results.
- Syed AunIrtaza : Reviewed.
Conflict of interest. The Authors have no conflict of interests.
Project details. Not Applicable.
References
|
[1] |
Salehi, Ahmad Waleed, "Review on machine and deep learning models for the detection and prediction of Coronavirus," Materials Today: Proceedings, vol. 33, pp. 3896-3901, 2020. |
|
[2] |
C. Ouchicha, "CVDNet: A novel deep learning architecture for detection of coronavirus (Covid-19) from chest x-ray images," Chaos, Solitons & Fractals, vol. 140, pp. 110245, 2020. |
|
[3] |
Bhattacharya Sweta Maddikunta, Praveen Kumar Reddy Pham, Quoc-Viet Gadekallu, Thippa Reddy Chowdhary, Chiranji La Alazab, Mamoun Piran, Md Jalil, "Deep learning and medical image processing for coronavirus (COVID-19) pandemic: A survey," Sustainable cities and society, vol. 65, p. 102589, 2021. |
|
[4] |
Pan, Feng, Ye, Tianhe, Sun, Peng, Gui, Shan, Liang, Bo, Li, Lingli, Zheng, Dandan, Wang, Jiazheng, Hesketh, Richard L, Yang, Lian, "Time course of lung changes on chest CT during recovery from 2019 novel coronavirus (COVID-19) pneumonia," Radiology, 2020. |
|
[5] |
Xu, Xiaowei Jiang, Xiangao, "A deep learning system to screen novel coronavirus disease 2019 pneumoni," Engineering, vol. 6, no. 10, pp. 1122-1129, 2020. |
|
[6] |
Song, YingZheng, ShuangjiaLi, LiangZhang, XiangZhang, XiaodongHuang, ZiwangChen, JianwenWang, RuixuanZhao, HuiyingChong, Yutian, "Deep learning enables accurate diagnosis of novel coronavirus (COVID-19) with CT images," IEEE/ACM transactions on computational biology and bioinformatics, vol. 18, no. 6, pp. 2775-2780, 2021. |
|
[7] |
El Asnaoui, Khalid, "Automated methods for detection and classification pneumonia based on x-ray images using deep learning," in Artificial intelligence and blockchain for future cybersecurity applications, Springer, 2021, pp. 257-284. |
|
[8] |
Rajaraman, S., Siegelman, J., Alderson, P. O., Folio, L. S., Folio, L. R., & Antani, S. K., "Iteratively pruned deep learning ensembles for COVID-19 detection in chest X-rays.," Ieee Access, vol. 8, pp. 115041-115050, 2020. |
|
[9] |
Gozes, Ophir, Frid-Adar, Maayan, Sagie, Nimrod, Zhang, Huangqi, Ji, Wenbin, Greenspan, Hayit, "Coronavirus detection and analysis on chest ct with deep learning," arXiv preprint arXiv:2004.02640, 2020. |
|
[10] |
Narin, Ali, Kaya, Ceren, Pamuk, Ziynet, "Automatic detection of coronavirus disease (covid-19) using x-ray images and deep convolutional neural networks," Pattern Analysis and Applications, vol. 24, no. 3, pp. 1207-1220, 2021. |
|
[11] |
Hemdan, Ezz El-Din, Shouman, Marwa A, Karar, Mohamed Esmail, "Covidx-net: A framework of deep learning classifiers to diagnose covid-19 in x-ray images," arXiv preprint arXiv:2003.11055, 2020. |
|
[12] |
Farooq, Muhammad, Hafeez, Abdul, "Covid-resnet: A deep learning framework for screening of covid19 from radiographs," arXiv preprint arXiv:2003.14395. |
|
[13] |
Wang, Linda, Lin, Zhong Qiu, Wong, Alexander, "Covid-net: A tailored deep convolutional neural network design for detection of covid-19 cases from chest x-ray images," Scientific Reports, vol. 10, no. 1, pp. 1-12, 2020. |
|
[14] |
Shan, Fei, Gao, Yaozong, Wang, Jun, Shi, Weiya, Shi, Nannan, Han, Miaofei, Xue, Zhong, Shen, Dinggang, Shi, Yuxin, "Lung infection quantification of COVID-19 in CT images with deep learning," arXiv preprint arXiv:2003.04655, 2020. |
|
[15] |
Zhang, Jianpeng, Xie, Yutong, Pang, Guansong, Liao, Zhibin, Verjans, Johan, Li, Wenxin, Sun, Zongji, He, Jian, Li, Yi, Shen, Chunhua, "Viral pneumonia screening on chest X-ray images using confidence-aware anomaly detection," arXiv preprint arXiv:2003.12338, 2020. |
|
[16] |
Krizhevsky, Alex, Sutskever, Ilya, Hinton, Geoffrey E, "Imagenet classification with deep convolutional neural networks," Advances in neural information processing systems, vol. 25, 2012. |
|
[17] |
Chen, Xinlei, Gupta, Abhinav, "An implementation of faster rcnn with study for region sampling," arXiv preprint arXiv:1702.02138, 2017. |
|
[18] |
"GitHub, GitHub. 2020/11/06: https://github.com/last accessed 2020/11/06.". |
|
[19] |
Kaggle, "kaggle, Kaggle. 2020/11/06: https://www.kaggle.com/, .". |


