
Analysis of Flood Damage Assessment through WorldView-2, Quick Bird and Multispectral Satellite Imagery in Southern Punjab, Pakistan
Nizamud Din Essa*1,2, Muneeb Aamir1, Syed Amer Mahmood1, Farzeen Riaz1, Nida Farooq1, Rabia Rasheed1, Syeda Qandeel Fatima1, Saira Batool3, Syed Aamir Mehmood1,4, Imran Siddique Kaukab1 , Fawad Saeed5
1 Department of Space Science, University of the Punjab, Pakistan
2 The Urban Unit, Government of the Punjab
3 Center for Integrated Mountain and Research
4 Punjab Municipal Development Fund (PMDFC), Lahore
5 Pakistan Water and Power Development Authority
*Correspondence: amerpakistan@gmail.com
Citation | Essa N.D., Amir M., Mahmood S.A., Riaz F., Farooq N., Rasheed R., Fatima S.Q., Batool S., Mehmood S.A., Kaukab I.S. Saeed. F. Analysis of Flood Damage Assessment through WorldView-2, Quick Bird and Multispectral Satellite Imagery in Southern Punjab, Pakistan International Journal of Innovations in Science & Technology, Vol 01 Issue 03: pp 120-139, 2019.
DOI | https://doi.org/10.33411/IJIST/2019010310
Received | June 28, 2019; Revised |July 17, 2019 Accepted | July 22, 2019; Published | July 25, 2019.
________________________________________________________________________
Abstract.
Pakistan has faced numerous natural disasters like floods, earthquakes, landslides and environmental degradation which severely affects the Pakistan’s economy and results in various problems like causalities, diseases, water stress and severe damages (e.g., houses, public infrastructure and agricultural land erosion). There is a lack of systematic approaches to analyze pre and post damage assessment for estimation of exact loses and the total cost for rehabilitation of damaged infrastructure in an efficient way. There exist a variety of mechanisms but GIS based flood mapping is considered the most efficient to manage the flood situation. This study is focused on evaluation of flood affected areas especially in Punjab using WorldView-2, 8-band multi-spectral imagery by applying Remote Sensing (RS) and GIS techniques. The research area is comprised of Kot Addu and Muzaffargarh Districts in Punjab province of Pakistan that faced a catastrophic super flood of 2010. The WorldView-2, Quick Bird and multispectral satellite imagery are capable of making better decisions and assessment of flood effected area accurately. RS and GIS techniques can achieve the objectives and significant analyses through visual interpretations. These techniques are also used to identify the flood affected regions. The study site was examined by applying supervised classification on the basis of the training areas which were obtained during the field surveys in the study site. Supervised classification determines that 16900.96 Hectors of agriculture land was damaged while Sparse Riverine Forest had the area 44.52 hectors. The damaged built-up area was 1805.78 Hectors. RS and GIS techniques are efficient for flood mapping.
Keywords: Multi-spectral bands, GIS, RS, Visual Interpretation Elements, Supervised Classification, Worldview-2 and Quick Bird.
Introduction.
Natural disasters such as flood, tsunami, typhoon forest fire, earthquake, volcanic eruption and debris flow often cause interference to cultural environment and physical structures, houses and infrastructure [1]. Flooding creates a marvelous influence on human life and has great worldwide importance regarding hydrological cycle [2]. Each year natural hazards, such as earthquake, typhoon, flood, and debris flow etc., cause tremendous loss of properties and human lives in the world [3]. The hazardous floods are the most shocking, widespread and frequent, amongst other natural disasters [4,5]. Flood vulnerability represents the potential of flood that portends floodplain inhabitant’s lives and their assets and agricultural land [6]. Floodplain is relatively plane and low-lying area where water flow over the river banks [7,8,9,10]. As floods are the natural phenomenon but flood hazards cause to devastate the social life of inhabitants, business, housing, and agricultural activities, which often severely damaged during flood [6,11,12,13].
In Pakistan, floods are classified on the basis of pivotal factors e.g., riverine flood, dam break flood and storm surge floods [14]. Riverine flood happens due to the inflow of water to a river, when water surpasses to river’s channel capacity [12]. In Pakistan, flood history from 1950-2015, highlights many high medium and low-level floods along Indus River and its connecting channels but the flood event occurred in 2010 was super flood which resulted in major damages to adjacent districts along Indus and Chenab River. According to federal flood commission of Pakistan about 1,985 people lost their lives, 1.6 million houses were smashed, 17,553 villages and a total area of 160,000 km2 were affected by the flood occurred in 2010. This flood damaged infrastructure, roads, irrigation and drainage system throughout the country and effected the social life of about 20 million people across the country.
In some scenario, flood safety works fascinate high value land use in flood hazards areas but provide false sense of security to floodplain dwellers and their properties therein because these works often get breached during high flood flow [15, 12]. The main factor of breaks in river channels is the sand molding which is due to shocking floods [16].
Pakistan is struggling to manage natural hazards for survival from nastiest catastrophic conditions which may occur in future. About one fifth of Pakistan’s area was affected by flood water in 2010 which pushed thousands of families to displace for their survival and leaving millions as homeless. The low-lying Indus belt in the Punjab Pakistan represents a flood prone zone. This flood hit the areas along Chenab and Sutlej River. It destroyed the existing infrastructure completely. Both the cultural and economic standards of life had been drained out in rain. Flood 2010 covered the complete study site in comparison to floods of 2014, 2015 as shown in figure 1
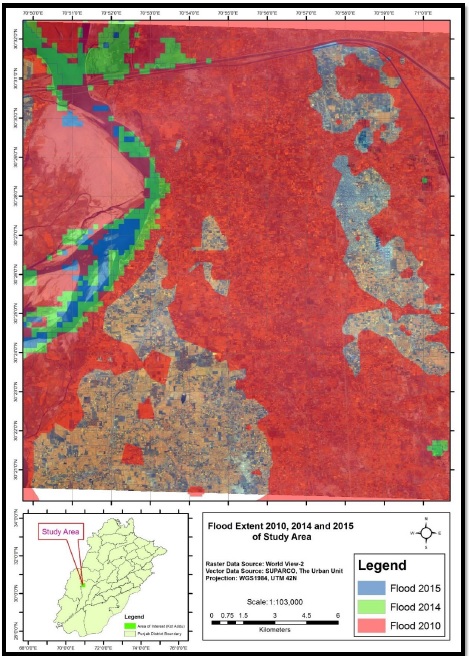
Figure 1: Flood Extent 2010, 2014 and 2015 in the study site.
The management of a disaster in efficient ways and the rehabilitation activities are significant for the prosperity of affected people. Intime management of Hazards and damage assessments are key indicators for defining actions that communities can take to reduce socio-economic losses [3]. Adequate understating of the flood assessment can support the decision makers in choice of engineering or non-engineering measures for flood damages [17].
There may be different measures that can be taken for hazard management in a region, such as land use planning and management, construction of engineering structures and flood monitoring or warning systems, etc. The effectiveness of these alternatives can be more properly evaluated if the comparisons are based on the risk reductions from the implementation of that measure [18].
In order to estimate the damages occurred due to flood hazards, optical data is widely used [19,20,21,22,23,24,25,26]. For land cover identification and assessment accurately, satellite imagery is considered as dominant tool [27]. The satellite imagery having spatial resolution more than 5 meter creates great impact to estimate the accurate extent of flood [28]. The spatial resolution provides great value to understand the variations in topography and various natural and manmade activities [29]. In order to execute the classification for land cover mapping, usually multispectral imagery is used [30]. For image exploration, classification is considered as the most significant part [31] used to retrieve the information about different land cover classes from the image. To take trainee areas for supervised classification, different band combinations and interpretation keys e.g., texture, tone pattern, shadow, lightness/darkness, associate and situation of land cover features in image are widely used[30].
A variety of classification techniques are available for Landuse Landcover reorganization [32]. Supervised classification is one of these techniques widely used in various applications. Supervised classification is based on detection algorithm using pixels from known reference samples, usually located within a scene, as a key for comparison to other pixels in the same scene [33].
Assessment of flood affected areas was examined using WorldView-2 8-band sample imagery. The Hyper-spectral imagery has capacity to make better decision and assessment of the focused area. GIS and RS techniques are used in this study to achieve the objectives and relevant analysis. Current status of the Land Cover and Land Use (LULC) is estimated by using supervised classification on the basis of the training areas which were selected during the field survey through GPS.
LULC classification can be seen on a continuum, starting with a basic estimation of land cover through broad categories, like farmland and urban areas, to feature extraction, like road networks, buildings, and trees [29]. The visual interpretation technique is the most precise approach [34] and is used for comparison of supervised classification results and identification of flood affected areas. WorldView-2 imagery has specific cartelistic with 1.86 m multispectral resolution by using False Color Composite (FFC), panchromatic 0.46m imageries. The data was compared with the Quick Bird pre-imagery and digital photographs to sort out the damage areas.
Digital Globe World View-2 has capacity to discriminate features in the study site in a better way through bathymetric analysis and vegetative analysis with more accuracy as it is possessing 8-spectral bands with additional four bands. With hyper spectral and coastal band to asses and estimate the flood extent, damage, harm etc. World View-2 consists of one panchromatic and two multispectral imaging sensors; MS1 includes Blue, Green, Red, and Near-IRI and MS2 includes coastal Blue, Yellow, Red Edge and Near-IRI [35].
The objective of this study was to utilize Remote Sensing (RS) techniques with the available Geographic Information System (GIS) to develop a rehabilitation model consisting of transparent information regarding total flood affected area & identification of demolished household, damaged infrastructure, flooded crops to achieve the level of better decision making to help the responsible authorities for developing, designing, and operating flood control infrastructure and preparing aid and relief operations for high-risk areas during future floods.
Material and Methods.
Investigation site.
The study was conducted in Tehsil Kot Addu of District Muzaffargarh, Punjab. The spatial location of study area is 70.929oE & 30.944oN. District Muzaffargarh is among the severely damaged districts during the flood because it is surrounded by two rivers (Chenab and Indus). Both rivers were fully flooded which dragged most of the district area under water as shown in Figure 2.
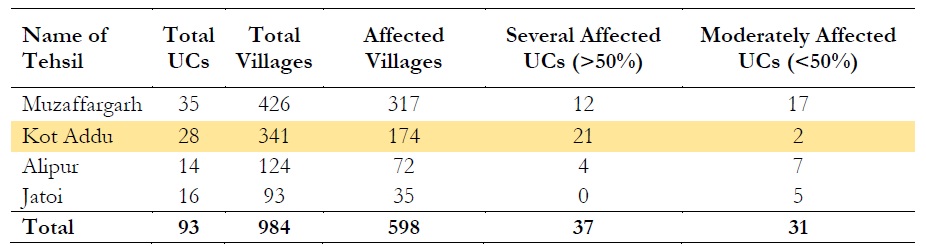
Kot Addu is the severely damaged tehsil of the district Muzaffargarh as shown in the table 1. The number of houses damaged in Kot Addu reached up to 71,104 along with six fully affected basic health units leading to miseries and displacements [18].
Table 1: Summary of Total Affected Area of District Muzaffargarh
Data used
For this study hyperspectral imagery of spatial resolution 1.86m and panchromatic of spatial resolution 0.46m of World View-2, Quick Bird Scene and the GIS data (Source : The Urban Unit) are used. About 400 Square kilometer area (38913.87 Hectors) of Tehsil Kot Addu, district Muzaffargarh was acquired from Digital globe for the research purpose. World view- 2 has 8 bands with 4 extra bands. The spectral range of the 8-bands is given as in Table-2.
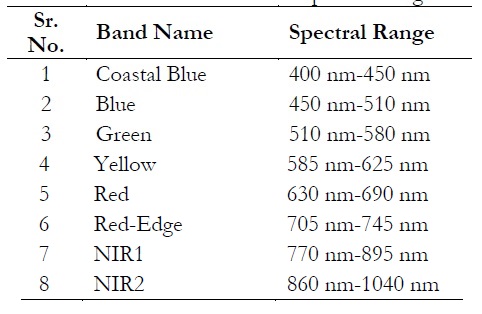
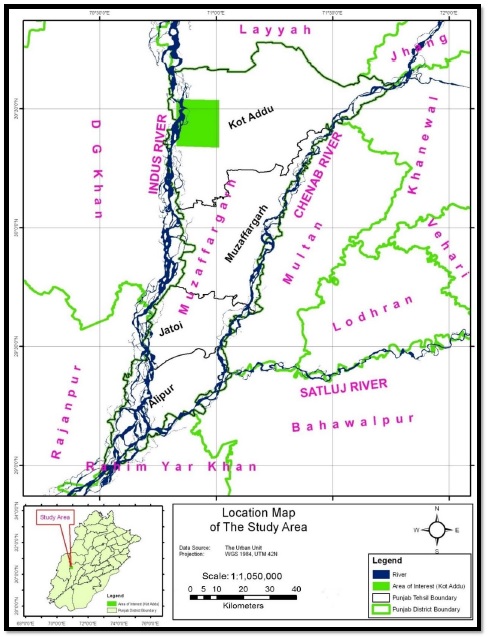
Figure 2: Location Map of Study Area
Methodology
The data was provided by the Digital Globe in patches. The mosaicking process was performed in Erdas Imagine to form a single scene of the WorldView-2 imageries. Moreover, the panchromatic image was diffused with multispectral imagery to get more clarity and high quality for visual interpretation. To identify the damaged features, visual interpretation technique is performed by using FCC on the multispectral 8-band imagery of spatial resolution 1.86m and compare with WorldView-2 panchromatic imagery of spatial resolution 0.46m, Quick Bird scenes of spatial resolution 0.6m along with digital photographs. About 170 categories of different LULC were identified using supervised classification on the basis of training areas and further recoded into 13 broad categories. GPS coordinates and the digital photographs of these damaged roads, drainage network, abadies, education institutes, health units, bridges, different kinds of agricultural and water areas were obtained during the field survey for verification of land use classification. The methodology flow chart is given in figure 3. The thematic map of training/samples points with WorldView-2 multispectral imagery is shown in the form of figure 4.

Figure 3: An Overview of the Methodology
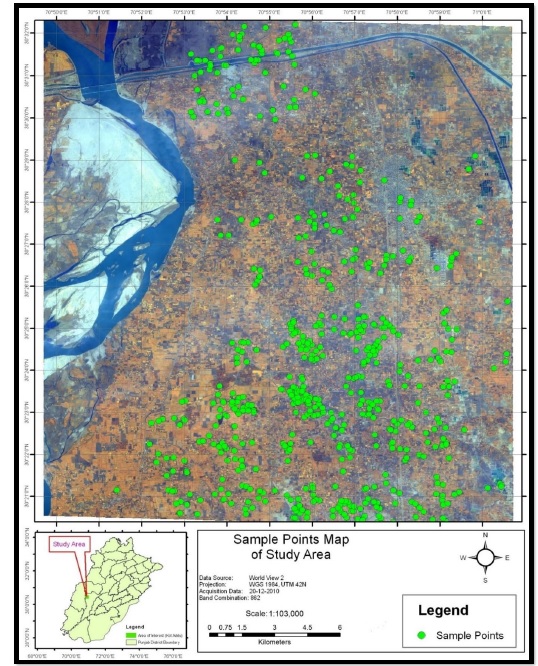
Figure 4: Training/Sample Points Map on the WorldView-2 Multispectral Image in FCC
Results and Discussion
Supervised classification was executed with the help of the sample points which were collected during the field survey. By using coastal blue band, the deep water and the sedimented water is identified. Yellow and Red-Edge spectral bands have the major role in identification of different kinds of the agriculture field. Even by using NIR2 spectral band, the damaged agriculture field is identified which has the dominant area than the other classes. Riverine forest, sparse forest, plantation/orchards, land soil and built-up areas are also identified in the classification results. About 13 classes during supervised classification results are shown in the thematic map as in figure 5. The area wise detail of the 13 classes is shown in the table 3.
Table 3: Supervised Classification Result
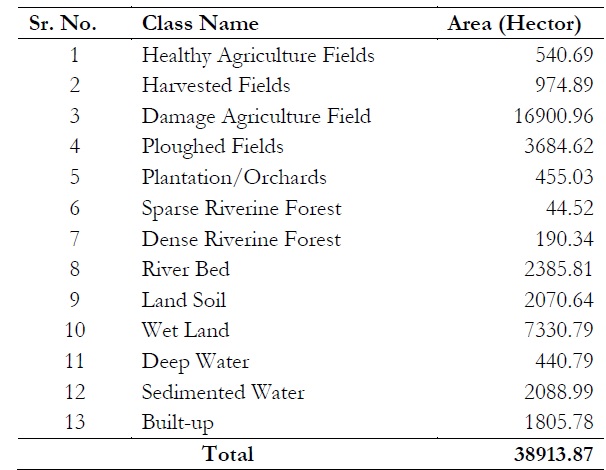
The result show that 16900.96 Hectors area out of 37108 Hectors was damaged agriculture land which is highest than the harvested field, healthy agriculture and ploughed field, while Sparse Riverine Forest has the area 44.52 hectors.
Visual interpretation
Visual interpretation technique is used to identify the damaged features using FCC on the multispectral 8-band imagery of spatial resolution 1.86m which was compared with WorldView-2 panchromatic imagery of spatial resolution 0.46m, Quick Bird scenes of spatial resolution 0.6m.
The direct tangible damages and intangible damages were observed by the flood 2010. Direct tangible damages include the physical damage of the houses and infrastructures, while intangible damages include the health impacts; physical and mental impacts. The different tangible damaged features; school, village, road, agriculture, bridge, and irrigation channel are shown in figures 6,7, 8, 9, 10, 11 and 12. The school is worst damaged during the flood 2010 as shown in figure 7 (a, b, c and d). Village is highlighted in the figure 8 (a, b, c and d), which is also badly affected during the flood 2010. The infrastructure was consist of; road, bridge and irrigation channel are also badly affected during the flood 2010. The significance of the flood can be seen in such kind of visual interpretations. The crops were badly affected in flood 2010 which is shown in the figure 10 (a, b, c, and d). The standing flooded water can be seen in digital photograph.
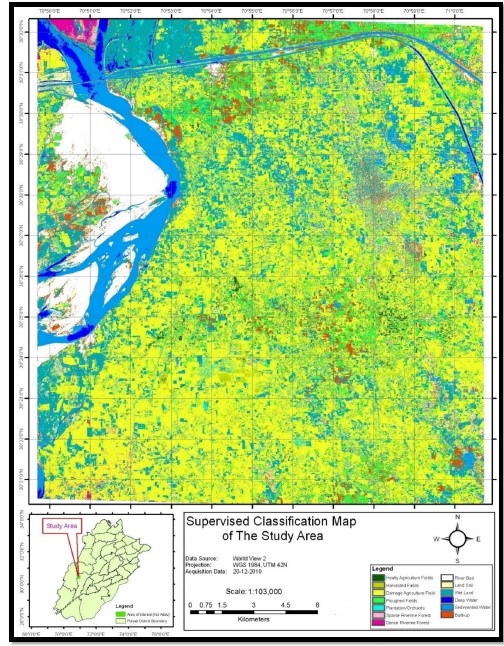
Figure 5: Supervised Classification Map
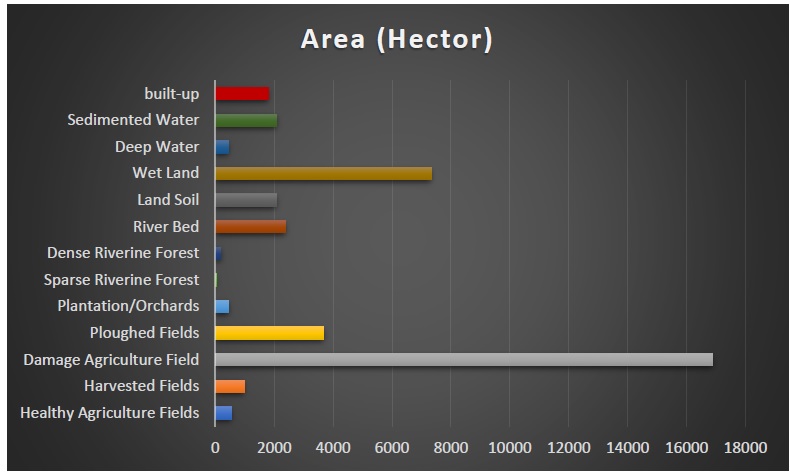
Figure 6: Supervised Classification Chart
In case of intangible damages through flood 2010, only 2 persons died and 35 persons were injured while 2127 cattle head lost in district Muzaffargarh according to PDMA reports [36,37,38,39].
Rehabilitation
In order to develop rehabilitation model for the flood affected infrastructures, damage houses and crops, the provincial government and federal government took initiative and compensated the losses of the flood affected people. The provincial government repaired the flood affected infrastructures (road, school, irrigation channels, bridges, masjids, health clinics/dispensary, tube wells, etc) and prepared the model villages for the flood affected people as shown in figure 13. The houses in the model villages were allotted after the verification to the flood affected people. The school, dispensaries, tevta centers, livestock shed/veterinary dispensary, park and community center are also included.
Now National Disaster Management Authority (NDMA), Provincial Disaster Management Authority (PDMA), Irrigation Department, Planning & Development department and district level government are planning to maintain the disaster response plans, risk vulnerability assessment and preparing the spatial decision support system (SDSS) to mitigate the rehabilitation activities before future flood.
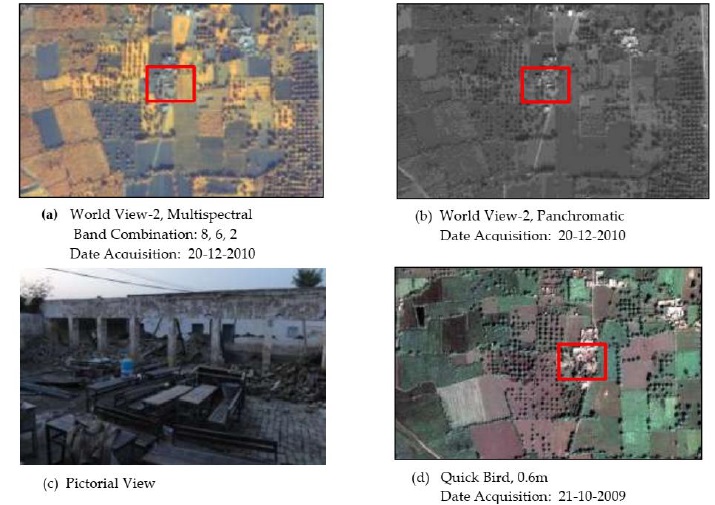
Figure 7: Damaged GGPS, Shauhrat wala UC 1 School Building is shown temporally in a, b, c and d
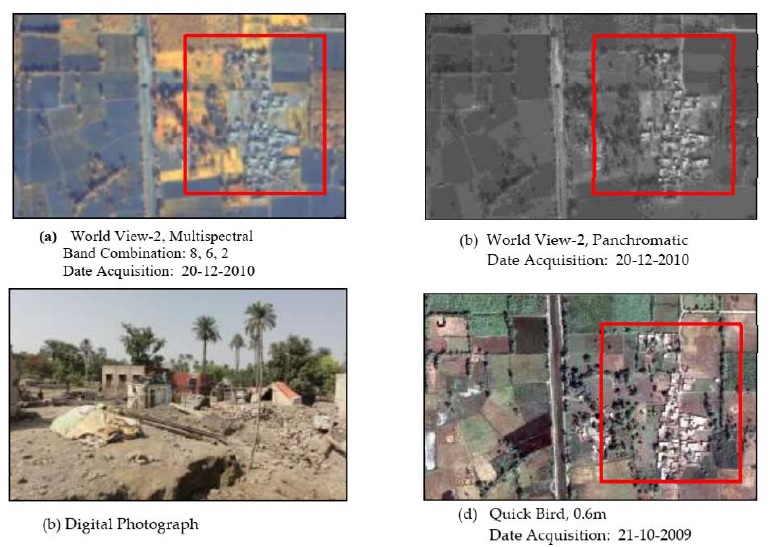
Figure 8: Damaged Basti Korai Wala is shown temporally in a, b, c and d and d

Figure 9: Damaged Taunsa Road is shown temporally in a, b, c and d

Figure 10: Damaged Agricultural at Haala village is shown temporally in a, b, c and d
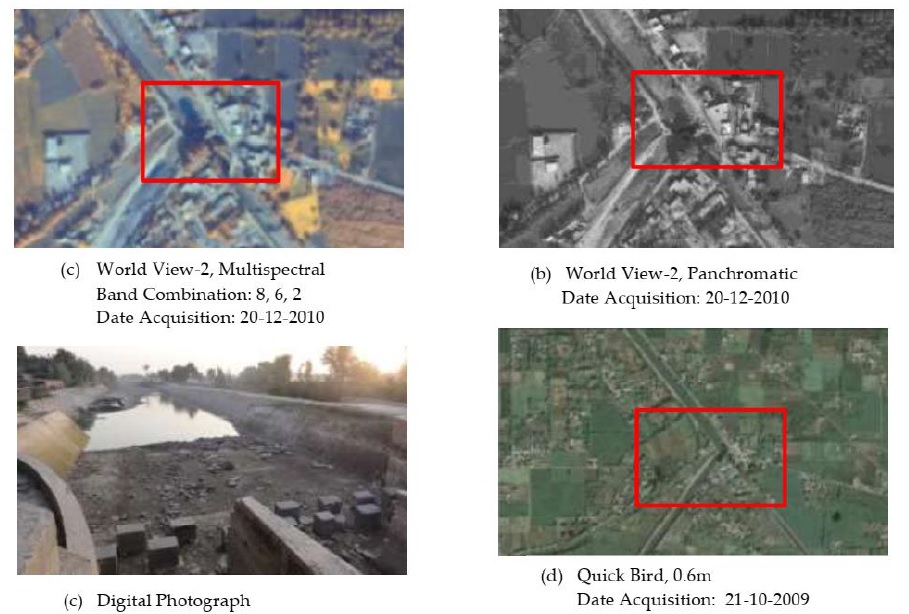
Figure 11: Damaged bridge is shown temporally in a, b, c and d.

Figure 12: Damaged irrigation channel is temporally shown in a, b, c and d.

Figure 13: Location Map of Model Villages in Study Area
Conclusions
For disaster rehabilitation plan, it is ofgreat importance to obtain classification results with precision. Worldview-2 multispectral image has the great potentialto identifythe existing landuse features by using the extra 4 bands besides its high spatial resolution. This imagery can be used for various application and obtain a fruitful result by using this study for different application related to natural disaster estimation, assessment, management, and redevelopment of affected areas. The combination of 8, 6, and 2 was found to be useful for flood relatedapplication. It made the differentiation of vegetation gone under water very clear. The red edge band and NIR2 enhanced the vegetation even under water and on the other hand blue band helped to identify water in fields.Thevisual interpretation of the affected area also worked well. The settlements and agricultural lands were efficiently mapped.The implementation of coastal blue band helped to identify the sedimented water in comparison to the deep blue water during supervised classification.Limitation of the study. The study focuses on the damage assessment of the flood affected area in 31stJuly 2010 to 27thAugust 2010. To properly analyze the pre-flood and post flood situations of the area, a temporal imagery from world view-2 was required. Due to non-availability of the pre-flood imagery, an imagery of 0.6 m from the quick bird is used for temporal analysis.
Further Implications8-band imagery has good capacity to identify the damage features, vegetation analysis, and water analysis by using extra 4 bands. So, disaster management specifically flood can be efficiently mapped on al large scale, e.g., whole Punjab province after flood.
Acknowledgement
I am thankful to The Urban Unit, P&D Department, Government of the Punjab, Lahore, Pakistan who provided me full support to accomplish my study work and to the Digital Globe for provision of sample satellite imagery of Worldview-2. I am also thankful to my supervisor, colleagues and friends who helped me in putting forward my research.
Conflict of interest: We declare noconflict of interest for publishing this research paper in IJIST. Author’s Contribution. All authors contributed equally.
References:
1.Mallinis, Giorgos & Emmanoloudis, Dimitrios & Giannakopoulos, Vasileios & Maris, Fotis & Koutsias, Nikos. (2011). Mapping and interpreting historical land cover/land use changes in a Natura 2000 site using earth observational data: The case of Nestos delta, Greece. Applied Geography. 31. 312-320. 10.1016/j.apgeog.2010.07.002.
2.National Research Council (NRC), “Earth Science and Applications from Space: National Imperatives for the Next Decade and Beyond,” National Academy of Science Press, (2007).
3.W.W.Hays. (1991). Hazard and Risk Assessments in the United-States. International Union of Geological Sciences, 7-12.
4.N. Dhar, O & Nandargi, S. (2003). Hydrometeorological Aspects of Floods in India. Natural Hazards. 28. 1-33. 10.1023/A: 1021199714487.
5.Sanyal, Joy & Lu, X.X. (2004). Application of Remote Sensing in Flood Management with Special Reference to Monsoon Asia: A Review. Natural Hazards. 33. 283-301. 10.1023/B:NHAZ.0000037035.65105.95.
6. Smith, K. (1996) Environmental Hazards. London: Routledge.
7.Leopold, L.B. and Wolman, M.G. (1957) River Channel Patterns, Braided, Meandering and Straight. U.S. Geol. Surv. Paper. 282-B.
8. Nanson, G. C. & Croke, J. C. (1992). A genetic classification of floodplains. Geomorphology, 4 (6), 459-486.
9. Marston, Richard & Knighton, David. (1986). Fluvial Forms and Processes. Geographical Review. 76. 345. 10.2307/214163.
10. Benito, Gerardo & Hudson, Paul. (2010). Flood Hazards: The Context of Fluvial Geomorphology. 10.1017/CBO9780511807527.010.
11. Graham A. Tobin and Burrell E. Montz. (1997). The Impacs of a Second Catastrophic Flood on Property values in Linda and Olivehurst, California.
12. Sivasami, K.S. (2002). Environmental effect due to floods and reservoirs. Environmental hazard in South Asia. 65-82.
13. Singh, Dhruv & Awasthi, Amit. (2011). Natural hazards in the Ghaghara River area, Ganga Plain, India. Natural Hazards. 57. 213-225. 10.1007/s11069-010-9605-7.
14. Rakhecha, P.R. & Singh, V.P. (2009). Applied Hydrometeorology, Heidelberg: Springer
15. UNDP. (1991). Human Development Report. New York: Oxford University.
16. Gaurav, Kumar & Sinha, Rajiv & Panda, Prafulla. (2011). The Indus flood of 2010 in Pakistan: A perspective analysis using remote sensing data. Natural Hazards. 59. 1815-1826. 10.1007/s11069-011-9869-6.
17. L. Douglas James, M. A., & Hall, a. B. (1984). Risk Information for Floodplain Management. Water Resources Planning and Management, 485-499.
18. District Government. (2011, March 25). Provincial Disaster Management Authority-Muzaffargarh. Retrieved from http://www.floodmgarh.com/disaster.aspx.
19. Stancalie, G, Craciunescu, V & Irimescu, A 2007, ‘Contribution of Earth observation data supplied by the new satellite sensors in flood risk mapping’, Remote Sensing for Environmental Monitoring and Change Detection, Proceedings of Symposium HS3007 at IUGG2007, Perugia, July 2007, IAHS Publ. vol. 316.
20. Ho, LTK, Umitsu, M & Yamaguchi, Y 2010, ‘Flood Hazard Mapping by Satellite Images and SRTM Dem in the Vu Gia - Thu Bon Alluvial Plain, Central Vietnam’, Int. Archives of the Photogrammetry, Remote Sensing and Spatial Information Science, vol. XXXVIII, part 8, Kyoto Japan.
21. Skakun, S 2012, ‘The Use of Time-Series of Satellite Data to Flood Risk Mapping’, International Journal Information Models and Analysesvol.1, pp. 260-270.
22. Shaker, A, Yan, WY & El-Ashmawy, N 2012, ‘Panchromatic Satellite Image Classification for Flood Hazard Assessment’, Journal of Applied Research and Technology, vol. 10, pp. 902-910.
23. Asare-Kyei, D, Forkuor, G & Venus, V 2015, ‘Modeling Flood Hazard Zones at the Sub-District Level with the Rational Model Integrated with GIS and Remote Sensing Approaches’, Water, vol. 7, pp. 3531-3564.
24. Byun, Y, Han, Y & Chae, TB 2015, ‘Image Fusion-Based Change Detection for Flood Extent Extraction Using Bi-Temporal Very High-Resolution Satellite Images’, Remote Sensing, vol. 7, pp. 10347-10363.
25. Hu, Y, Huang, J, Du, Y, Han, P & Huang, W 2015, ‘Monitoring Spatial and Temporal Dynamics of Flood Regimes and Their Relation to Wetland Landscape Patterns in Dongting Lake from MODIS Time-Series Imagery’, Remote Sensing, vol. 7, pp. 7494-7520.
26. Malinowski, R, Groom, G, Schwanghart, W & Heckrath, G 2015, ‘Detection and Delineation of Localized Flooding from WorldView-2 Multispectral Data’, Remote Sensing, vol. 7, pp. 14853-14875.
27. Jensen, J. R. (1996). Introductory Digital Image Processing: NewJersey: Prentice-Hall.
28. Schumann, G.J.P.; Neal, J.C.; Mason, D.C.; Bates, P.D. The accuracy of sequential aerial photography and SAR data for observing urban flood dynamics, a case study of the UK summer 2007 floods. Remote Sens. Environ. 2011, 115, 2536–2546.
29. Digital Globe. (2010). the Benefits of the 8 Spectral Bands of World View-2.
30. Lillesand, T. M., and R. W. Kiefer. 1987. Remote Sensing and Image Interpretation. New York: John Wiley & Sons, Inc.
31. PCI INC., (1997): EASI/PACE, version 6.1, PCI Inc., Richmond Hill, Ontario, Canada
32. Lu D., Weng Q. (2007) - Survey of Image Classification Methods and Techniques for Improving Classification Performance. International Journal of Remote Sensing, 28: 823-870.
33. Marcus Borengasser, W. S. (2008). Hyper Spectral Remote Sensing, Principles and Applications. London: CRC Press.
34. Ahmed Shaker a, W. Y.-A. (2008). Flood Hazard Assessment using Panchromatic Satellite Imagery. The International Archives of the Photogrammetry, Remote Sensing and Spatial Information Sciences.
35. Kääb, A., 2011. Vehicle velocity from WorldView-2 satellite imagery. IEEE Data Fusion Contest 2011. 4p.
36. PDMA. (2017, March 12). Retrieved from Punjab Disaster Management Authority, Government of the Punjab: http://pdma.gop.pk/system/files/Losse_2010_%28Punjab%29.pdf
37. Datt, S. G. (2003). Economics of Flood Protection in India. Natural Hazards, 199-210.
38. M.J. Hammond, A. C. (2013). Urban flood impact assessment: a state of the art review. Urban Water, 14-29.
39. PDMA. (2017, March 12). Punjab Disaster Management Authority. Retrieved from http://pdma.gop.pk/part-I_3.pdf: http://pdma.gop.pk/part-I_3.pdf


