
Appraisal of Spatiotemporal Variations in Snow Cover Dynamics using Geospatial Techniques: A paradigm from Gilgit-Baltistan, Pakistan
Hania Arif 1, Syed Amer Mahmood2, Munawar Sabir1, Saira Batool1
1 Centre for Integrated Mountain Research, (Punjab University Lahore, Pakistan)
2 Department of Space Science (Punjab University Lahore, Pakistan)
* Correspondence: Hania Arif and rzzi.aftab@hotmail.com Citation | Arif.H , Mahmood.S.A, Sabir.M, Batool.S “Appraisal of Spatiotemporal Variations in Snow Cover Dynamics usingGeospatial Techniques: A paradigm from Gilgit-Baltistan, Pakistan”. International Journal of Innovations in Science & Technology, Vol 02 Issue 04: pp 209-223, 2020.
Received | Oct 28, 2020; Revised Nov 15, 2020 Accepted | Nov 21, 2021; Published | Nov
25, 2020.
Abstract.
Snow and glaciers in the mountain ranges of Hindu-Kush, Karakoram, and Himalayas (HKH), are supposed to be shrinking. Consequently, serious significances occur in respect of water accessibility for inhabitants of down streams. This investigation is an effort o identify the temporal variation in snow covers of Gilgit Baltistan (GB), northern Pakistan. For the calculation of the Normalized Difference Snow Index (NDSI) and estimation of snow- covered area (SCA), MODIS images for the period of 2000 to 2020 were used. Hunza, Astore, Gilgit, Diamir, Shyok, Ghanche, Skardu and Shigar are major sub-basins lying in GB with Hunza and Skardu being the mostly glaciated areas. Annual fluctuation in snow cover within GB was 10 to 80%. In accumulation season, from December to February, snow cover was almost 80% while in melting season, from July to September this area was reduced to 65-75%. The maximum and minimum Snow-Covered Area (SCA) detected in 2009 was almost 57687.85 km2 and 12083.40 km2 respectively. These results show fluctuations in SCA within the time duration of the last two decades.
Keywords:Gilgit Baltistan (GB); Normalized Difference Snow Index (NDSI); Annual fluctuation; Snow-Covered Area (SCA); MODIS images
INTRODUCTION
Pakistan has a large number of Glacier bodies which includes almost 5000 glaciers covering an area of around 13680 km2. Pakistan has the second-largest glacier which is known as the Siachen glacier [1]. Glaciers are known to be freshwater towers. In Pakistan, Glaciers play an important role in the irrigation system and serve as a major source of freshwater [2]. Snow and glaciers preserve fresh water in winters and the melting of this snow in the summer season feeds rivers and northern areas of Pakistan. The economy of Pakistan reliant on agriculture that has a 21% contribution to GDP [3]. In the past years, water security started becoming a severe worldwide problem and potable water supply was recorded to be decreasing gradually as per capita. This situation is getting worse with increasing population density mainly in heavily colonized areas such as Asia. In Pakistan, water usage is mainlydivided into three categories, i) 92% of water is used in agriculture, ii) 6% is used in households and iii) 2% of it is consumed by industries [4]. HKH mountain ranges are the main sources of natural freshwater reserves that fulfil the needs of millions of South Asian people living in the lower Indus [3,5,6]. The climatic condition of this area is semiarid especially in Indus downstream, the supply of water from glaciers is greatly essential for crop production in this area [7, 8]. In the context of clima e change, glacier retreats and surges are considered the primary indicator. In Upper Indus Basin (UIB), almost 65% of annual runoff is contributed by every seasonal and perennial snowfield [9-13].
About 90% of the Indus River flow originates from the Northwestern Himalayas, Karakoram and South-eastern Hindu Kush [14]. According to the IPCC (Inter- Governmental Panel on Climate Change) report in 2007, reduction in SCA throughout the past decades has resulted in the reduction of water availability and seasonal variation in
runoff has also been observed [15].
According to Gurung [16], snow and glacial melting is the major source of freshwater,especially in arid and semi-arid areas. Almost 17% population of the wholeworld is dependent upon snow melting for the sake of freshwater [17]. In IPCC 2013 report, theaverage increase in temperature was detected in HKH region because of global warming [18]. In HKH, SCA is directly affected due to an increase in temperature. Roughly 16% reduction has been observed in 12 years from 1990-2001 and a similar reductio reported during 2000-2008 [6, 8].
Remote sensing is playing a vibrant part in assessing the SCA in the whole world [19]. MODIS products for snow-cover are playing an important role in snow cover evaluation especially in remote and inaccessible areas thus replacing the traditional techniques of evaluation. Examination of the relationship between discharge and SCA dynamics in UIB concluded that different stream flows can be forecasted precisely using MODIS snow
product in the hydrological runoff model. MODIS products provide aid for the assessment of Spatio-temporal changes in SCA at different elevation zones and climatically different regions of UIB. Basin-wise analysis was conducted on MODIS snow-products [20].
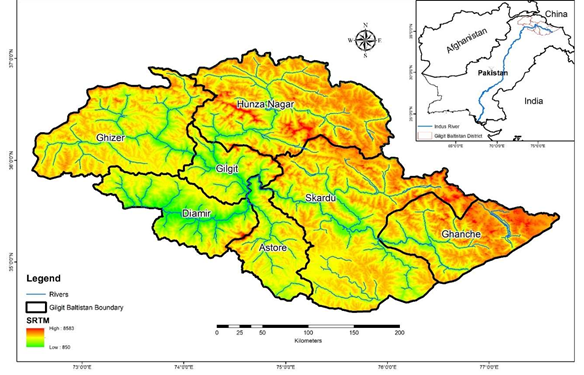
Figure. 1 Location Map of GB
1.1 Some Himalayan Glaciers are advancing rather than melting
Investigators have revealed that the mountainous regions of Karakoram Range are increasing in comparison to shrinking. In the HKH region, the main factors affecting the spread or retreat of snow and glaciers are aggregative debris, black carbon, rocks and mud-strewn surfaces. Snow and Glaciers are surrounded by mountains and enclosed in almost 2cm of debris which prevents melting. In the Tibetan Plateau, retreat rates are higher as compared to those of the Himalaya region. But in the Karakoram region, almost 40 to 50 per cent of snow and glaciers are stable and advancing especially on the northwestern side of the Himalaya region [21].
The effect of global warming in the HKH region has been controversial, in 2007, when an incorrect report from the Inter-Governmental Panel on Climate Change (IPCC) [16] claimed that glaciers of the Himalayan range might be vanished by 2035 owing to the greatly increased shrinking and melting rates. Due to that melting, a huge volume of water goes into the sea and the sea level rises very rapidly.
In Pakistan, Water demand has been increased exponentially in the last three decades due to the rapid increase in population, but water storage structures like dams, reservoirs and barrages etc. have not been constructed accordingly to cater to this demand. Pakistan also relies mainly on hydroelectric power generation for its electricity needs and it is unable to meet its electricity and freshwater demands due to the scarcity of water storage structures. This mismanagement of water resources has resulted in uneven distribution of electricity and freshwater among the provinces which is likely to raise conflicts within the country [22].
Water resource management is an essential component of the installation of the hydrological planning and structures [2,13]. There have been a lot of advancements in every discipline of science and technology including the field of hydrology. More and more complicated and advanced hydrological models have been and are being developed. Pakistan is a developing country with its economy majorly depending on food production which is more susceptible to climate changes. Pakistan does not have suitable monitoring structures for the forecast of extreme events or the evaluation of fluctuations in weather patterns. HKH important to research scientists for various reasons.
2. Material and Methods
- Satellite Data
The Moderate Resolution Imaging Spectro-radiometer (MODIS) dataset with are very a spatial resolution of 500m has been proved to be extremely appropriate in appraising snow covers of any basin covering an area of 10,000 km2 or more. MODIS 8-Day snow products were selected to calculate the snow cover area. Satellite datasets (MOD09A1) from 2000 to 2020 were used through Google Earth Engine (GEE) [22]. Digital Elevation Model (DEM) of Shuttle Radar Topography Mission (SRTM) with 30m resolution was employed to define topography, delineate boundaries of watersheds and in elevation analysis. The SRTM DEM tiles were acquired from an online USGS data portal and processed for GB Pakistan.
2.2 Methodology
The snow-product of MODIS used in this study was equipped with a spatial resolution of 500m. It was projected from to Universal Transverse Mercator (UTM) Zone 43N projection with WGS-1984 datum. The SCA was estimated by using 8 daily MODIS snow-products over the course of 2 decades pertinent to the study from the year 2000 to 2020. The estimation of the Snow-Covered Area (SCA) will be done by making use of products for the same period employing standard techniques of image processing.
MODIS
Satellite datasets (MOD09A1) from 2000 to 2020 were used through the google earth engine. Snow detection utilized the Normalized Difference Snow Index (NDSI) approach
using GEE from 2000 to 2020 which is an actual way to distinguish snow from other
features. In other words, the snow cover area was observed to be more enhanced [23].
NDSI= (Band 4 – band 6) / (Band 4 + band 6) (1) Band 4 = Green (sur_refl_b04)
Band 6 = MIR (sur_refl_b06)
NDSI gives the observation of the extent of SCA. In the visible portion of the spectrum (0.4 µm to 0.7µm), snow is indistinguishable from clouds pertaining to its brightness. However, the difference can be observed in longer wavelengths e.g. 1.6µm because snow appears darker than clouds due to the absorption of sunlight in that part of the spectrum. This behaviour of snow helps in differentiating between snow and clouds in remotely sensed data. Moreover, NDSI gives the strength to results of multiple band combinations, as, its value less than 0.4 (<0.4) indicates the presence of snow.
The estimation of SCA is done by using MODIS products from 2000 through 2020 with the assistance of Google Earth Engine. The development of data is done by taking the average of 8-day data acquired every month for GB and other districts. Theanalysis is conducted on the mean monthly and annually acquired data. Furthermore, SRTM DEM isused for the extraction of detailed analysis of the distribution of snow covers. All work is done through programming in GEE.
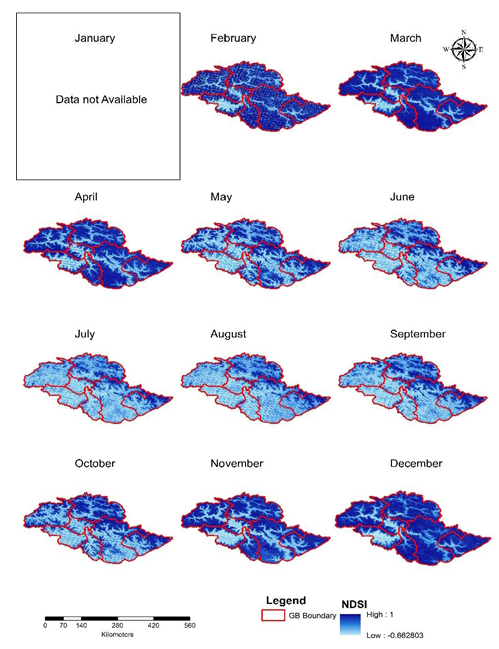
Figure. 2.1 Maps showing NDSI for the year 2000

Figure 2.2: In 2000 Snow Trend of GB
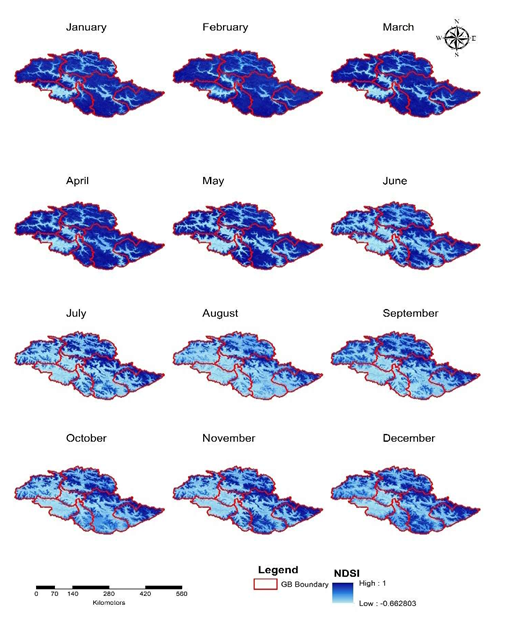
Figure. 4: Maps showing NDSI for the year 2010
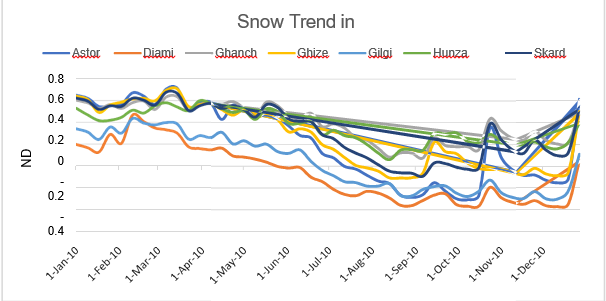
Figure 5: In 2010 Snow Trend of GB
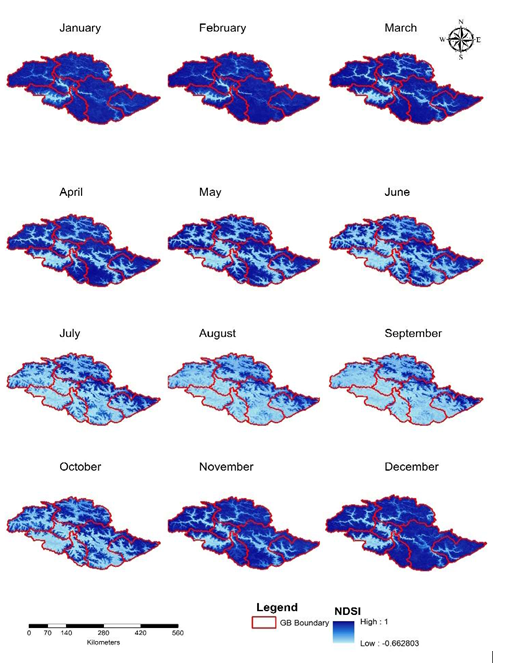
Figure 6: Maps showing NDSI for the year 2020
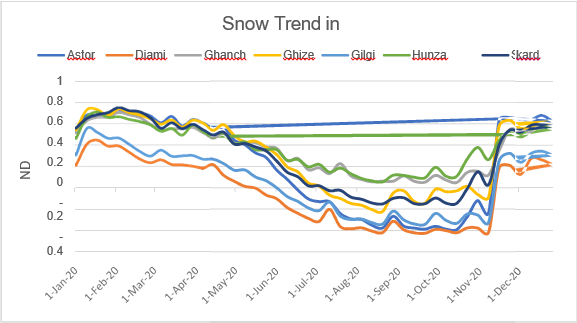
Figure 7: In 2020 Snow Trend of GB
Melting of ice-sheet and snow is continuous and a major contributor to river flow in Pakistan. The total snow in UIB of HKH consists of 18,495 glaciers [18]. On average, the extent of each glacier is 1.2 km2 that makes a total of 21,193km2 glacial area in UIB. 85% of annual flow in the Indus River comes from snow and glacier melting [11]. The trend of spatiotemporal variation in SCA on an annual basis was similar in all sub-basins lying within GB. The total estimated SCA in GB during the accumulation and melting period of 2009 was 57602.24 km2 and 12078 km2 respectively, which supports the fact that changing climate is one of the key factors that affect the melting season at higher altitudes.
Result and discussion.
3.1 Spatial-Temporal changes in the snow cover area of GB
The trend in the above graph shows that snow-covered areas in GB decrease and increase simultaneously. Indus River (IR) and its streams originate from the Karakoram and Himalayan regions alongside the northeastern and northern border of Pakistan. The Indus River system establishes a relationship between two natural reservoirs; the snowy mountains
and the groundwater containing alluvium in the Indus of Sindh and Punjab. IR and its tributary waters are the main source for agricultural processes and water supply for 130 million people. Owing to the melting of snow in the summer season (July, August and Sept) a huge volume of water is accessible in IR.
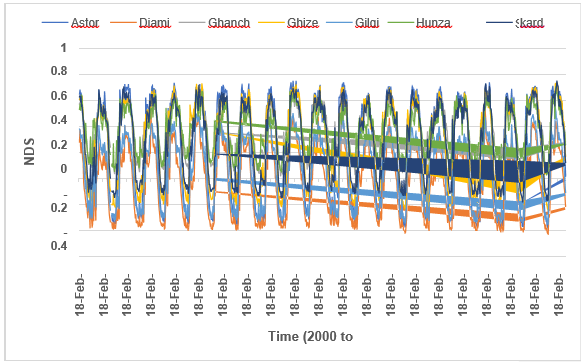
Figure 8: NDSI Spatio-temporal distribution in Gilgit Baltistan for the peri 2000 to 2020
3.2 Benefits of using Google Earth Engine
Johansen et al, regard the data in the GEE acquired from MODIS products as advantageous in many respects, especially in the mapping of large areas and long time series [25-27]. Furthermore, it makes the integration of annual and mean monthly NSDI time series easier and increases the accuracy of classification.
infrastructure to process large geospatial datasets [25]. The GEE platform is equipped with publicly available multi-resolution optical imagery, global digital elevation models, the entire Landsat, and the archives MODIS and many others. The code editor of GEE with its JavaScript, Python and API allows the development of simple scripts for graphical applications within a single browser environment [25]. GEE has been demonstrated as an effective and versatile tool for a number of geospatial applicationsGEE is a cloud-based browser platform equipped with cloud computing
As more remote sensing data and machine learning algorithms are integrated through GEE and data collection, shortened information is extracted from the data acquired from the results of remote sensing, even for further use. GEE makes data management easier as all sets of remote sensing data can be called through one or two lines of code [28]. Most RS products are already processed. A great advantage is that the remote sensing products do not need to be downloaded when work is being done on long term analysis. It is also efficient in saving time and space in comparison to manual work (without coding). GEE has enabled us to do statistical analysis on satellite images.
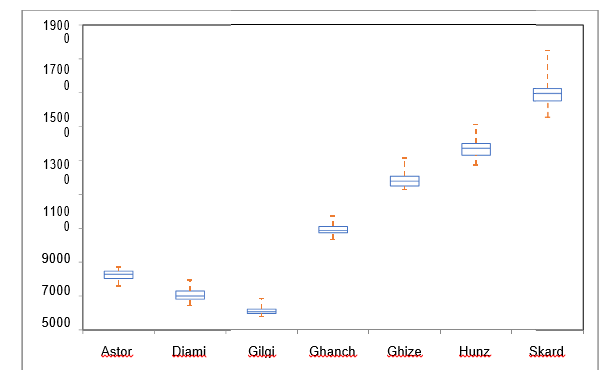
Figure 9: Box and whisker representation of Snow in GB Districts
Conclusion.
Snow cover dynamic plays a vital role in hydrological characteristics of any basin in terms of
annual or seasonal depletion and accumulation. Snow cover dynamic and associated
altitudinal variability of a basin determine the freshwater availability during the summer
season. In this investigation, we detected the snow cover area patterns in GB Pakistan over the past twenty years by examining the snow index (NDSI) based on the processing and analysis of MODIS images acquired from 2000 to 2020 using GEE. It was found that in GB, there is fluctuation in the trend of snow cover. However, this trend was observed to be decreasing while analyzing the data for the month of July and August each year. Remote sensing and GIS technologies are greatly helpful in the identification, mapping, estimation and exploitation of SCA spread over the spatial domain.
Conflict of interest. There exists no conflict of interest
REFRENCES
- Tahir, A., Chevallier, P., Arnaud, Y., Ashraf, M., and Bhatti, M.T., Snow cover trend and hydrological characteristics of the Astore River basin (Western Himalayas) and its comparison to the Hunza basin (Karakoram region), Science T talEnvironment, 2015, vol. 505, pp. 748–761.
- Abdul Jabbar, Arsalan Ahmed Othman, Broder Merkel, Syed E.Hasand, Change detection of glaciers and snow cover and temperature using remote sensing and GIS: A case study of the Upper Indus Basin, Pakistan, Remote Sensing Applications: Society and Environment, Volume 18, 2020, 100308
- Government of Pakistan, Pakistan Economic Survey 2015-16, Ministry of Finance, Islamabad, Pakistan, 2016.
- Hussain S., Mudasser M., Sheikh M.M., and Manzoor N., Climate change and variability in mountain regions of Pakistan implications for water and agriculture, Pakistan J. Meteorol., 2005, no. 2, vol. 4.
- Rees, G. and Collins, D.N., Regional differences in response of low in glacier-fed Himalayan rivers to climatic warming, Hydrology Process., 2006, vol. 2169, pp. 2157–2169.
- Immerzeel, W., van Beek, L.P.H., and Bierkens, M.P.F., Climate change will affect the Asian water towers, Science, 2010, vol. 5984, no. 328, pp. 1382–1385.
- Nüsser, , Schmidt, S., and Dame, J. Irrigation and development in the Upper Indus Basin, Mt. Res. Dev., 2012, vol. 1, no. 32, pp. 51–61.
- Vishakha Sood, Hemendra Singh Gusain, Sheifali Gupta, Sartajvir Singh, Sarabjit Kaur, Evaluation of SCATSAT-1 data for snow cover area mapping over a part of Western Himalayas, Advances in Space Research, Volume 66, Issue 11, 2020, Pages 2556-2567, https://doi.org/10.1016/j.asr.2020.08.017.
- Archer R. and Fowler H.J., Spatial and temporal variations in precipitation in the Upper Indus Basin, global teleconnections and hydrological implications, Hydrol. Earth Syst. Sci., 2004, vol. 1, no. 8, pp. 47–61.
- Hewitt, , Young, G.J., and David, C. Hydrological investigations at Biafo Glacier, Karakoram Range, Himalaya; An important source of Water for the Indus River, Annals of Glaciol., 1989, vol. 13.
- Hewitt , The Karakoram anomaly? Glacier expansion and the “elevation effect”, Karakoram Himalaya, Mount. Res. Develop., 2005, vol. 4, no. 25, pp. 332–340.
- Sirguey, , Mathieu, R., Arnaud, Y., and Fitzharris, B.B., Seven years of snow cover monitoring with MODIS to model catchment discharge in New Zealand, IEEE Int. Geoscience Remote Sensing Sympos. (IGARSS, 2009), Cape Town, pp. II-863–II-866.
- Tahir, A., Chevallier, P., Arnaud, Y., Ahmad, B., and Umer, E., Snow cover dynamics and hydrological regime of the Hunza River basin, Karakoram Range,Northern Pakistan, Hydrology Earth System Science, 2011, no. 15, vol. 7, pp. 2275–2290.
- Liniger, , Weingartner, R., and Grosjean, M., Eds., Mountains of the World: Water Towers for the 21st Century. Mountain Agenda for the Commission on Sustainable Development (CSD), Berne, 1998.
- IPCC Climate change 2007: an assessment of the intergovernmental panel on climate change, Assess Rep 446 (November), pp. 12–17.
- Gurung, R., Giriraj, A., Aung, K.S., Shrestha, B., and Kulkarni, A.V., Snow-Cover Mapping and Monitoring in the Hindu Kush-Himalayas, Kathmandu: ICIMOD, 2011.
- IPCC, 2013: Climate Change 2013: The Physical Science Basis. Contribution of Working Group I to the Fifth Assessment Report of the Intergovernmental Panel on Climate Change
- Barnett, T.P., Adam, J.C., and Lettenmaier, D.P., Potential impacts of a warming climate on water availability in snow-dominated regions, Nature, 2005, vol. 7066, 438, pp. 303–309.
- Shrestha, K., Ahlers, R., Bakker, M.B., and Gupta, J., Institutionaldysfunction and challenges in flood control along the trans-boundary Koshi River: A case study of the Kosi Flood 2008, Economic Polit. Weekly, 2010, vol. 45, pp. 45– 53.
- Barman, and Bhattacharjya, R.K., Change in snow cover area of Brahmaputra river basin and its sensitivity to temperature, Environ. Syst. Res., 2015, vol. 1, no. 4, pp. 1– 10.
- Dirk Scherler, Bodo & Manfred R. S., Spatially variable response of Himalayan glaciers to climate change affected by debris cover, Nature Geoscience, 2011 vol. 4, pages 156–159.
- Akhtar, N. Ahmad, M.J. Booij, The impact of climate change on the water resources of Hindukush–Karakorum–Himalaya region under different glacier coverage scenarios, Journal of Hydrology, Volume 355, Issues 1–4, 2008, Pages 148- 163, ISSN 0022-1694, https://doi.org/10.1016/j.jhydrol.2008.03.015.
- Dong Liang, Huadong Guo, Lu Zhang, Yun Cheng, Qi Zhu, Xuting Liu, Time-series snowmelt detection over the Antarctic using Sentinel-1 SAR images on Google Earth Engine, Remote Sensing of Environment, 2021
- Chen, M. Zhang, B. Tian and Z. Li, Extraction of Glacial Lake Outlines in Tibet Plateau Using Landsat 8 Imagery and Google Earth Engine, in IEEE Journal of Selected Topics in Applied Earth Observations and Remote Sensing, vol. 10, no. 9, pp. 4002-4009, Sept. 2017, DOI: 10.1109/JSTARS.2017.2705718.
- Bajracharya, R., Maharjan, S.B., and Shrestha, F., The Status of Glaciers in the Nepal Himalayas, 2011, ICIMOD.
- Gorelick , Hancher M., Dixon M., Ilyushchenko S., Thau D., Moore R. Google Earth Engine: Planetary-scale geospatial analysis for everyone Remote Sensing Environment, 202 (2017), pp. 18-27
- Kasper Johansen, Stuart Phinn, Martin Taylor, Mapping woody vegetation clearing in Queensland, Australia from Landsat imagery using the Google Earth Engine,Remote Sensing Applications: Society and Environment, Volume 1, 2015, 49, ISSN 2352-9385, https://doi.org/10.1016/j.rsase.2015.06.002.
- Patel, S., Ramachandran, P. A Comparison of Machine Learning Techniques for Modeling River Flow Time Series: The Case of Upper Cauvery River Basin. Water Resource Manage 29, 589–602 (2015). https://doi.org/10.1007/s11269-014-0705-0
- Haifa , Bahram S., Masoud M., Lindi Q., Sarina A., Brian B., Google Earth Engine for Geo-Big Data Applications: A Meta-Analysis and Systematic Review, ISPRS Journal of Photogrammetry and Remote Sensing, Volume 164, June 2020, Pages 152-170


