
Appraisal of Temporal Variations in Atmospheric Compositions over South Asia by Addition of Various Pollutants in Recent Decade
Ehsan UL Haq1, Farwah Waseem1 Abdul Baqi2
1 Department of Space Science (University of The Punjab).
2Goverment Degree CollegeUsta Muhammad, District Jaffarabad, Balochistan, Pakistan
* Correspondence: Ehsan UL Haq1 (rana42ehsan@gmail.com).
Citation | Haq.U.E, Waseem.F and Baqi. A“ Appraisal of Temporal Variations in Atmospheric Compositions over South Asia by Addition of Various Pollutant’s in Recent Decade”. International Journal of Agriculture & Sustainable Development, Vol 03 Issue 01: pp 01-15, 2021.
Received | Jan 12, 2021; Revised | Jan 29, 2021 Accepted | Feb 04, 2021; Published | Feb 08, 2021.
________________________________________________________________________
Abstract.
Atmosphere is an envelope of gasses and aerosols around the planet, 99% of the total mass of atmospheric gases resides within 32km from Earth’s surface in vertical column. From primordial era to current scenario composition of earth endured numerous drastic modifications. In last decade atmosphere had undergone a vigorous change by the addition of many pollutants in both natural and anthropogenic aspects. South Asia is a densely populated; masses here are in a transition state, these developing nations in this region considerably done enough damage to the atmosphere of south Asia by inserting multiple pollutants in atmosphere in a number of anthropogenic activities. These pollutants piled up as a serious danger for people around the globe like Methane (CH4), Sulphur Dioxide (SO₂), Carbon Monoxide (CO) Nitrogen Dioxide (NO2), Carbon Dioxide (CO2), Formaldehydes (HCHO) and tropospheric Ozone (O3) etc. “Environmental Remote Sensing” has arisen as a great tool of modern era to get fruitful and precise results to monitor these variations in atmospheric pollutants. The NASA’s (National Aeronautics and Space Administration), Geospatial Interactive Online Visualization ANd aNalysis Infrastructure (Giovanni) system provides access to a wide variety of NASA’s remote sensing data, Variety of environmental data types has permitted the use of Giovanni for different applications to define addition and increase in concentration of various pollutants. Spatio temporal variation of pollutants shows their concentration increased in last decade and in last three years the concentration boosted as compared to last seven years.
Keywords: Anthropogenic, Pollutants, Environmental Remote Sensing. National Aeronautics and Space Administration (NASA), Geospatial Interactive Online Visualization ANd aNalysis Infrastructure (Giovanni).
INTRODUCTION
The earlier atmosphere of earth was composed of gasses like Ammonia, Methane, water vapors and Neon while Oxygen was pretty lack in concentration in primordial state, which proved to be the most important biological component for the composition of current atmosphere [1]. The atmosphere consisting of primordial gases is highly dependent upon the gravitational pull of the planet, this gravitational force holds the atmospheric components together, thus some of energy and speed is required to escape this gravitational pull, this speed is expressed as escape velocity [2].
If we consider a formula to explain the primordial gases, velocity of the gas molecules is directly relational to (T/M)/2
T= Total temperature of the molecule in Kelvin (K)
M= Molar mass of the molecules
The temperature below 2000K and molar mass of a molecules greater than 10 would have velocity less than 11.3 km, shows molecule might be stayed in the primordial atmosphere, from this observation we can conclude; Hydrogen and Helium have molar mass less than 10 (2 and 4 respectively) therefore, these couple of gasses are lost in universe [3]. Methane, Ammonia, water vapors and Neon have molar mass greater than 10 therefore, these might be a part of primordial gases in the early atmosphere. The present-day main constituents of atmosphere are: molecular nitrogen (N2) & molecular oxygen(O2) and Noble gasses including Helium (He), Neon (Ne), Argon (Ar), Krypton (Kr), and Xenon (Xe). The variable constituents abundant in the concerned scenario are liquid vapor (H2O) and carbon dioxide (CO2) [4], rest of the components are in lesser amounts in current scenario: Nitrogen-Dioxide (NO2), Hydrogen-Sulfide (H2S), Sulfur-Dioxide (So2), Hydrogen-Chloride (Hcl), Molecular-Hydrogen(H2), Methane (Ch4), Carbon-Monoxide (CO), Ammonia (NH3), Nitrous-Oxide (N2o). Nitrogen (N2) occupies 78% of atmospheric composition in form of compounds like encompassing ammonium (NH+), nitrite (NO2−) and nitrate (NO3−). The conversion of nitrogen into these compounds is known as nitrification [4,5]. Ammonia is transformed by the bacterial reaction that was latterly used by the plants for growth, eventually that ammonia used by the plants produce N2. The petroleum products that are used in daily life to drive many things, produce oxides of nitrogen which finally leads to N2. Fog in urban areas is also nitrous oxides [5]. Natural processes including volcanic eruption and weathering of the rocks containing sulfur adds sulfur dioxide (SO2) and sulfate (SO4) into the atmosphere. Sulfur dioxide reacts with water to become highly corrosive sulfuric acid (H2SO4). In the beginning of industrial era, anthropogenic events by human added enough sulfur into atmosphere by burning of fossil fuels [6]. Industrial setups deposited sulfur and nitrogen into atmosphere which precipitated into sulfuric acid, nitrogen oxides and to nitric acid (HNO3), leading to acidic rain. The CO2 is attained trough many processes including the respiration of the living things, by the weathering of the rocks containing carbon and volcanic eruptions. The fossil fuel burning and advanced industrial development has increased the CO2 deposition in atmosphere, which resultantly increased the temperature of the troposphere, in a process commonly known as global warming. Many anthropogenic activities and multiple natural resources boosted the concentration of pollutants in atmosphere including tail pipe emission, volcanic eruption, fossil fuel burning etc. Anthropogenic activities have changed the chemical composition of our atmosphere that has influenced the Earth’s atmospheric composition [7].
Aerosols is defined as a fine suspension of the particles or liquid droplets in atmosphere, it might be natural or anthropogenic i.e., dust, wood land burning, fog, volcanic eruptions etc [8]. Primary aerosols have the particles that are directly developed into the gas, while the secondary one contains the particles which are evolved from the gas, there are many sorts of aerosols which are classified depending upon the particle size. The Aerosole Index (AI) can be discriminated accurately among absorbing and non-absorbing aerosols depending upon the extent of absorption of UV radiation [9]. The positive values that is related with AI is mostly the absorbing aerosols and vice versa. Anthropogenic aerosols are air pollutants, haze and smoke, these particles have the diameter normally greater than 1μm, and their significant settling velocity is enough to keep this stuff as a mixture.
Ozone is a trioxygen organic molecule, having pale blue color with a pungent smell, an allotrope of oxygen. It exists in low concentration in troposphere and have high concentration in ozone layer in stratosphere and engages maximum UV from sun [10].
NO + O3 → NO2 + O2
NO2 + O3 → NO3 + O2
C + 2O3 → C O2 + 2O2
3 SO2 + 3 H2O + O3 → 3 H2SO4
H2S + O3 → SO2 + H2O
O + O2 + M → O3 + M
O3 → O + O2 + kinetic energy
Sulphur dioxide is a toxic gas with smell like burnt matches. It originates from volcanos, scorching of fossil fuels & biomass, having formula SO2. It exists in Earth’s atmosphere in a very small concentration about 1 ppm [11].
2 SO2 + 2 H2O + O2 → 2 H2SO4
Several oxides of nitrogen exists, but here we are concerned with the nitrogen dioxide with formula NO2. It is the main agent used in production of nitric acid in industry, at high temperature. It is a reddish-brown gas with prominent irritating odor.
2 NO + O2 → 2 NO2
It is produced when nitric oxide reacts with the molecular oxygen.
2NO2 → 2NO + O2
NO2, is added into troposphere by some natural sources, bacterial respiration, lightning, volcanos and from stratosphere. It is prominent absorber of sunlight. Anthropogenic activities like, combustion in engine, fossil fuel, cigarette smoke, stoves and kerosene heaters also add NO2 in atmosphere [10, 11].
CO is a colorless, odorless, and tasteless gas, highly flammable having density less than air. It is a toxic gas, therefore it is known as a pollutant of atmosphere. It is produced during metabolism of animals and released in the atmosphere; it is a short lived spatially variable, which causes to produce tropospheric ozone [12].
CO + 2O2 + hν → CO2 + O3
Its sources are carbon oxidation, stove, and engine combustion, iron smelting, photochemical reactions in the atmosphere, volcano, wild fire and breakdown of hemoglobin.
Methane is the main part of the natural gas and considered as important fuel. It exists in form of gas in normal conditions. Mostly exists under the seafloor and produced in couple of processes i.e. geological and biological processes [13].
It is used in combustion
CH4 + 2 O2 → CO2 + 2 H2O
ΔH = −891 kJ/moll, at standard conditions
Reaction with water
CH4 + H2O ⇌ CO + 3H2
The concentration of atmospheric methane has been amplified by 150% since 1750. It owns a prime importance due to its greenhouse effect with huge global warming potential as compared with other agents of atmospheric heat trapping gases including CO2.
Formaldehyde is an organic compound with the formula H−CHO. It seems dated in the upper atmosphere, it is intermediate in oxidation of methane, which is produced in presence of sunlight by chemical reaction of methane with oxygen. Due to its wide use, volatility and toxicity, formaldehyde is dangerous for human health [8,11,13].
Carbon dioxide exists in the atmosphere of earth as a trace gas, it is colorless gas which is 60% dense than dry air, originate from volcano, carbonate rocks, ground water, rivers, lakes, ice caps, natural gas, tail pipe emissions and petroleum. It is odorless gas. It is also produced by the process of respiration, decay of organic matter and combustion of fossil fuel. It is also a greenhouse gas, by the industrial revolution, deforestation and combustion of organic materials enhanced the concentration of carbon dioxide which lead to the global warming [14].
The above discussion verifies that tropospheric concentration of multiple pollutants is formed by photochemistry of toxic pollutants in the atmosphere. Summer season is proved favorable to enhance the concentration of these pollutants. The elevated temperature act as catalyst in all chemical reactions like oxidation or reduction of hydrocarbons, and the oxides of nitrogen, carbon and Sulphur which are commonly known as Ozone precursors. These oxides play a vital role in the formation of pollutants through complex chemical reactions. Therefore, it is significant to investigate the participation of precursors in formation of pollutants. The optimum range of these precursors is important to maintain a healthy environment [15, 16, 17].
The specific objective of this research was to map the spatiotemporal variations in concentration of atmospheric pollutants from 2009 to 2019 over South Asia. It also aims at describing the contribution of precursors in pollutant formation by direct or indirect chemical reactions. This research will open new avenues for scientists and researchers to control various toxic pollutants for a sustainable regional environment.
Material and Methods.
Investigation site. South Asia cover-ups an area approximately 5.2 million km2 area that is 11.71% of the Asian continent by percentage or 3.5% of the world's area carrying huge number of messes on it, it is residential land of approximately 1.9 billion people.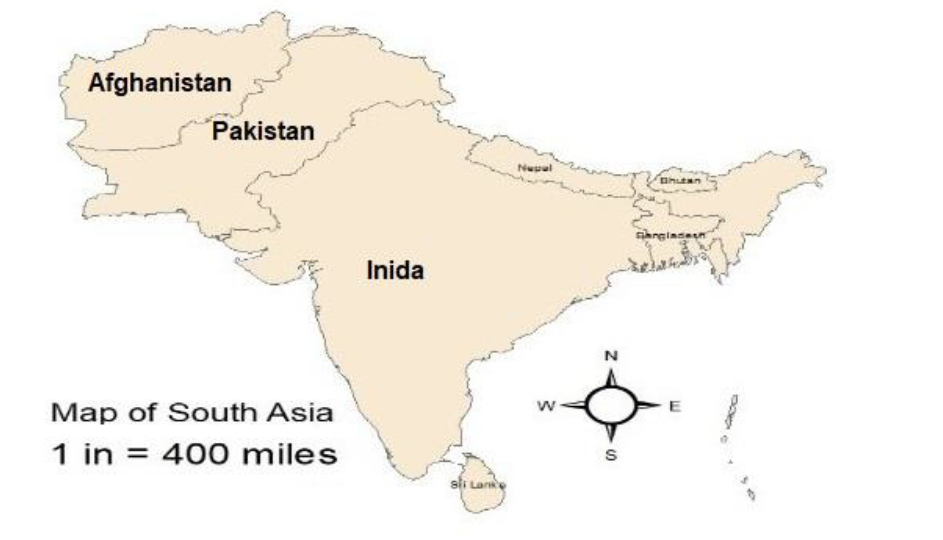
Figure 1. Map of south Asia.
This region consists of eight countries according to the South Asian Association for Regional Cooperation (SAARC) including Pakistan, India, Afghanistan, Bhutan, Nepal, Sri Lanka, Maldives and Bangladesh [18].
South Asia becomes extremely hot in April and May according to the native masses. Temperature rises upto 100°F, air becomes full of dust, ponds dry up. Just in couple of hours, rivers run-off their banks, latterly land dries out, this scenario seems dated every year in south Asia [18].
South Asia contains six foremost climate zones, the mountainous regions where snow remains present whole year, having coldest climate. It is a region of high temperature and mild rainfall and considered as semiarid zone, found in western end of the plain, extends to the desert along Pakistan and India.
Material and methods.
The Data was acquired from GIOVANNI (AIRS On boarded on AQUA & OMI On boarded on AQUA) data archives. Parameters regarding atmospheric compositions were defined from the above-mentioned data archives, to explain the variations in a decade over this huge area of South Asia. Remote sensing data from different satellites is vital for evaluating the natural events in our atmosphere at a regional scale or worldwide. This info is exploited to determine changes in enduring decade [20]. The assortment of environmental data types which allows an individual to use Giovanni for different purposes, like atmospheric composition etc. [21].
Aura is a successor to the atmospheric instruments. It was launched in a near polar orbit at an inclination of 98 degrees in a sun synchronous trajectory, orbits with a retro of 100 minutes. Aura repeat its ground track in 16 days, orbiting at a height of 705 km with local time to cross equator at 1.45 pm [39]. OMI (Ozone monitoring instrument), housed on Aura. This sensor is much accurate to differentiate among the aerosol categories, like smoke & dust etc. and provides data about tropospheric ozone, cloud coverage and its pressure. This instrument uses hyperspectral imaging in push-broom mode to observe the back scatter radiations illuminated by the sun in the visible and ultraviolet. It is efficient to monitor the atmospheric ozone, aerosols, atmospheric dust, NO2 & smoke [22].
Aqua was launched on May 4, 2002, having near polar sun-synchronous circular orbit, with inclination of 98.2º. It orbits at 705 km, local time to cross equator is 1:30 PM, its period is 98.8 minutes and repeat its cycle in 16 days with a swath width of 1650 km (± 49.5 degrees) [23].
AIRS (Atmospheric Infra-Red Sounder) with AMSU (Advanced Microwave Sounding Unit) mounted on Aqua, is helpful in observing the tropospheric column of the atmosphere, from ground level to the top of atmosphere [24]. Data from Giovanni is assembled with respect to its applicability regarding atmospheric composition.
Tier data parameters are as follows,
|
UV Aerosol Index |
Carbon Dioxide mole fraction in troposphere |
|
Methane Mole fraction in Air |
Sulphur dioxide tropospheric column |
|
Carbon monoxide Mole fraction in troposphere |
Ozone Mole fraction in Air |
|
Formaldehydes Tropospheric column |
Nitrogen dioxide tropospheric column |
|
Air temperature |
Result and discussion
The results show that spatio-temporal variations in atmospheric composition occurred by an increase in concentration of multiple pollutants in last decade. The area was monitored in four-time frames of a year, pre-monsoon, monsoon, post-monsoon and winter or dry season.
Aerosol Index
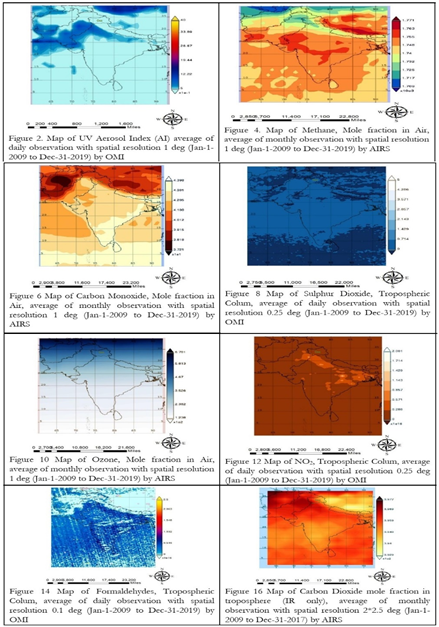
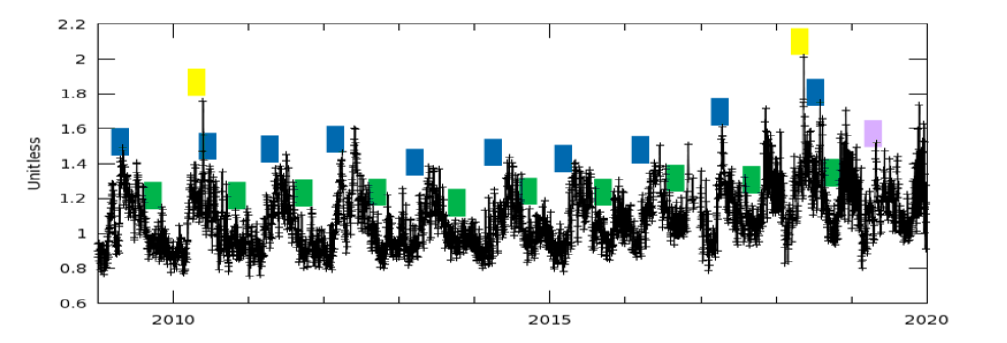 Figure 3. Temporal variation of UV Aerosol Index (AI) average of daily observation with spatial resolution 1 deg (Jan-1-2009 to Dec-31-2019) by OMI
Figure 2, is showing that the concentration of aerosols increased in bulk on eastern, north-eastern side, costal line at south and North-Western side of Pakistan, and western side of India along Himalayan basin. It is due to wind system in subcontinent and 4 seasons that seems dated every year. In South Asia, the month of April and May is quite hot and dry, winds in these couple of months changes their direction from sea towards land, known as easterlies, wind gusts i.e., huge mass of air invades into plan area of subcontinent with continuous increase in temperature. This area looks like a burning Incinerator during these months, it’s also harvesting time of Rabi crops, dust from these crops harvesting and smoke after burning their residue, make environment full of multiple aerosols. Winds changes their direction from land towards sea (Westerlies) in October and November which is considered a stable condition but with full smokey stuff, post harvesting of kharif crop in these months (post monsoon) the residue burn, their smoke and different hazardous gasses originate during burning and suspend in to the atmosphere and make the complete environment full of aerosols.
Methane

Figure 5. Temporal variations of Methane, Mole fraction in Air, average of monthly observation with spatial resolution 1 deg (Jan-1-2009 to Dec-31-2019) by AIRS
Figure 3 shows the temporal distribution of aerosols during last decade, the peaks along blue represents UV-Al maximum in this season later on in monsoon precipitation at its peak and this area faces heavy down pour in the month of June, July and August that wash out the pollutants from atmosphere. The dips in green bars represent the concentration of aerosols after monsoon which is pretty low as compared to pre-monsoon. In post-monsoon (Oct and Nov) winds get calm and precipitation is low, peaks in figure show heavy loading in post-monsoon which leads to Smog, later on in winter again precipitations started, due to rain, dew and frost, these pollutants settled down and by the end of each year, their graph is at its lowest value.
Hotspots in Figure 4 are showing the spatial distribution of methane over south Asia, orange shaded area in India and south western border among India and Pakistan shows methane amalgamation in air, as we know, it’s a natural gas, that exist in marshy areas and under sea floor which react with water. Figure 5 is showing the annual variations in methane concentration in recent decade, methane concentration was noted low in winter season. The peaks in each year in pre-monsoon show a small loading of methane, later on in mon-soon, methane particles were washed out due to heavy rain, in post-monsoon we can see that figure got maximum height in each year, that shows huge concentration of methane in post monsoon. But overall representation of graph is showing an increasing trend in concentration of methane as its increased by 150% since 1970.
Carbon monoxide

Figure 7. Temporal variations of Carbon Monoxide, Mole fraction in Air, average of monthly observation with spatial resolution 1 deg (Jan-1-2009 to Dec-31-2019) by AIRS.
Map of carbon monoxide in Figure 6 is showing its spatial distribution. Figure 7 is showing the variations of CO in air in recent decade, the change in concentration was observed from 42 to 44 ppbv in air. In context of seasonal variations, it remains same whole year except in winter (low in concentration) as shown in figure 6. It is a main source for the production of tropospheric Ozone which is a highly toxic gas. Figure 7 is showing an increasing trend of CO from 2009 to 2019 which may be due to certain reactions of atmospheric fresh oxygen with carbon residuals in the atmosphere. The concentration of Carbon aerosols is increasing in the atmosphere due to anthropogenic activities which may interact with oxygen.
Sulphur Dioxide
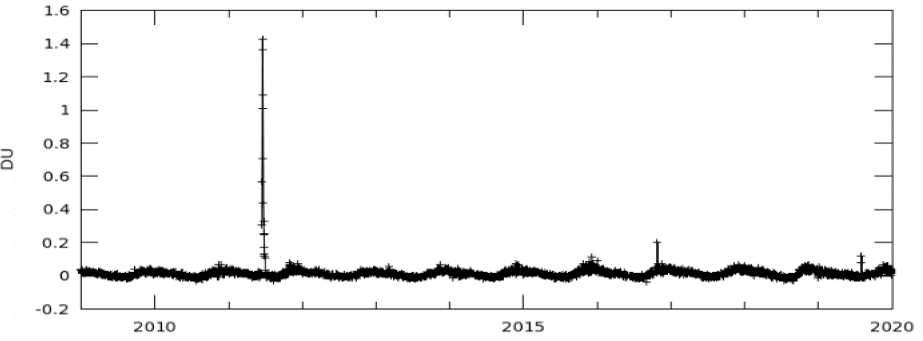
Figure 9. Temporal variations of Sulphur Dioxide, Tropospheric Colum, average of daily observation with spatial resolution 0.25 deg (Jan-1-2009 to Dec-31-2019) by OMI
Figure 8 shows that the concentration of Sulphur Dioxide has been increased in recent decade, being a short-lived pollutant it reacts with water vapor’s which leads to formation of Sulphuric acid (acidic rain). Figure 9 shows temporal distribution in concentration of Sulfur dioxide which is observed changed from 0.05 to 0.2 DU. Only 30% of this pollutant is produced in natural processes rest of the 70% is the reward of anthropogenic activities.
Ozone

Figure 11. Graphical Representation of Ozone, Mole fraction in Air, average of monthly observation with spatial resolution 1 deg (Jan-1-2009 to Dec-31-2019) by AIRS
Ozone is an oxidizing agent, tropospheric ozone is pretty harmful for health, but its concentration is increased from 280 to 318 ppbv in recent decade as shown in Figure 11. This figure shows that seasonal variation of ozone shows its decreasing concentration with the start of monsoon which raised again from post monsoon in winter. Figure 10 shows spatial distribution of ozone and its maximum concentration over populated area in sub-tropical region where anthropogenic activities were observed at peak (i.e. mega cities of subcontinent).
Nitrogen Dioxide
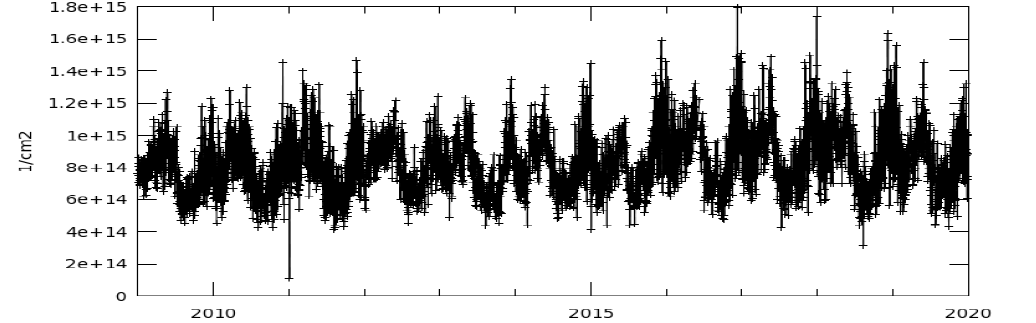
Figure 13. Temporal variations of Nitrogen Dioxide, Tropospheric Colum, average of daily observation with spatial resolution 0.25 deg (Jan-1-2009 to Dec-31-2019) by OMI
Nitrogen dioxide is a prime aerosol, and an absorber of sunlight, NO2 in troposphere is a prominent pollutant. Its reaction with other atmospheric components (water vapors) results in formation of nitric acid and the sun light act as a catalyst. Figure 12 shows its spatial distribution over mega cities or densely populated area of south Asia (where maximum anthropogenic actives are undertaken). Figure 13 shows the temporal variation in Nitrogen Dioxide in recent decade, which raised in troposphere in pre and post monsoon. In monsoon, pollutants washed out so its concentration in troposphere seems low in winter and the tendency of this pollutants raised gradually up to pre monsoon.
Formaldehydes (HCHO)
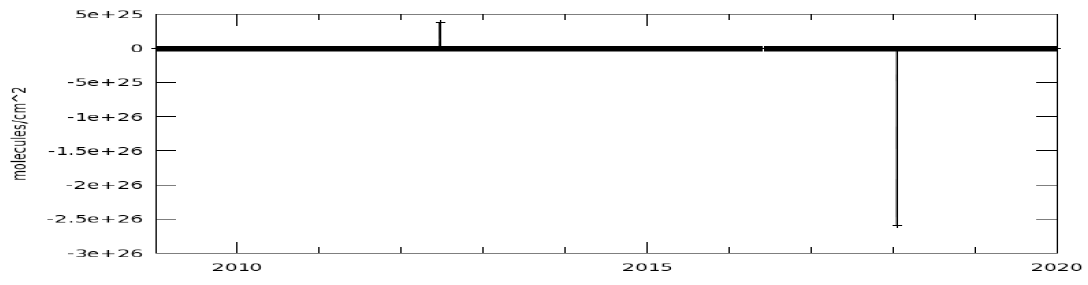
Figure 15. Temporal variations of Formaldehydes, Tropospheric Colum, average of daily observation with spatial resolution 0.1 deg (Jan-1-2009 to Dec-31-2019) by OMI
HCHO is toxic gas produced in the oxidation of methane, it is small in concentration in troposphere. The concentration of this pollutant is totally dependent upon temperature. Figure 14 and 15 shows its spatial and temporal variations in the previous decade, as it exists in small concentration therefore no considerable variations are observed.
Carbon Dioxide

Figure 17. Temporal variations of Carbon Dioxide mole fraction in troposphere (IR only), average of monthly observation with spatial resolution 2*2.5 deg (Jan-1-2009 to Dec-31-2017) by AIRS

Figure 18. Carbon dioxide emission (KT) in south Asia (1990-2017). Source: World Bank Report
Carbon dioxide is a greenhouse gas, originate from several natural resources and anthropogenic activities, its concentration in troposphere was raised in last decade which caused global warming, Figure 17 is showing how its concentration was raised from 2010 to 2017 between a range 390 to 404 PPM in troposphere. The seasonal variations of this pollutant observed at peak in pre-monsoon and monsoon. Figure 16 shows spatial distribution of CO2, in Pakistan and on border of Indian and Pakistani Punjab, this area is rich in agriculture and industry in Pakistan, so maximum production of CO2 added from this area in to atmosphere. The anthropogenic activities include industrial waste, tail pipe emission, burning of crop residue and high temperature that work as a catalyst. According to WORLD BANK report, the annual emission of CO2, has been enhanced from 1994 to 2014 from 600T to 2500T (T=TON) as shown Figure 18.
Air temperature

Figure 19. Map of Air temperature, average of monthly observation with spatial resolution 1 deg (Jan-1-2009 to Dec-31-2019) by AIR

Figure 20. Temporal variation of Air temperature, average of monthly observation with spatial resolution 1 deg (Jan-1-2009 to Dec-31-2019) by AIRS
Figure 19 is showing the spatial distribution of temperature of air and Figure 20 shows temporal variation of atmospheric temperature. It works as catalyst in production of different pollutants (aerosols) already discussed in previous sections.
Conclusion.
There exists a global race to build regional economies through industrialization. This industrial revolution is responsible for addition of various toxic gasses in our environments which are dangerous for human survival and sustainable development. These toxic pollutants have become a major cause of global warming, smog and acid rain. This research shows that the CO and CO2 causes global warming and oxides of sulfur and nitrogen cause acid rain when reacts with water droplets present in atmosphere. Therefore, efficient ways are required to handle these pollutants to save our environment for a green future. Greenery is the best way to overcome concentration of these pollutants in atmosphere.
Acknowledgement. We would like to acknowledge the profound services of NASA for providing reliable global data at Giovanni website (http://giovanni.gsfc.nasa.gov/).
Author’s Contribution. I collected data from GIOVANNI and define its spatio-temporal domains, my co-author’s did proof reading helped to organize data and content writing.
Conflict of interest. There is no conflict of interest for publishing his research paper in IJIST.
Project details. NIL
REFERENCES
1. A. G. Streng, ""Tables of Ozone Properties".," Journal of Chemical Engineering Data., vol. 6, issue no. 3, pp: 431–436, 1961.
2. Brown, Geoffrey. The inaccessible earth: an integrated view to its structure and composition. Springer Science & Business Media, 2012.
3. L. Chan, L. H.Y., K. Lam and T. Wang, "Analysis of seasonal behavior of tropospheric Ozone at Hong Kong.," Atmospheric Environment, vol. 32, pp: 159-168, 1998.
4. Vignais, Paulette M., and Bernard Billoud. "Occurrence, classification, and biological function of hydrogenases: an overview." Chemical reviews, Vol 107, issue no. 10 pp: 4206-4272, 2007.
5. Iqbal, S. A., and Y. Mido. Chemistry of Air & Air Pollution. Discovery Publishing House, 2010.
6. Carvalho, M. Rosário, António Mateus, João C. Nunes, and José M. Carvalho. "Origin and chemical nature of the thermal fluids at Caldeiras da Ribeira Grande (Fogo Volcano, S. Miguel Island, Azores)." Environmental Earth Sciences 73, no. 6 (2015): 2793-2808.
7. Flannery, Tim. The weather makers: The history and future impact of climate change. Text Publishing, 2008.
8. Alastuey, A., X. Querol, S. Rodriguez, F. Plana, A. Lopez-Soler, C. Ruiz, and E. Mantilla. "Monitoring of atmospheric particulate matter around sources of secondary inorganic aerosol." Atmospheric Environment 38, no. 30 (2004): 4979-4992.
9. Torres, Omar, AapoTanskanen, Ben Veihelmann, ChangwooAhn, Remco Braak, Pawan K. Bhartia, PepijnVeefkind, and PieternelLevelt. "Aerosols and surface UV products from Ozone Monitoring Instrument observations: An overview." Journal of Geophysical Research: Atmospheres 112, no. D24 (2007).
10. Burrows, John P., Mark Weber, Michael Buchwitz, Vladimir Rozanov, Annette Ladstätter-Weißenmayer, Andreas Richter, RüdigerDeBeek et al. "The global ozone monitoring experiment (GOME): Mission concept and first scientific results." Journal of the Atmospheric Sciences 56, no. 2 (1999): 151-175.
11. Iqbal, S. A., and Y. Mido. Chemistry of Air & Air Pollution. Discovery Publishing House, 2010.
12. McAllister, Jerome W., Gunter A. Kohler, and Virtudes R. Lund. "Carbon monoxide monitoring system." U.S. Patent 4,256,694, issued March 17, 1981.
13. Dentener, F., D. Stevenson, J. Cofala, R. Mechler, M. Amann, P. Bergamaschi, F. Raes, and R. Derwent. "The impact of air pollutant and methane emission controls on tropospheric ozone and radiative forcing: CTM calculations for the period 1990-2030." (2005).
14. Madsen, Jørgen, Bjarne Schmidt Bjerg, Torben Hvelplund, Martin Riis Weisbjerg, and Peter Lund. "Methane and carbon dioxide ratio in excreted air for quantification of the methane production from ruminants." Livestock Science 129, no. 1-3 (2010): 223-227.
15. J.Allen, "Tango in the Atmosphere: Ozone and Climate Change," NASA Earth Observatory, 2004.
16. J. R. Barker, Problems and Progress in Atmospheric Chemistry, vol. 3, Advanced Series in Physical Chemistry, Ed., Singapore: World Scientific, 1995.
17. J. M. Prospero, P. Ginoux, O. Torres, S. E. Nicholson and T. E. E. Gill, "nvironmental characterization global sources of atmospheric soil dust identified with the Nimbus 7 total ozone mapping spectrometer (TOMS) absorbing aerosol product.," Rev. Geophys, vol. 40, p. 1002, 2002.
18. Shrotryia, Vijay Kumar. "An Introduction to Human Well-Being, Policy and South Asia Region." In Human Well-Being and Policy in South Asia, pp. 1-18. Springer, Cham, 2020.
19. Flannery, Tim. The weather makers: The history and future impact of climate change. Text Publishing, 2008
20. Xue, Yong, Yingjie Li, JieGuang, Xiaoye Zhang, and Jianping Guo. "Small satellite remote sensing and applications–history, current and future." International Journal of Remote Sensing 29, no. 15 (2008): 4339-4372.
21. Acker, James, RadinaSoebiyanto, Richard Kiang, and Steve Kempler. "Use of the NASA Giovanni data system for geospatial public health research: example of weather-influenza connection." ISPRS International Journal of Geo-Information 3, no. 4 (2014): 1372-1386.
22. Boersma, K. F., H. J. Eskes, J. P. Veefkind, E. J. Brinksma, R. J. Van Der A, M. Sneep, G. H. J. Van Den Oord et al. "Near-real time retrieval of tropospheric NO 2 from OMI." (2007).
23. Parkinson, Claire L. "Aqua: An Earth-observing satellite mission to examine water and other climate variables." IEEE Transactions on Geoscience and Remote Sensing 41, no. 2 (2003): 173-183.
24. Gautier, Catherine, Yang Shiren, and Mark D. Hofstadter. "AIRS/Vis near IR instrument." IEEE transactions on geoscience and remote sensing 41, no. 2 (2003): 330-342.


