
Appraisal of Trans Indus, Marwat-Khisor and Bhittani Ranges Thrusting through Geo-spatial Techniques
Iftekhar Hussain1, Syed Amer Mahmood1, Saira Batool2, Areeba Amer3, Mareena Khurshid4,
Imran Saddique Kaukab1,
1 Department of Space Science University of the Punjab Lahore.
2 Centre for Integrated Mountain Research (CIMR) University of the Punjab Lahore.
3 College of Earth & Environmental Sciences (CEES)University of the Punjab Lahore.
4 Department of Geography University of the Punjab Lahore.
* Correspondence: Saira Batool and Email: sairabnaqvi5@gmail.com
Citation |Azeemi. I, Mahmood .S.A, Batool.S,Amer.A, Khursheed.M, Kaukab I.S, Appraisal
of Trans Indus, Marwat-Khisor And Bhittani Ranges Thrusting Through Geo-Spatial
Techniques, International journal of Innovations in Science & Technology, 2020 Vol 2 Issue
3 PP 68-74
Received |July 22, 2020; Revised | Aug 15, 2020; Accepted | Aug 16, 2020; Published |
Aug 20, 2020._____________________________________________________________
Abstract.
Himalayan mountain belt was created by the Indo–Eurasian collision. The length of
this seismically active mountain belt is almost 2500 km. Southern partition of this zone is
marked by the main frontal thrust. We computed the isobase, relative relief, incision, vertical
dissection and drainage density maps of the study site. Drainage density is inversely
proportional to the rest of computed parameters. Drainage density is less where the
incision/deep cutting is high. Pezu and north western parts of the study site are observed
vulnerable to tectonic activity and high risks. These sites are the adjoining parts of active
faults. The rates of morphological changes and the combination of stripping processes are
determined through Surface dynamics maps (SDM). Although it is a handy tool used to
evaluate erosion conditions of sags or sub basins. Remote sensing and GIS techniques
proved efficient for appraisal of thrust in Marwat Kishore and Bhittani ranges.
Keywords: Thrusting, Relative Relief, Isobase coding, Drainage density.
Introduction
The Himalayan mountain belt was created by the Indo–Eurasian collision. The
length of this seismically active mountain belt is almost 2500 km. Southern partition of this
zone is marked by the Main Frontal Thrust (MFT) [1,2]. The growth and development of
MFT is necessary to unwind the process of deformation of mountain belts and preparation
of major jeopardy of future related to active tectonics of these belts. The data gained
through geodesy suggests that the Indian plate move at the rate of 35mm/year in
northwestern boundary while 38mm/year in northeastern direction [3]. According to Lave
and Avouac most of the Himalayan deformations were recorded in MFT [4]. The deformation was deliberated 9 ± 3 mm/year in the northwestern, 21 ± 1.5 mm/year in central and 23.4 ± 6.2 mm/year in eastern Himalayas [4,5,6,7,8]. The MFT is a youngest frontal thrust and a narrow region located in the central and eastern Himalayas which has a high degree of cross-section; however, a low degree of cross-sectional taper is located in the western Himalayas which is 100 km wide [9,10]. Moreover, the Indian plate rotates in an anticlockwise direction shifting the trend from NW-SE of central and eastern Himalayans to NE-SW located in Pakistan [11]. Himalayan arc is mapped in Figure 1.
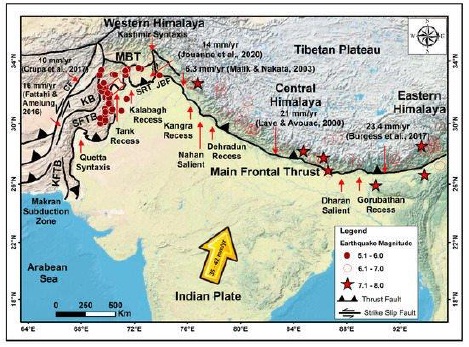
Figure 1. Himalayan arc observed through satellite imagery Source:https://www.mdpi.com/2072-4292/12/20/3362/htm.
Several historic earthquakes which had a magnitude higher than seven were associated with the MFT. These earthquakes had the ability to rupture the surface of land. The Himalayans located in the north of Pakistan elongates from Jhelum fault in east to western Ophiolite Belt. The main frontal thrust of Western Himalia is classified as salt Indus ranges and trans Indus ranges. According to geodetic data, southward translation of western salt rang is 10mm/year and central salt range is 5mm/year. However, Kalabaghfault zone displaced the Trans Indus Range (TIR) at the rate of 5.3 mm/year. Blisniuk et al. and Abir et al. [12] suggested that the basal detachment is formed along the MFT by the salt range in the west of Himalayas. Chronostratigraphic studies proposed that western Himalayans are youngest collisional zone which is deforming actively. The trans indus ranges are further sub-divided into the Surghar, Manzai, Marwat–Khisor, and Bhittani Ranges (Figure 2). These ranges portray condensational deformation and show lateral structural variations along the salient faults. Moreover, transpersonal deformation occurred along strike–slip faults [10]. The Kalabagh and Tank faults are separated by Marwat–Khisor salient in the TIR.
The main objective of this study is to determine the deformation pattern,
displacement rate and landscape development relative to active tectonics of western
Himalayans.
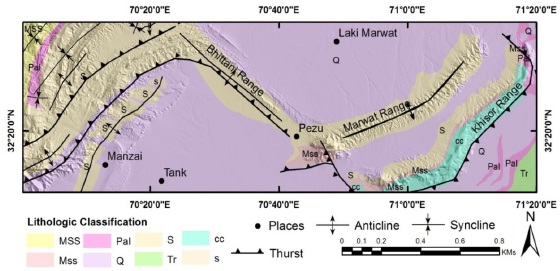
Figure 2. Fault setting in the study stie.
MATERIALS AND METHODS
Study Area
The area under study covers about 7850 square kilometers of Bannu, Kalabagh,
Lakki Marwat, Pezu, Tank and D.I.Khan (Figure 3).The study area is situated about 200
Kilometers away from Peshawar towards south-southwest.
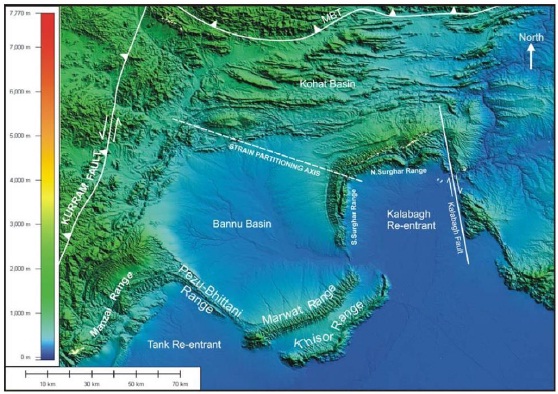
Figure 3. Ranges present in the study site
Data Acquisition and Processing
Data was obtained through geological fieldwork for geological mapping of trans
Indus ranges and geological cross-sections were established to comprehend geometry and
structure of Trans Indus range. Two types of data were used for active tectonic mapping
which include vector data and Shutter Radar Topographic Mission (SRTM) Digital Elevation
Model (DEM) [13].
Digital Elevation Model (DEM)
DEMs are helpful in determining geographic information based on digital relief
maps. However, DSM (Digital Surface Model) was used in landscape mapping and city
modeling.
Longitudinal River Profile analysis
A flow direction of any topographic region is determined through D8 algorithm. In
this method, flow from one pixel to its neighboring pixels is tracked. D8 flow grid is
generated from a depression less DEM. This method is used to determine flow from flat to
reducing valleys. Incision determine the nature of geology, soft rocks determine erosion
while hard rocks lead to vertical cutting/incision. Relative relief describes the variation in
slop, high relative relief leads to gentle slopes while low relative relief describes the steep
slopes. Drainage density was computed using hydrological tools on digital elevation model,
where large drainage density leads to rough topography.
Concavity and steepness
Stream power model is used to estimate the drainage area and channel gradient
(Whipple and Kirby, 2001; Kerby and Howard 1983):
dz / dt =U(x, t) − KAmSn Eq. 1
Where dz/dt is the rate of change in variation of channel’s elevation, U determine
the rate of uplift in rock, A describe the area of drainage, S is the slope of each channel, K is
the coefficient of erosion and m and n describes the hydrology and hydraulic geometry
respectively. The value of dz/dt is zero in steady state conditions. To compute the slope of
channel, following expression is used,
1/ ( / ) ( / ) n m n S U K A− = Eq. 2
Equation 2 describes a relationship between the area of drainage line and the channel
gradient which is commonly observed in natural conditions.
s S k A − = Eq. 3
Here the factor (U/K)1/n determine the steepness, ks and m/n is the concavity. We
simply applied log on both sides of equation 3,
log log log s S = − A+ k Eq. 4
Where θ determine the concavity and Ks is the steepness which may be computed by
regression in log plot of slope and drainage area.
RESULTS AND DISCUSSIONS
Hack gradient index and geomorphic indices were analyzed in the study site in order to interpret relative uplifting, regional topography and crustal slanting within the region. The concavity (θ) and steepness (ks) indices were calculated using stream power law by establishing stream longitudinal profile analysis on 116 small and large channels which were extracted through the SRTM DEM. We applied regression models to active tectonic signals from streams in order to determine concavity indices and steepness. The steepness index values fluctuate between high or low concavity. Spatially inconstant lithologies, or spatially variable relative bedrock uplift rates causes such a fluctuating zone.

Figure 4. Drainage Density Map at 4Km window.
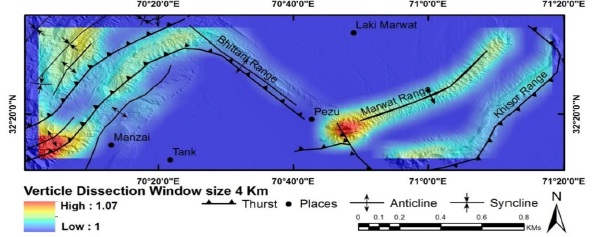
Figure 5. Vertical dissection window at 4Km window.
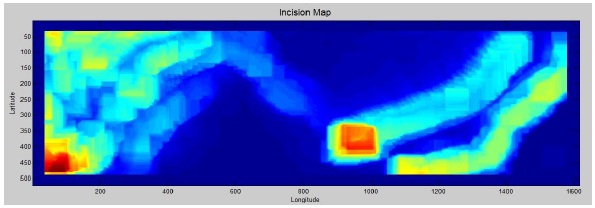
Figure 6. Incision Map at 4Km window.
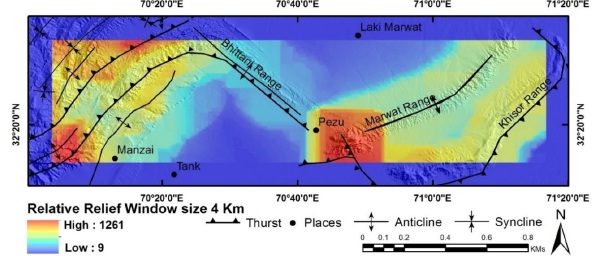
Figure 7. Relative Relief Map at 4Km window.

Figure 8. Isobase Coding Map at 4Km window.
Figures 4-8 determine the isobase, relative relief, incision, vertical dissection and drainage density maps of the study site. Drainage density is inversely proportional to the rest of computed parameters. Drainage density is less where the incision/deep cutting is high. Pezu and north western parts of the study site are observed vulnerable to tectonic activity and high risks. These sites are the adjoining parts of active faults. The rates of morphological changes and the combination of stripping processes are determined through Surface dynamics maps (SDM). Although it is a handy tool used to evaluate erosion conditions of sags or sub basins. Differential erosion and neotectonics activity were found behind the uplift of study site due to abundant precipitation in summer as well as in winter and tectonic domination over climate and erosion.
Author’s Contribution. All authors contributed equally.
Conflict of interest. Authors declare no conflict of interest for publishing this manuscript in IJIST.
Project details. NIL
REFRENCES
1.Abbott, L.D., Silver, E.A., Anderson, RS., Smith, R, Ingle J.C., Kling, S.A., Haig, n, Small, E. Galewsky, J" and Sliter, W., Measurement of tectonic surface uplift rate in a young collisional mountain belt: Nature, v. 385, pp: 501-507, 1997.
2. Ahnert, E, Functional relationships between denudation relief, and uplift in large midlatitude basins: American Journal of Science, v. 268, p. 243-263, 1970.
3. Anderson, RS., Evolution of the Santa Cruz Mountains, California, through tectonic growth and geomorphic decay: Journal of Geophysical Research, v. 99, issue. B10, pp: 20161-20179, 1994.
4. Anderson, RS., and Humphrey, N.F, Quantitative Dynamic Stratigraphy: Englewood Cliffs, NJ, PrenticeHall, 1990, pp. 349-361.
5. Burbank, D. Rates of erosion and their implications for exhumation. Mineralogical Magazine, Vol 66, issue 1, pp: 25-52, 2002.
6. Blythe, Ann & Burbank, Douglas & Farley, K. & Fielding, Eric.. Structural and topographic evolution of the central Transverse Ranges, California, from apatite fissiontrack, (U-Th)/He and digital elevation model analyses. Basin Research. Vol 12, pp: 97114, 2000.
7. L.L., and Lillie, RJ., ed., Tectonics and Geophysics of the Western Himalaya, Geological Society of Burbank, Geological society of America, Vol 232, pp: 176-210, 1989.
8. Burbank, D.W., and Beck, RA.,., Interactions of growing folds and coeval depositional systems: Basin Research, v. 8, issue 1, pp. 199-223.
9. Gomberg, J.S., Tectonic deformation in the New Madrid seismic zone; inferences from map view and cross sectional boundary element models: Journal of Geophysical Research, v. 98, p. 6639-6664, 1993.
10. Evans, I. S. Spatial Analysis in Geomorphology. Harper and Row, London, General geomorphometry, derivatives of altitude, and descriptive statistics. In: Chorley, R.J. (Eds.), 1972, pp. 17-90.
11. Strahler, A. N.: Quantitative analysis of watershed geomorphology. Transactions of the American Geophysical Union Vol 8, issue 6, pp: 913–920, 1957.
12. Strahler, A.N., “Hypsometric (area-altitude) analysis of erosional topography”, Geological Society America Bulletin, Vol 63, issue 11, pp: 1117-1142, 1952.
13. Chen, Y.C., Sung, Q. and K.Y. Cheng, “Along-strike variations of morphotectonics features in the Western Foothills of Taiwan: Tectonic implications based on streamgradient and hypsometric analysis”, Geomorphology, Vol 56, issue 1-2, pp: 109-137, 2003.


