
Appraisal of Urban Sprawl in Mega Cities of Punjab Pakistan in context of Socio-Political Issues using RS/GIS.
Muhammad Saifullah1, Memoona Zafar1, Anam Sohail2, Faiza Mehmood1, Muhammad Musharaf1, Jehanzaib Khan1, Ayesha Ashfaq3, Syed Amer Mahmood1.
1 Department of Space Science, University of the Punjab, Lahore
2Institute of Administrative Sciences, University of the Punjab, Lahore
3Department of Geography, Government College University, Lahore
* Correspondence: Muhammad Saifullah E-mail : saifafridi1994@gmail.com
Citation | Saifullah.M, Zafar.M, Sohail.A, Mehmood.F, Musharaf.M, Khan.J, Ashfaq.A and Mahmood.S.A. “Appraisal of Urban Sprawl in Mega Cities of Punjab Pakistan in context of Socio-Political Issues using RS/GIS”. International Journal of Innovations in Science & Technology, Vol 01 Issue 03: pp 108-119, 2019.
DOI | https://doi.org/10.33411/IJIST/2019010308
Received | May 26, 2019; Revised |June 28, 2019 Accepted | June 29, 2019; Published | June 30, 2019.
________________________________________________________________________
Abstract.
Urbanization has become a hot issue in context of environmental and socio-political scenarios which is addressed at every forum internationally. The mega cities are considered the main origin of socio-economic development which caused to emerge a number of issues like biodiversity, environmental degradation, resource consumption, implementation of law and order and provision of basic facilities to the general public. The area under investigation consists of Lahore, Gujranwala and Sheikhupura. The study site was bounded by 73-75 E longitudes and 31-33 N latitudes. We used Landsat satellite data to map Spatio-temporal variations in urban sprawl from 1990 to 2019 with a temporal window of 15 years. The Landsat data is free, highly reliable and considered as primary source. The classification results show that the total area of study site was site was 29355 km2 including 21933km2 were green index 4595 km2 was under human settlements and 2827 km2 was the waterbody in 1990. The classification of Landsat image of the year 2005 describes that area of human settlements was increased to 9366 km2, the volume of water body was reduced to 2111km2 and the vegetation was also degraded to 17878km2. Again, the urban area was computed using satellite imagery for the year 2019 which was 16105km2 in 2019. Kappa stat proved the accuracy of supervised classification what was around 87%. Remotely sensed datasets proved the reliability of Landsat satellite images for estimation of urban sprawl during last three decades.
Keywords: socio-political development, Urban Sprawl, Landsat, Biodiversity, Classification.
Introduction
Urbanization has become a hot issue in context of environmental and socio-political scenarios which is addressed at every forum internationally. About 15% of the world’s population was urbanized in 1990 but now it is expected that half of world’s population will be urbanized by 2030 [1]. This urbanization growth has devasted urban balance and effected the sustainable development. The situation has become worse which lead to severe environmental issues and the climate change [2]. This climate change has affected the cropping system [3] glacial melting [4], severe flooding and droughts [5].
Many studies have indicated a big difference in urban temperature in comparison to its outskirts [2,6,7,8]. Removal of vegetation for construction of buildings, malls and plazas, is considered the main cause of rise in urban temperatures [9]. Urban transport adds a variety of pollutants in the atmosphere through tail pipe emissions which cause to block the reflected solar radiations, and finally result into urban heat island [2]. The removal of vegetal cover from urban areas cause the solar radiations to approach earth’s surface directly which result to an abrupt increase in urban temperatures in comparison to its surroundings [2].
The mega cities are considered the main origin of socio-economic development which caused to emerge a number of issues like biodiversity, environmental degradation, resource consumption, implementation of law and order and provision of basic facilities to the general public [10,11,12,13]. These issues need to get resolved on emergency grounds.
Sustainability and urban development have been widely focused in various studies [11,12,14,15]. Some studies have proved that regional sustainability is the key parameter to evaluate the credibility and authenticity of urbanization [12,14,15] however, many others believe that urban sustainability is oxymoron [11]. Urban sustainability has two main pillars that include ecological and social sustainability. Ecological sustainability is concerned with ubiquitous urban sprawl while social sustainability relates to urban population growth. Recent urban growth in Asian countries put huge pressure on its ecological system which caused to emerge new settlements e.g., highways that eaten up agricultural fertile lands, wetlands, forests and other lands. The socio-economic sustainability is concerned with two main themes i.e., economic balance and social equity [16,17]. Social inequity is concerned with all the issues associated with society that includes social injustice, welfare of migrants [18], rural-urban settlement gap, health issues, air pollution, traffic injury and occupational hazards [19,20,21].
In the very first step, urban instability hit the society by disturbing literary, mobilization, income, education, political participation and health. Next, these issues become prominent when the urbanization effects the carrying capacity of a particular urban society.
Rapid urbanization and industrialization were faced by various developed countries [22]. Urbanization of ancient times, was associated with employment opportunities therefore, people rushed and settled themselves in surroundings of urban societies for their livelihood. The socio-economic development results in peace and prosperity of a region.
The main objective of this research was to investigate the urban sprawl in mega cities of Punjab Pakistan in context of socio-political issues using Remote Sensing and Geographic Information System (GIS).
Material and Methods.
Study site.
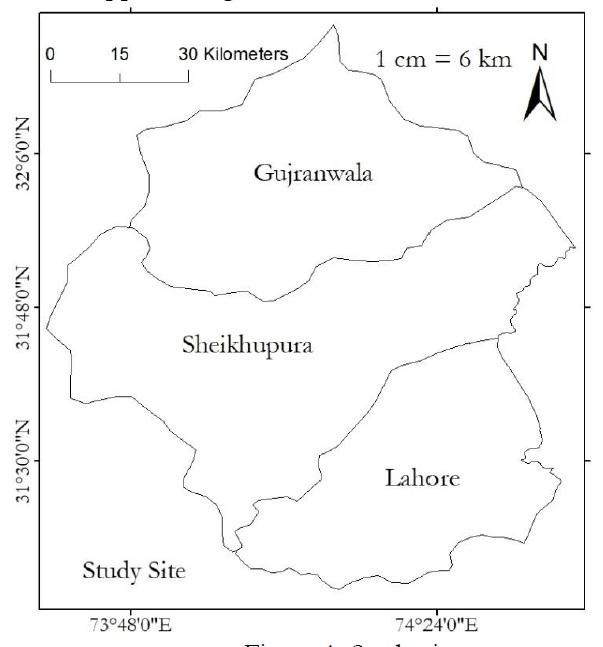
We selected three adjacent districts in Punjab Pakistan where high rates of urban sprawl were reported in recent three decades. The area under investigation consists of Lahore, Gujranwala and Sheikhupura. The study site was bounded by 73-75 E longitudes and 31-33 N latitudes. The study site is mapped in Figure 1.
The methodology used in this research is mapped in Figure 2, which describe the complete mechanism to compute urban growth from satellite image acquisition to final display of thematic maps.
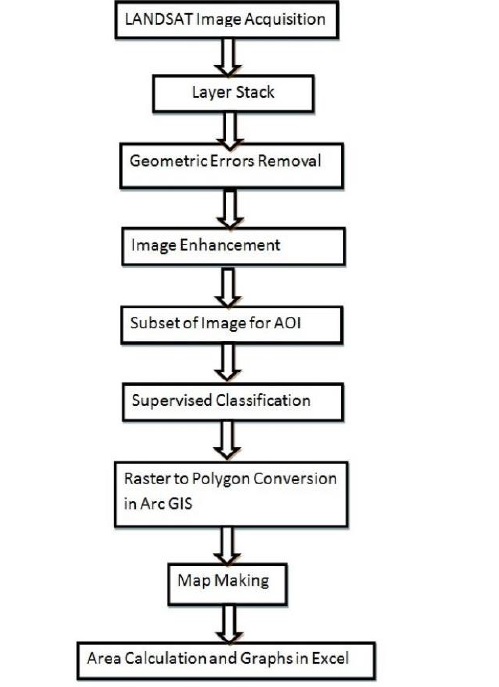
Figure 2. Methodology.
We used Landsat satellite data to map Spatio-temporal variations in urban sprawl from 1990 to 2019 with a temporal window of 15 years. The Landsat data is free, highly reliable and considered as primary source. We obtained satellite images of Landsat 5 for the years 1990 and 2005 and Landsat 8 for the year 2019. The complete description of satellite images used to accomplish this research is mentioned in Table 1.
Table 1. Landsat 5, 8 image acquisition dates.

A Landsat image is comprised of a number of spectral bands, commonly known as layers. In the first step, these layers were combined to obtain a satellite image using layer stack utility in Erdas Imagine 14. This utility is capable to bind these layers carefully without merging their information at cell level. An overview of layer stacking is shown in the Figure 3,
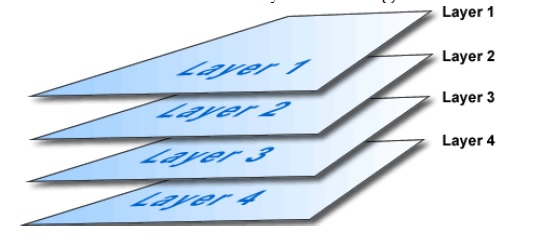
Figure 3. Layer staking in Erdas Imagine.
The swath width of Landsat image is 185km2. It is a very large image in comparison to the spatial extent of the study site. Therefore, it was important to figure out the investigation site from a large dataset for saving the processing time. We used the mask of study site and applied “Extract by Mask” to obtain the investigation site only from the Landsat images.
All satellite images were checked geometrically to cross validate the spatial locations of various landuse features. To do so, we marked some features on satellite images and checked their locations through Global Positioning System (GPS) but we could not find considerable variations.
Classification is used to demarcate and discriminate between various landuse features existing in the study site. The main objective of classification was to compute the volume in term of area of existing features. There are two types of classifications, 1) Supervised 2) Unsupervised. In supervised classification, we do recognize landuse features to computer by selecting trainee samples. Software intake these sample sites and recognize the existing landuse. Supervises classicization is considered technically correct in comparison to unsupervised classification. We computed the variations in area of landuse features through supervised classification.
Kappa coefficient is considered a good indicator to determine the accuracy of supervised classification [23]. It is widely used therefore, we applied Kappa stat for accuracy assessment of supervised classification.
Result and discussion.
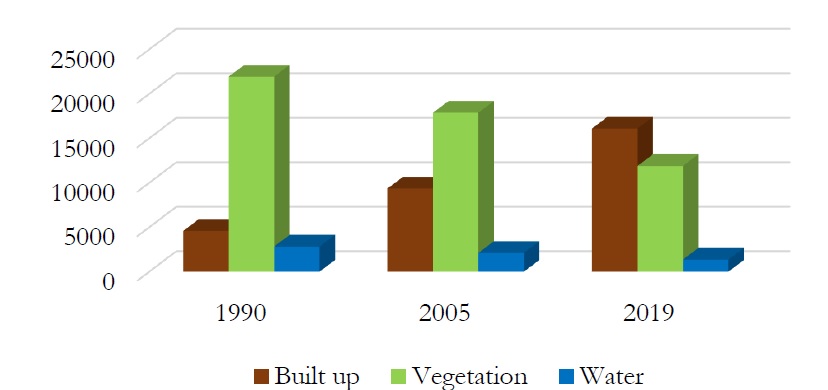
The supervised classification of Landsat images is mapped in figure 4. Figure 4 describe that urban boundaries have sprawled beyond the limits during last three decades which has eaten up fertile agriculture lands. Figure 4(A) is showing the spatial extent of water body, vegetation and the built-up area in the year 1990. According to figure 4 (A), the total area of study site was 29355 km2 including 21933km2 were green index 4595 km2 was under human settlements and 2827 km2 was the waterbody in 1990.
Figure 1(B) is showing that the area of human settlements had been increased in 2005 in comparison to 1990 from 4595km2 to 9366 km2, the volume of water body was reduced to 2111km2 and the vegetation was also degraded to 17878km2.
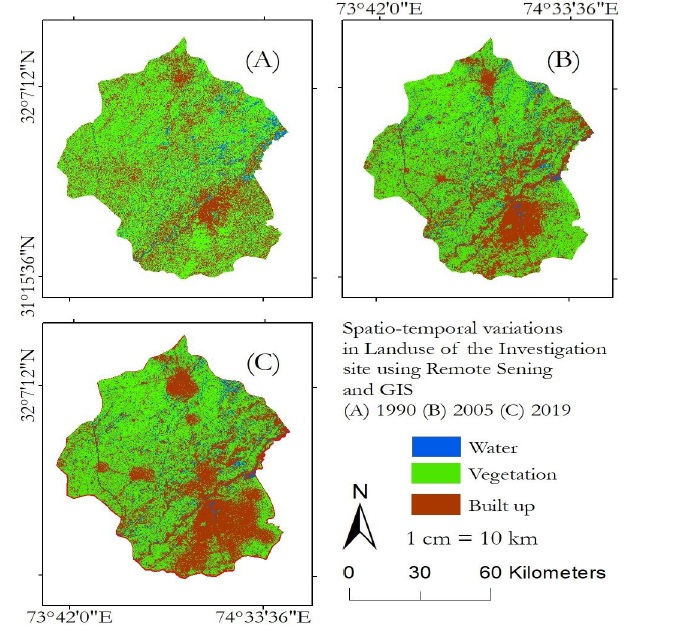
Figure 4. Spatio-temporal variations in landuse of the investigation site from 1990-2019 having a temporal window of 15 years.
Figure 1(c) was mapped using Landsat 8 image of year 2019 which show a reasonable jump in built up area that reached to 16105km2 and hence a decline to vegetation as the area under vegetation was observed as 11888km2. Figure 5 is showing temporal variations in built up, vegetation and the water body.
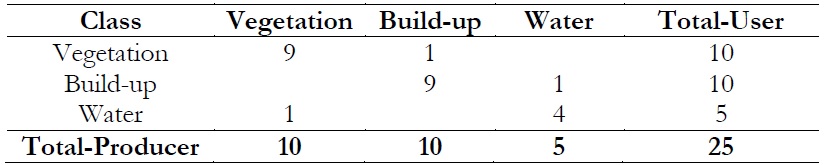
The accuracy assessment of supervised classification for the years 1990, 2005 and 2019, we applied Kappa stat on the classified images and applied 25 sample points including 5 to waterbody, 10 to build up and the vegetation. The calculations are as follows,
Table 2: Sample points applied to classified image for the year 2019.
TS= Total number of Sample
TSC= Total number of corrected

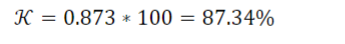
Table 3. Sample points applied to classified image for the year 2005.
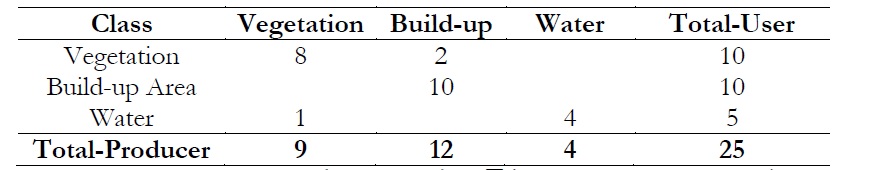
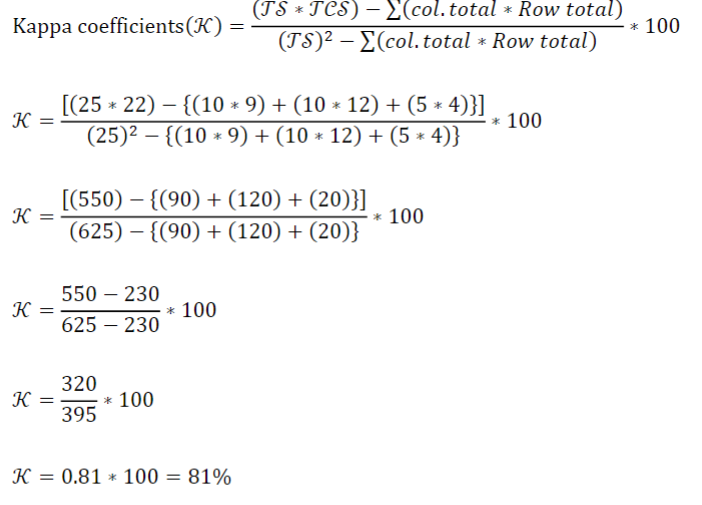
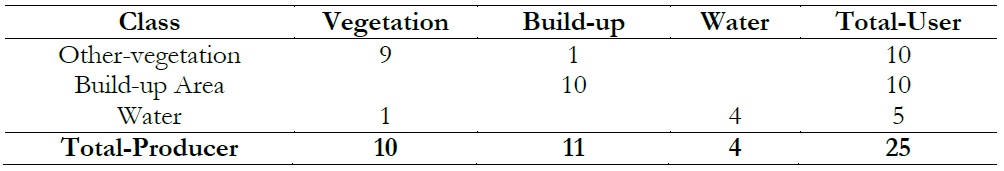
Table 4. Sample points applied to classified image for the year 1990.


It determines that the classified image obtained using satellite image for the year 1990 was 81.25%. The classified image for the year 2005 was 81% correct and the satellite image for the year 2019 was 87.34% correct.
Discussions
The results proved that most of urban sprawl occurred in Lahore and Gujranwala during 1990-2019. It was observed that mostly migrants rushed toward urban areas in search of education and employment. Lahore is known as an origin of education. Therefore, Lahore was a hotspot for knowledge seekers.
People moved toward Lahore to get knowledge and stayed on rent with permanent residents. Soon, this trend become a business and the residents built new settlement to offer their houses on rent to migrants. In this way, about 85% houses were built without following any architectural by laws that devasted the complete face of the city. Most of migrants did not return to their native cities because they engaged themselves in some professional jobs and become permanent residents which cause to increase the urban area.
Lahore and Gujranwala have limited health facilities in comparison to existing population. Mostly hospitals were built by British and a few were built after independence. Therefore, the increasing population is given cheap medical service due to lack of medical facilities.
It is very difficult to apply law and order to ensure the security of masses with limited resources. Therefore, the crime rate had been increasing in Lahore and Gujranwala with passage of time since 1990. Transport is a remarkable problem of a mega city. It is very difficult to manage transportation of a big population. For this reason, many underpasses, overhead bridges, tunnels and metro lines were constructed which are serving within cities but traffic remains out of control.
On the other hand, Gujranwala is an industrial city. There were 550 industries in Gujranwala in 1995 that raised up to 2131 in 2019. These industries are famous for manufacturing goods of export quality which remained an attraction for labor and other professions to earn their livelihood which cause increase in urban size.
A city faces a big burden of accommodation of migrants, hence a planned city built by senior architects is highly needed but unfortunately migrants built their houses by their own in Lahore and Gujranwala. Therefore, insecure and ill planned houses were built.
Urban climates are getting polluted day by day by industrial emission and vehicle discharge. The statistics of Gujranwala describe that the amount of CO was 105 PPBV in 1995 that increased up to 130 PPBV in 2018, CO2 increased from 363 PPM to 421 PPM. The number of vehicles were enhanced from 25730 in the year 2000 to 796751 in 2016. There were 550 industries 1995 which increased up to 2131 in 2016. All these activities which are against the human health are a question mark to a step forward for a sustainable future.
Conclusion.
Urban sprawl is one of major problems globally for developing countries like Pakistan. It is addressed at every forum and requires careful attention for immediate solutions. It is hard to draw city boundaries by physical visits therefore; remotely sensed datasets are highly reliable for identification of existing land use. But a limitation that we faced to fulfill the project successfully, was the coarse resolution of Landsat imagery. We executed field visits to determine the accuracy of results. One can get efficient results with improved satellite imagery of high resolution.
Author’s Contribution. All the authors contributed equally.
Conflict of interest. We declare no conflict of interest for publishing this manuscript in IJIST.
Project details. NIL
References:
1. Chen, M.; Ye, C. Differences in Pattern and Driving Forces between Urban and Rural Settlements in the Coastal Region of Ningbo, China. Sustainability, 6, 1848–1867.
2. Gillani.S.A, Rehman.S, Ahmad.H.H, Rehman.A, Ali.S, Ahmad.A, Junaid.U, and Ateeq.Z.M Appraisal of Urban Heat Island over Gujranwala and its Environmental Impact Assessment using Satellite Imagery (1995-2016). International Journal of Innovations in Science and Technology, Vol 01 Issue 01: pp 1-14, 2019. 3. Behzad.A; Rafique.U; Qamar.M; Islam.B, H Umer Hameed,U.H; Basheer M, Firdos.M and Mahmood.S.A1”. Estimation of Net Primary Production of Rice Crop using CASA model in Nankana Sahib. International Journal of Agriculture and Sustainable Development, Vol 01 Issue 01: pp 30-46, 2019.
4. Oerlemans, J. Quantifying global warming from the retreat of glaciers. Science 1994, 264, 243–245.
Glenis, V.; Kutija, V.; Kilsby, C. A fully hydrodynamic urban flood modelling system representing buildings, green space and interventions. Environ. Modell. Softw. 2018, 109, 272–292
6. Chen, L.; Ren, C.; Zhang, B.; Wang, Z.; Liu, M. Quantifying Urban Land Sprawl and its Driving Forces in Northeast China from 1990 to 2015. Sustainability , 10, 188.
7. Osman, T.; Divigalpitiya, P.; Arima, T. Driving factors of urban sprawl in Giza Governorate of Greater Cairo Metropolitan Region using AHP method. Land Use Policy , 58, 21–31.
8. Zhang, H.; Zhou, L.G.; Chen, M.N.; Ma, W.C. Land Use Dynamics of the Fast-Growing Shanghai Metropolis, China (1979–2008) and its Implications for Land Use and Urban Planning Policy. Sensors , 11, 1794–1809.
9. Macomber, J.D. Building sustainable cities. Harv. Bus. Rev. , 91, 40–50.
10. The World Bank. Release of World Development Indicators 2015. Available online: http://data.worldbank.org/ news/release-of-world-development-indicators-2015 (accessed on 15 April 2016).
11. Wu, J. Urban sustainability: An inevitable goal of landscape research. Landsc. Ecol. , 25, 1–4.
12. Hossain, M.S. Panel estimation for CO2 emissions, energy consumption, economic growth, trade openness and urbanization of newly industrialized countries. Energy Policy , 39, 6991–6999.
13. Cumming, G.S.; Buerkert, A.; Hoffmann, E.M.; Schlecht, E.; von Cramon-Taubadel, S.; Tscharntke, T. Implications of agricultural transitions and urbanization for ecosystem services. Nature , 515, 50–57.
14. Wu, J.G. Urban ecology and sustainability: The state-of-the-science and future directions. Landsc. Urban Plan.125, 209–221.
15. Rogers, D.S.; Duraiappah, A.K.; Antons, D.C.; Munoz, P.; Bai, X.; Fragkias, M.; Gutscher, H. A vision for human well-being: transition to social sustainability. Curr. Opin. Environ. Sustain. , 4, 61–73.
16. Dempsey, N.; Bramley, G.; Power, S.; Brown, C. The social dimensions of sustainable development: defining urban social sustainability. Sustain. Dev.
17. Li, C.; Li, J.; Wu, J. Quantifying the speed, growth modes, and landscape pattern changes of urbanization: a hierarchical patch dynamics approach. Landsc. Ecol. , 28, 1875–1888.
18. Fu, G. The Sustainability Issues of Chinese Food Security in the Context of Industrialization and Urbanization, 2013. Available online: http://repo.lib.ryukoku.ac.jp/jspui/handle/10519/5030 (accessed on 15 April 2016)
19. Hsing, Y.T. The great urban transformation: Politics of land and property in China. OUP Catalogue, Available online: https://ideas.repec.org/b/oxp/obooks/9780199644599.html (accessed on 15 April 2016).
Chen, X.; Frank, K.A.; Dietz, T.; Liu, J. Weak ties, labor migration, and environmental impacts: toward a sociology of sustainability. Organ. Environ.
21. Li, X.H.; Liu, J.L.; Gibson, V.; Zhu, Y.G. Urban sustainability and human health in China, East Asia and Southeast Asia. Curr. Opin. Environ. Sustain., 4, 436–442.
22. Chen, C.; Han, J.; Fan, P. Measuring the Level of Industrial Green Development and Exploring Its Influencing Factors: Empirical Evidence from China’s 30 Provinces. Sustainability, 8, 153.
23. Karamat.A, Nawaz.M, Mirza A.I, Jamil.M.R, Asghar.A, Ayyaz.M, Akram.F and Mahmood.S.A.”. Step-by-Step Processing of Sentinel-1 data for Estimation of Rice Area. International Journal of Agriculture and Sustainable Development, Vol 01 Issue 02: pp 66-80, 2019.


