
Asphalt Pavement Potholes Localization and Segmentation using Deep RetinaNet and Conditional Random Fields
Rana Ghazanfar Ali 1, Syed M. Adnan2,Nudrat Nida 3,Wakeel Ahmad 4, Farooq Bilal 5
1,2, 4, 5Department of Computer Science, University of Engineering & Technology
Taxila, Pakistan
3Air University, Islamabad, Aerospace & Aviation CampusKamra, Pakistan.
* Correspondence: Rana Ghazanfar Ali, ghazanfar.ali@uettexila.edu.pk
Citation | Ali. R. G, Adnan. S. M, Nida. N, Ahmad. W and Bilal. F, “Asphalt Pavement Potholes Localization and Segmentation Using Deep RetinaNet and Conditional Random Fields”, International Journal of Innovations in Science and Technology, Vol 3, Special Issue, pp: 126-139, 2021.
Received | Dec 15, 2021; Revised | Dec 22, 2021 Accepted | Dec 23, 2021; Published |Jan 01, 2022.
Abstract.
The main aspect of maintaining the roads and highways' durability and long life is to detect potholes and restore them. A huge number of accidents occur on the roads and highways due to the pothole. It also causes financial loss to vehicle owners by damaging the wheel and flat tire. For the strategies of the road management system and ITS (Intelligent Transportation System) service, it is one of the major tasks to quickly and precisely detect the potholes. To solve this problem, we have proposed a deep learning methodology to automatically detect and segment the pothole region within the asphalt pavement images. The detection of the pothole is a challenging task because of the arbitrary shape and complex structure of the pothole. In our proposed methodology, to accurately detect the pothole region, we used RetinaNet that creates the bounding box around the multiple regions. For the segmentation we used Conditional Random Field that segments the detected pothole regions obtained from RetinaNet. There are three steps in our methodology, image preprocessing, Pothole region localization, and Pothole segmentation. Our proposed methodology results show that potholes in the images were correctly localized with the best accuracy of 93.04%. Conditional Random Fields (CRF) also show good results.
Keywords: RetinaNet, Pothole Segmentation, Conditional Random Fields (CRF), CAD tool, Region proposal.
- INTRODUCTION
Road Maintenance is essential, especially in developed countries. The highway system of a developed country contains thousands of centerline kilometers of pavement. Such systems consist of asphalt, concrete, or composite pavements ranging in condition, age, and performance. Pavement distress is defined as a disorder of pavement structure that reduces serviceability or leads to a reduction in serviceability. Pavement distresses contain symptoms indicating problems of deterioration like Rutting, Fatigue Cracking, Longitudinal Cracking, Transverse Cracking, Block Cracking, Patches, and Potholes. Among all pavements, potholes are the most commonly damaging road conditions [1].
A pothole is a shallow or a deep hole in the pavement surface resulting from the loss of pavement surfacing material as shown in the diagram Figure. 1. it may be a Bowl-shaped hole of various sizes on the pavement surface.
Potholes are a nuisance, especially in the developing world, and can often result in vehicle damage or physical harm to the vehicle occupants. Therefore, an automated process is needed for vehicles that would allow them to avoid accidents.
Potholes in road surfaces are mostly caused by water as cracks that allow the water to seep through and mix with asphalt and it slowly creates the cavity underneath the crack.
In a road maintenance management system, the assessment of road surface distresses is one of the important tasks for constructing repair and maintenance strategies. So, there is a dire need of a system for automatic detection.
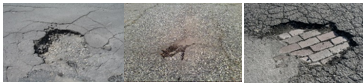
Figure 1. Road image(s) with Pothole [1]
Over the past years, many road maintenance network programs have been established to check the ongoing performance of the road network, to determine further pavement conditions and check long-term needs, to support investment plans, make the decision, and to point out maintenance and restoration. Like many others, the transportation department of the United States established Long-Term Pavement Performance (LTPP) for data collection, storage, analysis, and product development of road networks [20]. LTPP is an ongoing and active program. In this program assessment of pavement surface is an important aspect that requires reliable quality measurements like cracks, potholes, etc.
Broadly speaking, the assessment process of pavement condition is categorized into three major parts, the first part is data collection. Most of the data collection is done by vehicles that are equipped with video cameras for surface imaging. The second part is to identify and classify the type of distress like potholes, cracks, etc. The third and last part is to assess the distress. Also, Pothole detection techniques are further divided into three main categories [21] as follows:
- 3D Reconstruction: Detection methods that are based on a 3D reconstruction of the pavement surface rely on 3D point clouds provided by either laser scanners or stereovision algorithms using a pair of video cameras. The 3D laser scanning systems can be further distinguished into time-of-flight scanners that employ reflected laser pulses to directly create 3D point coordinates and hybrid systems that use digital cameras to capture consecutive images of lines projected by infrared lasers.
- Vibration-based approaches: In vibration-based accelerometers are used to access pavement conditions. These techniques lack accuracy and reliability and cannot be used at bridge expansion joints.
- Vision-Based Approaches: These include the techniques that are based on image processing analysis by extracting and comparing the features. Various vision-based approaches have been studied for automating the detection of potholes. In [1], a supervised approach for automated potholes is presented. This technique is based on pothole texture extraction and comparison where texture inside the pothole candidate is described and compared with the texture of the surrounding region. This implies the existence of several pothole texture samples through which the system is trained. The pothole is identified based on these training results. The dataset comprised of 120 images including both testing and training and reasonable accuracy was achieved.
Another study [2] aimed to detect a variety of road related objects such as lanes, road signs, and potholes. This paper states that pothole is characterized by a distinctive black color on road and that can be predominant characteristics to detect pothole, but they didn’t achieve desirable results and more effective filtering was needed to improve the accuracy of the approach.
Apart from that certain image processing technique was employed [3]. In which the images are collected by pining a camera on the front windscreen of a vehicle. The images were then converted into greyscale. Gaussian filter was applied as preprocessing step followed by canny edge detector to have a binary image. The binary image was dilated several times to remove the unwanted edges closed to the outer boundary. After that contour detection was applied to detect potholes which were then filtered out to discard those, that don’t meet the size constraint of potholes. This technique achieved a precision of 81.8% and recall of 74.4%.
In 2013 [4], an unsupervised method was presented which was based on spectral clustering, segmenting image, shape extraction followed by identification on the extraction of potholes based on seed points. Dataset was comprised of 50 images with single and multiple potholes and the technique was able to achieve the desired accuracy.
Gabor filter can also be used [5] for road pavements detection in the time-frequency domain in which filter was convolved with input image being processed and the binary image was obtained by thresholding the real component of the input image. Different orientation of the Gabor filter was applied to obtain binary images and all of them were combined resulting in an output image that contained pavement detected area.
Kanza Azhar et al [6] has presented Histogram of Oriented Gradients (HOG) features for the visual analysis of pavement images. Using HOG features pavement images and labeled as pothole and non-pothole images. And Normalized cut segmentation is used for localizing the pothole region in the pothole labeled images. HOG features and Normalized cut segmentation proved to be robust for the identification of pothole images. Dataset was comprised of 120 images and reasonable accuracy, precision, and recall was obtained.
A pothole detection system has been developed in [7] in which the mean shift algorithm has been used with Gaussian kernels to remove speckle noise. The pothole damage detection technique is based on assuming that any dark strong edge in the image is considered as a pothole edge if it has certain size constraints.
A novel framework has been proposed for segmenting road images in a hierarchical manner that can deal with several road defects. The experiments have shown that the approach has achieved satisfactory results on various road images [9].
For detecting and quantifying the pavement defects a depth sensor is used by Jahanshahi et al. [10]. In which pixels are classified as deep or flat using thresholding. Then, defective regions are described by using the maximum depth of the region.
The rate of creation and deployment of computer vision methods for civil engineering applications has been exponentially increasing. Koch et. al [11] presented a comprehensive survey of the state of the art in computer vision-based defect detection in asphalt civil infrastructure.
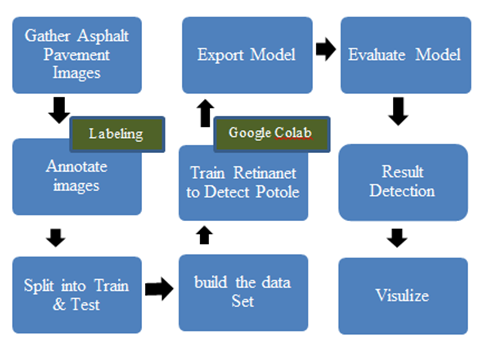
Figure 2. The architecture of Proposed Methodology for pothole detection
In 2019 [22], uses an open hardware device and a prototype to build an IoT-enabled device for potholes detection. In this paper, they have used a Raspberry pi board to build an interactive and context-aware system that can sense the surface in the physical environment. The system for pothole detection using Kinect sensor achieved 84% accuracy.
In 2020 [23], uses a new 1500 image dataset of Indian roads for pothole detection. In this paper firstly the dataset was annotated and tested using YOLO (You Only Look Once), the dataset is also trained and tested on YOLOv3, YOLOv2, YOLOv3-tiny, and the result are compared. The model is tested on different pothole images and it detects with reasonable accuracy. The accuracy achieved by these networks are Yolov3 58.79%, Yolov2 64.05%, Yolov2 68.57%, Tiny Yolov3 72.12.
In 2021[24] Surekha Arjapure presented a deep learning technique Mask Region-Based Convolutional Neural Network to detect and segment potholes and to calculate their area. They used a dataset of 291 images. Dataset has been collected manually on local roads of Mumbai city and nearby highways. An experimental result in this research gives an overall accuracy of 90% for pothole detection.
Retina Net detector when trained and tested on the Koch et al [1] and (Zamir, 2014) dataset using the pre-trained models classify potholes with high precision and recall rate than all existing state of the art detectors. We have used the Conditional Random Field (CRF) semantic method for segmentation which is trained on the deeplabv3 model using the backbone pre-trained ResNet model. This method extracts the affected patches of asphalt surface more precisely with variable boundaries to recognize the pothole. In the previous works in this area of research, the pothole characteristic retrieval is fully automated but natural weather conditions and environmental limitations are the difficulties of developing a fully automated pothole analysis system. The study specifies the research gap of robust techniques in real-time pothole detection.
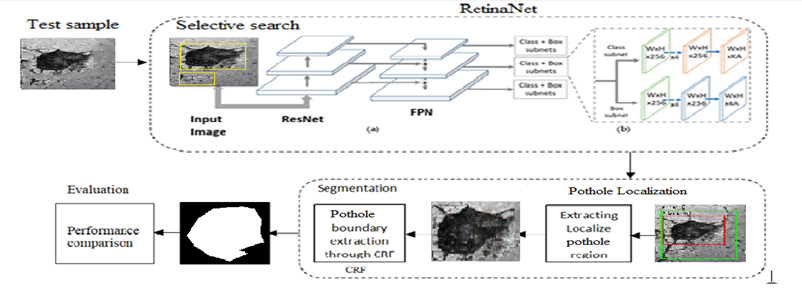
Figure 3.Proposed methodology for localization and Segmentation of Pothole region
In our proposed methodology firstly, we preprocess the images to refine the image quality. In data preprocessing, we have applied data augmentation techniques to increase the data set for better model learning at the training stage. After that, we trained the RetinaNet for potholes detection. Feature pyramid network used by retina net on top of the pre-trained model in a fully convolutional manner. This FPN layer enables the network to take an arbitrary size image and gives the result at multiple levels in the FPN layer in the form of proportionally sized feature maps. The top level of the feature map consists of grid cells that cover the large region of the image and suitable for the detection of large objects. This FPN is attached with two sub-networks, classification subnet and regression subnet, which helps the RetinaNet model to learn to detect the pothole region. When this trained RetinaNet model is applied to the test images, it localizes the pothole region with high precision of 0.93. After the detection of the pothole, the localized region is processed through CRF to statistically segment the pothole, as shown in Figure 3.
- Material and Methods.
- Image Processing
In the image preprocessing phase firstly, we have rescaled all the images. After rescale we have applied different data augmentation techniques to make out the best from the dataset.
Random cropping center: We have cropped our images to make the pothole object in the center of the image to get better information about the pothole.
Rotating the image: Changing the position of an object at a pivot point to some angle means the rotation of an image. The image with or without a pothole will look the same upon rotation and looks like that image is taken from a different angle.
Mirroring: Mirroring is used to create a mirror image of the object. We have flipped the image in the horizontal position to enlarge the dataset.
Salt and pepper noise: By changing the value of some of the pixels of an image from 0 to q we can add the salt and pepper noise. It will represent that image was taken on a dusty day.
RetinaNet Based Pothole detection
Different techniques have been explored regarding potholes detection. Keeping in view those techniques, we propose RetinaNet for Pothole detection as they are one stage detection model. It uses the Feature Pyramid Network (FPN)[12] to extract multiscale information and performs regression and classification box in one stage. It also used the focal loss method to improve the model’s performance by addressing the issue of class imbalance. In our proposed methodology we have used different backbone models like Restnet101, Densenet169, Efficientnet82, and VGG19 for training and testing of the Retinanet model on our dataset. Retinanet model uses the FPN as the top backbone layer above these pre-trained backbone neural networks.
Feature Extraction using Feature Pyramid Network (FPN)
Many object detection techniques use sliding window operation to get the region of interest (ROI). Later these older techniques were replaced in deep learning like CNN with better accuracy and precision, but it is also extensive. Therefore, we used FPN as the backbone which extracts features from the image. It takes an arbitrary image as an argument and gives results in equally sized feature maps by combining the semantic strong features with low resolution and weak features with high resolution. As Potholes have variations in size and shape, FPN uses deep features for road damage detection and model these variations. FPN uses the Pothole’s color, intensity, and size at multiple levels for accurate and precise modeling and each layer as pothole local representation. FPN is attached with two sub-networks, classification subnet, and regression subnet.
Classification subnet: The classification subnet uses the output of FPN to predict the object (Pothole class) at each spatial position for each anchor and K object classes. This subnet contains the four 3*3 convolution layers with D channel filters from pyramid level and each channel followed by ReLU activation. In the end, the Pothole area is classified and localized by using sigmoid activators.
Box Regression Subnet: Regression is the subnetwork of the RetinaNet which is used for bounding box regression. Like classification subnet, it also uses the FPN’s output and is attached with each feature pyramid level. It works parallel with the classification subnet for localization, pothole area. It localizes the pothole area concerning the anchor box if the pothole exists in the image.
Focal Loss
Focal loss is designed to address the class imbalance that occurs in single object detection methods when the dataset has a large number of background classes and few foreground classes. Due to class imbalance, the training of the dataset becomes inefficient and reduces the model performance as most locations are shown negative which gave no useful signal. Focal loss is based on entropy loss and it is minimized by adjusting the gamma values while training the Pothole dataset [25].
CEtrp (pt) = -log (pt) (1)
FLs(pt) = -(1 - pt) γlog(pt) (2)
Here CEtrp in (1) is the entropy loss and FLs in (2) is the focal loss. The gamma in (2) is the focusing parameter, its values range from 0 to 5.
RetinaNet Training Parameters
We have firstly trained our dataset on the retina net for accurate classification and localization of the pothole region in the image to get high accuracy. Secondly, we have used the RetinaNet to classify deep learning [7, 23]. We have used labeled ground truth in the training process of the deep learning network. RetinaNet model was pre-trained on the COCO dataset. To localize the pothole precisely, the RetinaNet was refined by using the parameters such as the learning rate which was initially set as 5, then 0.0001, and then change to 1 during training, 75 epochs, and 20,000 steps are used for training in RetinaNet. We choose small anchor size 16 and skipped the biggest anchor of size 512 in our dataset to localize the pothole.
Detection of Pothole at Test time
To identify the pothole region in the images sigmoid cross entropy was used. The sigmoid layer is a nonlinear activation function, it changes the values which range between 0 and 1. To obtain the threshold confidence score, the obtained deep feature vector form image is passed to the sigmoid layer. At each feature pyramid network level, we have decoded box predictions. From these predictions, the top-level predictions are combined with non-maximum suppression along with a 0.5 threshold to get the final results of detections.
Segmentation of Pothole using Conditional Random Fields (CRF)
RetinaNet localizes the pothole region in asphalt surface images. We have used CRF to segment the pothole region so that we can detect the affected area of the asphalt surface. CRF is a type of discriminative undirected probabilistic graphical model, that can represent the relationship between different variables [13]. CRF model helps us to use the observed one to estimate the unobserved ones. As this model creates the decision boundary between different classes, we have only two classes one is background class and the other is pothole class. To predict the pothole boundary, we have used the CRF model which gives better results than other state of the art methods.
For using the CRF, we have used the output of the RetinaNet which was the localized region of the pothole. We cropped that localized region from the image and give it to the CRF for the image segmentation. CRF arranged the image data points as a graph. We suppose that the image is an undirected graph C= (V, E) where V is nodes and each node corresponds to variable Xi, and E is the edge set. Let n=|V| shows the number of nodes in the graph and I be the input variable which was the localized area of the pothole in our case and Y=(y1,y2,…,yN) be the random output variable which can be the segmented pothole region or can be the segmented non-pothole area where V=I ∪Y and every Yv(v € V) gets a value from possible discrete labels range, which is in our case is pothole or non-pothole. In CRF we assume that each output variable Yv when conditioned on the input variable ‘I’ will obey the Markov property [14].
P (Yv | I, Yw, w ≠ v) = p (Yv | I, bw, w € S(v)) (3)
Where S(v) is a set of adjacent nodes and the (Y, I) is the input and output variable of CRF. In Pothole segmentation we used i € I represent the image that has to be segmented and y € Y represents the segmented results of the image for each ‘i’ pixel in the CRF graph. The basic objective is to solve energy function.
E (y, i) = ∑i Ei (yi, ii) + ∑ij Eij (yi, yj ,ii, ii) (4)
In this equation E(y,i) is the Energy function [15]. The CRF requires a mash of each original image to perform the coarse boundary refinement for each predicted mask to get the pothole segmentation final result.
- RESULTS AND EXPERIMENTS
Evaluation Protocols
The experiment was performed using a laptop with Intel(R) Core(TM) m3-7Y30 CPU @ 1.00GHz and 1.61GHz, 8GB memory, and a 64-bit operating system. This algorithm was implemented on Google Colab using windows 10. More sophisticated, we used python APIs, on the Collaboratory using GPU: 1xTesla K80, compute 3.7, having 2496 CUDA cores, 12GB GDDR5 VRAM, CPU: 1xsingle core hyperthreaded Xeon Processors @2.3Ghz i.e(1 core, 2 threads), 12.6 GB memory.
Dataset
The dataset we used to perform our experiments is provided by Koch [1] and the Go (Zamir, 2014) google street view dataset.
Evaluation metrics
For validating each phase of the proposed methodology following evolution metrics were used.
Pothole detection
Pothole region detection was performed by using the Retina Net interaction over union (IOU) as shown in eq (5). IOU is predicted and ground truth box overlapping criteria. For Pothole region detection IOU’s acceptable range is between 0.5 and 1, where from 0 to 0.3 is the background region. In the (5) True Positive (TP) are the correctly predicted boxes and others are False Positive (FP) and FN is False Negative.
IoU= 2* TP/ (TP+ FN +FP) (5)
mAP= mean (Tp/Tp+Fp) (6)
To evaluate the classification phase, the mean average precession (map) is used to compute the average precision of pothole detection/ classification.
Pothole Segmentation
For the evaluation of the segmentation phase, we have used the following parameters Accuracy (AC), Specificity (SP), Dice Score (DI), Sensitivity (SE), and Jaccard coefficient (JC).
Ac = (tp +tn) / tp + fp+fn +tn (7)
SP = tp / (tp + fp) (8)
SE = tp / (tp + fn) (9)
Di = 2 * (2 * tp / (fn + (2*tp) + fp)) (10)
Jc= 2 * (tp / (tp +fn +fp)) (11)
In these equations tp, tn, fp, fn represent true positive, true negative, false positive, and false negative pixels. In our case, the porthole pixel region is called true positive, so if the pothole is detected it’s the region of true positive pixels, other than it is the region of non-pothole pixels or background is true negative pixels.
- RESULTS AND DISCUSSION
The obtained results from the proposed methodology for pothole detection and segmentation will be discussed in this section.
Detection of pothole using RetinaNet
In our proposed model, the probability to the pothole area and remaining background is assigned by the convolution layers extracted fields, so that our region of interest which is the pothole in our model can be detected. Feature pyramid network (FPN) generated the convolution features from the proposal region, the RetinaNet extracted those features and maps with the trained model so that it can classify the proposed region.
In our proposed method, the pothole area was considered as positive and the rest of the image was considered as background or negative. For the pothole area detection, the IOU threshold is set to 0.5. The area which was below this threshold is considered as background or the negative class. If the threshold value was more than the threshold value it means a pothole was detected in the image other than that the region has not pothole if the IOU threshold value is less than 0.3. The RetinaNet localized the pothole at the regression layer with a good map result shown in Table 2. The results in the form of images are shown in Figure 3. The detected pothole area is more precisely localized with the help of RetinaNet as shown in Figure 3. RetinaNet model was tested and trained using different pre-trained neural network models one by one and their map was calculated which is shown in Table 2. As the feature maps of Efficientnet82 and Mobilenet160 were different block by block, they didn’t perform well and showed a low map as shown in Fig 8 and Table 2. Densenet169 and Vgg19 have shown better results in comparison with Mobilenet160 and Efficientnet82 but resnet101 has shown way better results than all of these models. The Resnet101 model has an activation function that connects it to FPN in RetinaNet[16]. Also, the Resnet101 model solves used the block of the residual network to solve the vanishing gradient problem so that feature maps can reach and jump over the layers it shows better results than other models. By seeing the results and the performance which shows that Resnet101 has high precision in localizing the Pothole region as shown in Table 2.
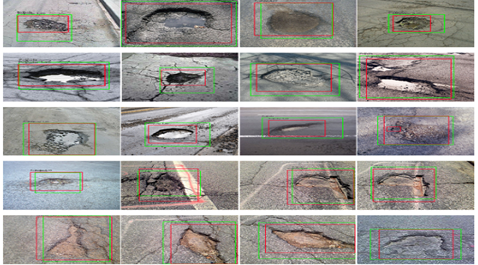
Figure 4. high scoring test samples of Pothole detection
Table 1. Pothole localization mAP score using RetinaNet model with Resnet101 as the backbone
|
Image |
Image1 |
Image2 |
Image3 |
Image4 |
Image5 |
Image6 |
Image7 |
mAP |
|
Precision |
0.93 |
0.99 |
0.91 |
0.99 |
0.89 |
0.91 |
0.92 |
0.93 |
Pothole Segmentation
For the evaluation of the segmentation phase, an accurate pothole region was required. To obtain the pothole region from the images we have used Condition Random Field (CRF). The resultant image of CRF segmentation was visually similar to the pothole ground truth as shown in figure 4. The performance of the segmentation results was measured by computing SE, SP, AC, F1 score on all the testing images. The proposed methodology got average values of AC as 0.932, F1 score as 0.8624, SP as 0.962, SE as 0.912. We have also calculated the DI and JC at the pixel level. The value of DI is 0.912 and the value of JC is 0.896. We got better results of segmentation because the Retinanet localized the Pothole more accurately.
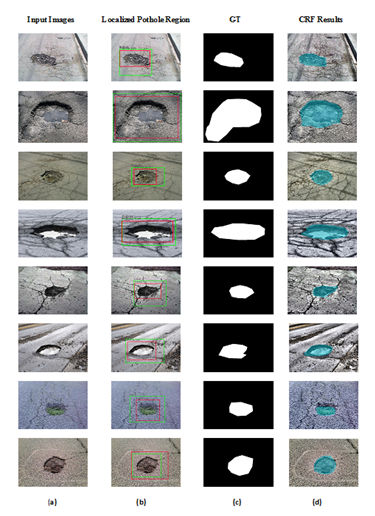
Figure5. (a) are input images, (b) are localized pothole region images, (c) are original ground truth masks and (d) are resultant segmented images
Table 2 Different RetinaNet models mAP results
|
Backbones |
mAP |
|
Resnet101 |
0.934 |
|
Vgg19 |
0.893 |
|
Densenet169 |
0.856 |
|
Efficientnet82 |
0.814 |
|
Mobilenet160 |
0.764 |
COMPARATIVE ANALYSIS
Comparison with other state of the art methods
Our Proposed methodology has given better results with other state of the art techniques as shown in Table 3. The techniques used in this research have a lower average accuracy than our proposed methodology. Our methodology resulted in improved pothole localization by showing a pothole through its outline. Also, our proposed methodology shows better results of segmentation than other state of the art techniques due to the good pothole region localization by using the RetinaNet model.
Table 3 Comparison of Performance
|
Method |
Accuracy |
Precision |
Recall |
|
Retinanet |
0.93 |
0.89 |
0.85 |
|
Koch et al. [1] |
0.85 |
0.81 |
0.86 |
|
Ryu et al. [17] |
0.73 |
0.80 |
0.73 |
|
Wang et al. [18] |
0.86 |
0.83 |
0.87 |
|
HOG Based Approach [19] |
0.90 |
0.86 |
0.94 |
|
Reddy, D. R et al. [22] |
0.84 |
0.78 |
0.88 |
|
Dharneeshkar et al. [23] |
72.16 |
0.76 |
0.4 |
|
Surekha Arjapure et al.[24] |
0.90 |
0.88 |
0.83 |
5. CONCLUSION
In this paper, we have proposed a novel technique based on RetinaNet for accurate pothole localization and Conditional Radom Field for efficient and precise pothole segmentation. Our technique consists of three steps, image preprocessing in which data augmentation was done, Pothole localization, and Pothole segmentation. The localized region of the pothole was obtained by RetinaNet shows a good result as compared to other state of art methods by getting deep features, using that localized pothole region the CRF segmentation show improved performance. Our method detects the different types of potholes of asphalt surfaces by making the mechanism of training data efficient. The experiment was performed on the dataset provided by Koch and the google street view dataset.
|
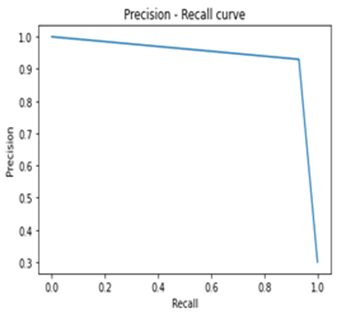
Figure 6. The area under the Precision-Recall curve for Pothole region separation |
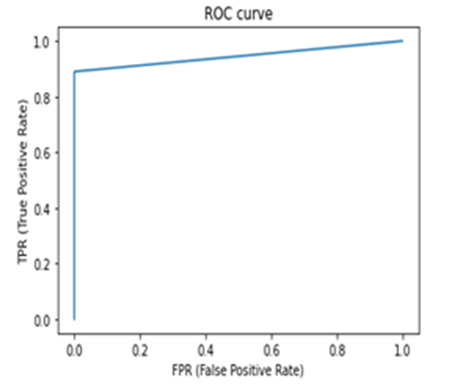
Figure7. The area under the ROC curve for the Pothole Region Separation |
|
Figure 8. mAP score of different Pretrained models on RetinaNet
|
|

ACKNOWLEDGMENT
The authors would like to thank Department of Computer Science, University of Engineering and Technology Taxila for R&D support and Christian Koch [1] for providing the dataset.
Author’s Contribution. All the authors contributed equally.
Project details. NIL
Conflict of interest. We declare no conflict of interest for publishing this manuscript in IJIST.
REFERENCES
[1] C. Koch and I. Brilakis, “Pothole detection in asphalt pavement images”, Advanced Engineering Informatics, vol. 25, pp. 507–515, 2011.
[2] A. Danti, J. Kulkarni, and P. Hiremath, “An Image Processing Approach to Detect Lanes”, Pot Holes and Recognize Road Signs. International Journal of Modeling and Optimization, vol. 6, pp. 658-662, 2012.
[3] S. Nienaber, M. Booysen and R. Kroon, “Detecting Potholes Using Simple Image Processing Techniques and Real-world Footage”, 34th Southern African Transport Conference, 2015.
[4] E. Buza, S. Omanovic and A. Huseinovic, “Pothole Detection with Image Processing and Spectral Clustering”, Recent Advances in Computer Science and Networking, vol. 810, pp. 4853, 2013.
[5] M. Salman, S. Mathavan, K. Kamal and M. Rahman, “Pavement Crack Detection Using the Gabor Filter”, Proceedings of the 16th International IEEE Annual Conference on Intelligent Transportation Systems, The Hague, The Netherlands, October 6-9, 2013.
[6] K. Azhar, F. Murtaza, M. H. Yousaf, H. A. Habib, “Computer Vision Based Detection and Localization of Potholes in Asphalt Pavement Images”, IEEE Canadian Conference on Electrical and Computer Engineering, 2016.
[7] A. B. Makone, and A. G. Rathod., “Pothole Dimensions Measurement using Mean Shift-based Speckle Filtering” International Journal of Science Techonology and Engineering, vol. 2, 2016.
[8] L. Huidrom, L. K. Das, S. K. Sud,“Method for automated assessment of potholes, cracks and patches from road surface video clips”, Procedia - Social and Behavioral Sciences, vol. 104, pp. 312 – 321, 2013.
[9] Y. Jia, Z. He and H. Zhu, “A Hierarchical Segmentation Approach towards Roads and Slopes for collapse Recognition”, International Journal of Signal Processing and Pattern Recognition, vol. 6, pp.153-164, 2013.
[10] M. Jahanshahi, F. Jazizadeh, S. Masri and B. Gerber, “Unsupervised approach for autonomous pavement-defect detection and quantification using an inexpensive depth sensor”, Journal of Computer and Civil Engineering, vol. 27, pp. 743-754,2013.
[11] C. Koch, K. Doycheva, V. Kasireddy, B. Akinci, P. Fieguth, “A review on computer vision based defect detection and condition assessment of concrete and asphalt civil infrastructure”, Advanced Engineering Informatics, vol. 30, pp. 208-210, 2016.
[12] T. Lin, P. Doll´ar, R. B. Girshick, K. He, B. Hariharan, and S. J. Belongie, “Feature pyramid networks for object detection,” Computer Research Repository, vol. abs/1612.03144, 2016.
[13] Conditional random field [Online]. Available: https://en.wikipedia.org/wiki/Conditional_random_field [Accessed].
[14] T. L. XH, 1 and J. Ma, “Conditional Random Fields for Image Labeling”, Mathematical Problems in Engineering, 2016.
[15] P. Krähenbühl, V. Koltun, “Efficient inference in fully connected crfs with gaussian edge potentials,” Advances in Neural Information Processing Systems, 2011.
[16] L. Ale, N. Zhang, L. Li, “Road damage detection using RetinaNet.,” IEEE International Conference on Big Data (Big Data); 2018.
[17] S. Ryu, T. Kim, Y. Kim, “Image-based pothole detection system for ITS service and road management system,” Mathematical Problems in Engineering. 2015.
[18] P. Wang, “Asphalt pavement pothole detection and segmentation based on wavelet energy field”, Mathematical Problems in Engineering, 2017.
[19] K. Christian, K. Gorgieva, V. Kasireddy, B. Akinci, P. Fieguth, “A review on computer vision based defect detection and condition assessment of concrete and asphalt civil infrastructure,” Advanced Engineering Informatics, vol. 29, pp. 196–210, 2015.
[20] “Fedral Highway Administration” , LTPP- Beyond FY 2009: What needs to be done? Technical Report, Publication No. FHWA-HRT-09-052, 2009
http://www.fha.dot.gove/pavement/ltpp/pubs/09025/09052.pdf
[21] Taehyeong Kim, Seung-Ki Ryu, “Review and Analysis of Pothole Detection Methods” Journal of Emerging Trends in Computiing and Information Sciences , Vol. 5, No. 2014, ISSN 2079-8409.
[22] Reddy, D. R., Goud, G. P. C., & Naidu, C. D. “Internet of Things Based Pothole Detection System using Kinect Sensor” 2019, Third International Conference on I-SMAC (IoT in Social, Mobile, Analytics and Cloud) (I-SMAC), 2019.
[23] J, D., V, S. D., S A, A., R, K., & Parameswaran, L. “Deep Learning based Detection of potholes in Indian roads using YOLO”. 2020 International Conference on Inventive Computation Technologies (ICICT). 2020.
[24] Surekha Arjapure, D.R.Kalbande, “Deep Learning Model for Pothole Detection and Area Computation”,2021 International Conference on Communication information and Computing Technology (ICCICT), 2021.
[25] LIN, T.-Y., GOYAL, P., GIRSHICK, R., HE, K. & DOLLÁR, P. “Focal Proceedings of the IEEE international conference on computer vision”, pp: 2980-2988, 2017.


