
Assessment and Monitoring of VIIRS-DNB and SQML-L light Pollution in Lahore-Pakistan
Hajra Nisar1, Faiza Sarwar1, Safdar Ali Shirazi1, Dania Amjad1, Rana Waqar Aslam2
1Department of Geography, University of the Punjab, Lahore 54000, Pakistan.
2 State Key Laboratory of Information Engineering in Surveying, Mapping and Remote Sensing (LIESMARS), Wuhan University, Wuhan 430079, China.
*Corresponding author’s email: faizasarwar.geog@pu.edu.plk
Citation | Nisar. H, Sarwar. F, Shirazi. S. A, Amjad. D, Aslam. R. W. “Assessment and Monitoring of VIIRS-DNB and SQML-L light Pollution in Lahore-Pakistan”, International Journal of Innovations in Science and Technology, Vol 3, Issue 4, pp: 94-109, 2022.
Received | Jan 01, 2022; Revised | Feb 02, 2022 Accepted | Feb 03, 2022; Published | Feb 10, 2022
Abstract
The usage of artificial light is excessive and improper. Earth's night picture has changed significantly from space and studies have shown that over-exposure to artificial light in the night can influence animals, the environment and human beings. The purpose of this study was to monitor and measure skylights of Lahore City and temporary light pollution from 2012-2019. The Suite-Day/Night band of the Visible Image Radiometer was used for time changes analysis with GIS and Remote Sensing tools. Indicators were established as a table tool through zonal statistics, and a field survey was also undertaken to measure the Sky-Glow of Lahore with Sky Quality Meter-L. The results suggest that from 2012 to 2019, light pollution rose by 23.43 percent. Results suggest that around 53.99% of Lahore suffered from light pollution. The number of lights in Lahore has increased by 161.82 percent between 2012 and 2019. In the study period, the mean night light and the standard night light deviation were 127.87 and 98.22 percent, respectively. Lahore's night sky was heavily polluted by light. Lahore's average skylight is 17.15 meters above sea level, which means low quality skies at night. This research aims to provide people an insight into light pollution and the causes of local light pollution. Furthermore, this study aims to enhance public attention to light pollution mitigation attempts by governments and politicians.
Keywords: Light Pollution; Sky Glow; VIIRS; SQML; Sum of lights; Mean Night-time Light; Standard deviation Night-time Light; Remote Sensing.
- INTRODUCTION
Light pollution is the presence of excessive, unneeded and misdirected artificial lights in the night world [1]. Since Thomas Alva Edison invented the first bulb in 1879, the use of ambient lighting has exponentially increased. Large areas, in particular metropolitan centers all over the world, are influenced, due to multiple factors including rapid development of artificial lighting, the rapid growth of human population, economic activity, infrastructure and transit, by needless artificial lights throughout the night. At night, artificial light is accessibly being used in quantity and implementation across the globe. An artificial light that can be released from artificial sources or reflected from the earth, as well as from other objects, can spread through fog, haze, pollution or floating particles in the atmosphere[2, 3]. There are many immediate advantages of ambient lightings, such as illuminating the night environment, but there are also unexpected and harmful effects of artificial lighting, which scholars and scientists are researching around the globe[4]. Artificial lights have enclosed the globe, dramatically altering the night vision of the earth from space, according to experts. Prolonged exposure to artificial lights at night can have negative consequences for animals, and humans[5].
The International Dark-Sky Association considers several sorts of light emissions. The light created by manmade factors in the night sky is known as sky-light. Artificial light that is not expected or desirable from the outside and that causes sleep disruption is called light transgression. Blindness is described as excessive (blinding) artificial lighting which hinders visibility, Light clutter is an enormous collection of light sources that can cause navigational problems[2,6]. Astronomers initially saw light contamination and its harmful implications since some astronomical objects were lost of sight due to rising artificial illumination[5, 7]. According to the latest artificial night sky atlas worldwide, 80 percent of the world's population lives in clouds of light contamination [8]. The rebound effect is diminished by lighting costs which lead to higher energy demand and a reduction in dark nights[4, 9]. In addition to the rebounding effect, blue LED light increases the visibility and brightness of the night sky throughout the atmosphere.[10].
This study is aimed at monitoring the light pollution of Lahore Metropolis from 2012 to 2019 and quantifying the urban glow of the city. The findings of this study aid society to enhance public awareness of light pollution and to provide an insight of the sources of local light pollution. Policymakers can use the findings of this research to reduce the detrimental health and environmental effects of light pollution. This study could change the government's interest in reducing light pollution dramatically.
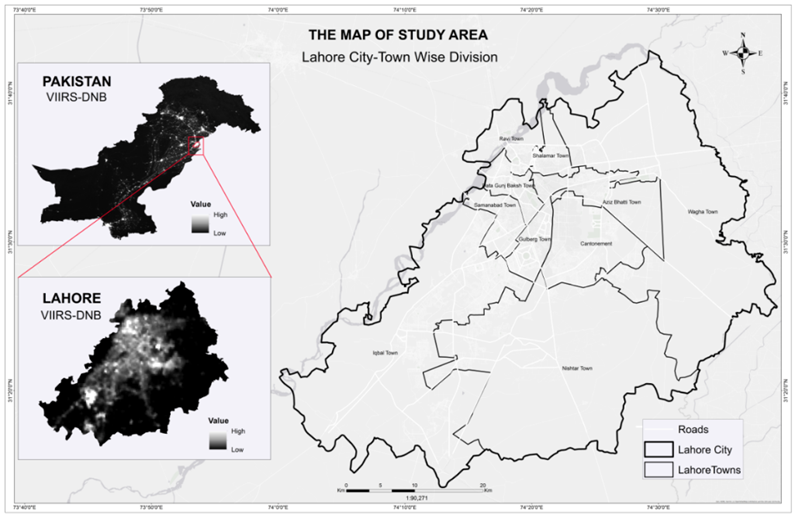
Study Area
This study was conducted in metropolitan Lahore. The city is divided in to different towns included Shalimar, Iqbal City, Ravi City, Data Gunj Bakhsh City, Aziz Bhatti Town, Nishtar Town, Wahga Town, and Gulberg Town. (Figure 1)[9].
- MATERIALS AND METHODS
Remote Sensing data
Version 1 (VIIRS-DNB) cloud free composites have been employed in this study to monitor light contamination. These images were developed by the United Nations Aeronautics and Space Administration (NASA) National Polar Collaboration (SNPP), the National Atmospheric and Oceanic Administration partnership. In the panchromatic near-infrared band, the VIIRS-DNB feels radiance ranged from lively daytime scenes to very dark evening lit by the fourth moon. The VIIRS-DNB covers a sweep of 3000 km and a wavelength of 0.5-0.9 m. The radiometric resolution of VIIRS-DNB is up to 14 bits. In W cm-2 sr-1, the Day Night Band (DNB) is a radiance meter that calculates radiance. VIIRS senses low light with a high sensitivity, from 3109W cm-2sr-1 to 0.02W cm-2sr-1, for a variety of dynamic radiation. VIIRS-DNB version 1 provides a global timing resolution of 12-hour (at 1:30 am and 1:30 pm local time). The resolution of VIIRS-Spatial DNB is 750 m.
The VIIRS DNB sensor measures artificial light emissions at night, allowing the VIIRS DNB Cloud-Free composite to detect artificial light during the night.[11-14]. Using remote sensing techniques, light emissions may be monitored. The Earth Observation Group's official website delivers remote information (EOG). Also covering a broad area were Tile 3 (75N/060N). From May 2012 to April 2013 and April 2018 to April 2019, the trial included 24 monthly VIIRS-DNB composites with a spatial resolution of 15 arc-seconds. (Not available except for June 2018). In this case, data was excluded from stray lights using configuration files "vcm." In EOG, two geo-tiff files are provided each month with a composite set: the first is a monthly average radiation composite, while the second is composite cloud coverage each month. This analysis was based on just monthly composites with average radiation[15].
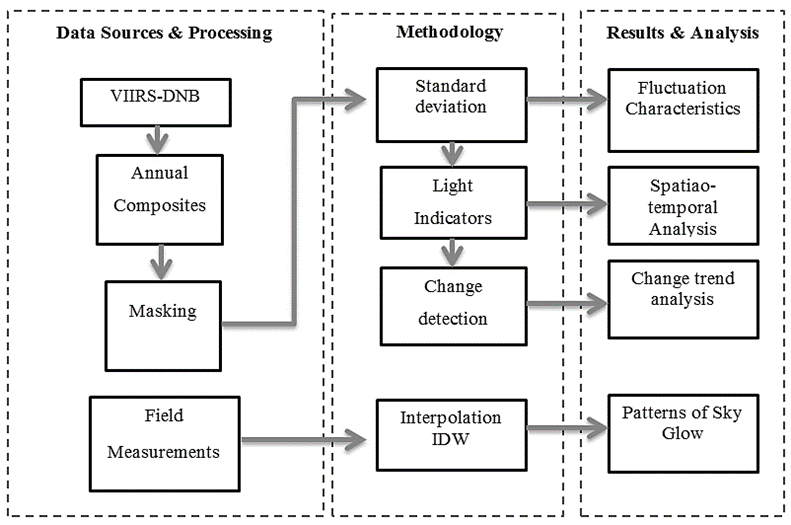
Figure 2. Flowchart of Methodology
Field Measurements
A field study for Lahore's Sky Glow was carried out and it was a road survey. SQM-L is a glow-measured instrument (Sky Quality Meter-L) (Figure 3). Sky Quality Meter-L has been invented by Dr. Anthony Tekatch and Dr. Doug Welch and is manufactured by Unihedron, a Canadian firm. The SQM-L has installed a TAOS TSL237S light sensor and an infrared blocking filter from HOYA CM-500 [16, 17]. SQM-L measures night skylights (NSB) per second arc on a logarithm (mag arcsec-2). The "magnitude per second arc" units are used commonly in astronomy to quantify the brightness of the night sky. The size of the brightness of an item is measured. Each grade is divided into 60 minutes with a circle of 360 degrees and every minute the arc is divided into seconds. The second arc area is 1 second by 1 second. The expressive size by square arc-second thus means a square arc-second of heavenly light
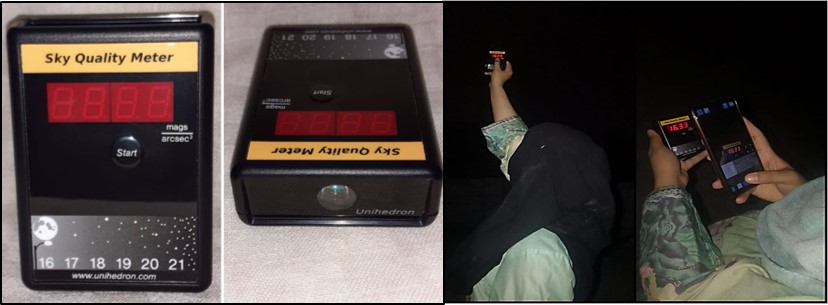
Figure 3. Sky Quality Meter-L
The point data was gathered using a random sampling technique during the field sample. Sky samples for luminosity have been gathered from 179 sites along designated routes. Both observations were performed only at night under good view conditions with no clouds or fog and no moon, as these variables influence readings of the skylights. From 29 January 2020 to 29 March 2020 observations were made between 8 p.m. and 11 p.m. local time around two hours after sunset. The measurements were carried out over 12 nights. Skyglow measurements were conducted over 12 nights, but only eleven nights were used because findings of one night were eliminated due to abrupt cloud cover, which increased sky visibility. There were four zenith measurements at each site, and for each place, an average value was calculated based on four values [18]. Measurements have been carried out with extreme caution to ensure that the SQM field L is not provided with a significant source of illumination.
Image Preprocessing
The VIIRS-DNB cloud-free composites were calibrated, both geometrically and radiometrically [19]. ArcGIS 10.5 was utilized for satellite data management. Monthly VIIRS-DNB composites were utilized to create composites intra-annual and inter-annual. Both of the twelve-monthly composites (May 2012 through April 2013 and April 2018 through April 2019) were utilized in the creation of two monthly composites: 2012-2013 and April 2018 through April 2019 (June 2018 is expected) and one interannual DNB composite was produced between May 2012 and April 2019, using monthly composites. The sampled area was then deleted from the resulting composites.
Standard Deviation
The standard deviation shows the average time series data dispersion divergence from the typical distance. In this research, the standard deviation was used to show changes in light emissions[20]. The standard deviation (Std-dev) was determined on the inter-annual 2012-2019 composite using the stretch equation. The outcomes of SD were classified into five groups by the Geometrical Interval method:
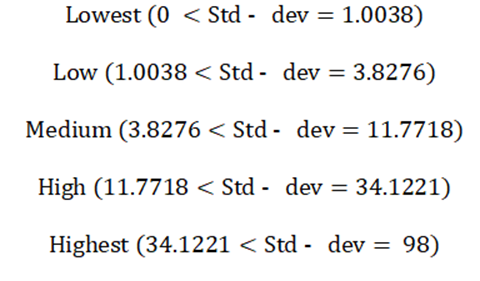
The higher values are the larger interannual change in light pollution.
Indicators of Light Pollution
The VIIRS-DNB nighttime lights are used to quantify light emissions. Different metrics reliant on night time illumination, such as light quantity (SOL), light area (Al), nighttime light mean value (MNTL), and a standard night light deviation, were determined in earlier investigations. These variables defined the distribution and intensity of night light, often known as light pollution[13, 20].
Accordingly, three indicators have been used in this study to examine, spatio-temporal features of light pollution variations in the city of Lahore, including:
- The overall intensity of artificial lights in the study region is indicated by SOL.
- Average amount of artificial light in the study area is indicated by MNL.
- SDNL reflects the level of artificial light spatial variability in the studied area.
SOL was created using MNL and SDNL thresholding algorithms. The Set-null Raster Calculator query was utilized for the removal of composite pixels below 4 for 2012-2013 and below 9 for 2018-2019. No light areas have been excluded with the set-null query, leaving only nighttime illumination zones. The zonal statistics were then employed as a table tool to measure the town's wise sum, mean and standard deviation. Then the number, average and standard deviation of the was computed for each town using zonal statistics as a table approach.
The growth and patterns of light emission were computed between 2012 and 2019. Monthly cloud-free composites from May 2012 and April 2019 have been included. The difference between these two images has been calculated using the difference Tool pixel-by-pixel analysis. the Arithmetic Remap Function was used on the newly created layer. Then, manually, two classes were created: one for the decreasing trend, with a range of -46.3 to -3.3, and another for the increasing trend, with a range of minimum of 20.9 to a maximum of 56.3. Colors were then allocated to all grades of symbology.
Interpolation by IDW (inverse distance weighted) uses a linearly weighted combination of sampling locations to determine cell values. Without a sample, IDW predicts a spot’s value. The IDW tool was used to show the skylight pattern or show the quality of the night sky in the study area.
Temporal Changes in Light Pollution
The result indicated that from 2012 to 2019, light pollution has risen. From 2012-2013 to 2018-2019, light pollution rose 23.43%. Light pollution is caused by increased use of artificial light at night, increasing electricity consumption, growing population and increasing urbanization in Lahore [21].
Figure 4 demonstrates the increased emission of artificial lights at night in Lahore. The increased emission of artificial lights reflects Lahore's population and economic activities have increased exponentially.
It shows a correlation between night-time satellite image radiance values with artificial night lights, so that the greater the radiance value, the greater will be the artificial emissions. The high brightness indicates polluted locations, while the low brightness shows less light-contaminated areas. Radiance values ranged from 0.28 to 89.62 Wcm-2 sr-1in 2012-2013 and from 0.64 to 146.65 Wcm-2 sr-1 in 2018-2019.
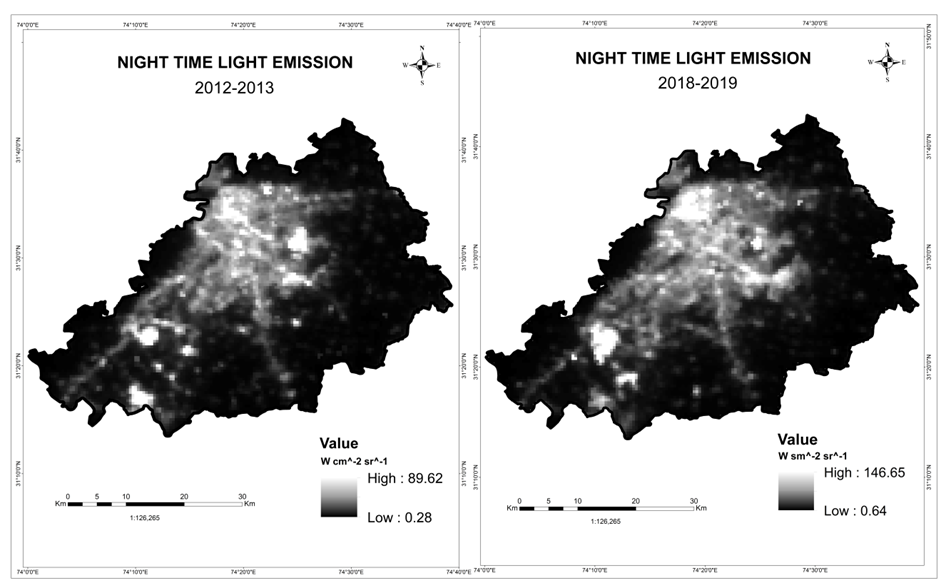
Figure 4. Increase of nighttime light emissions
Light contamination fluctuation characteristics
The standard deviation of interannual composites was constructed on the basis of available satellite data in order to study the sources of light pollution in Lahore. The results suggest that around 53.99% area of Lahore suffered from light pollution, 42.51% of which fluctuated substantially, with 11.48% modest fluctuation(Figure 5). Rest 46.01% area was observed with lowest swings [22].
Figure 5 depicts the various levels of light pollution fluctuations in Lahore. The sharp red indicate highest pollution, the medium fluctuation is shown by yellow colour, and the low fluctuation is the green color [23]. Low- to low-scale areas have mostly undeveloped, non-residential, and agricultural areas with practically little light pollution; Wahga and Nishtar Town have witnessed a high share of these places. The towns Aziz Bhatti, Iqbal Town and Shalimar Town have small to low fluctuations. Ravi town, Data Gunj Bakhsh Town, Samanabad City, Gulberg City and Cantonment had the highest rate of volatility in these cities because of urban core areas, business hubs, markets and Lahore industrial districts.

Figure 5. Fluctuation characteristics of light pollution
Results reveal that from 2012-2013 to 2018-2019, all three indices increased throughout Lahore. Overall, SOL climbed by 161.82 percent in 2012-2013 by 32303.09 and SOL by 84577.01 in 2018-2019. (Figure 6). The same was true of both MNL and SDL across the research period. MNL increased by 127.87%, and SDNL grew by 98.22%. (Figure 7). Figure 5 and Figure 6 show the sum of light, mean night light and standard differences from Lahore in 2012-2019.
The greatest level of SDNL in Ravi Town was increased due to industry from 4.73 to 13.93. Artificial lighting (SOL) intensity in Iqbal Town has significantly enhanced due to urban development and rising industrial activities. In Data Gunj Bakhsh Town, MNL or average artificial light level was considerably increased due to overcrowding of marketplaces and residential areas [24].
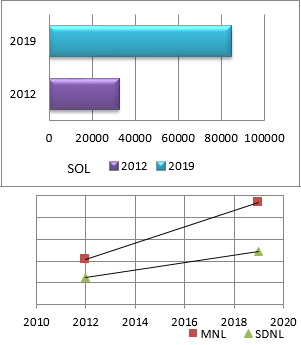
Figure 6. Graph of SOL Lahore 2012-2019 Figure 7. Graph of MNL and SDNL Lahore 2012-2019
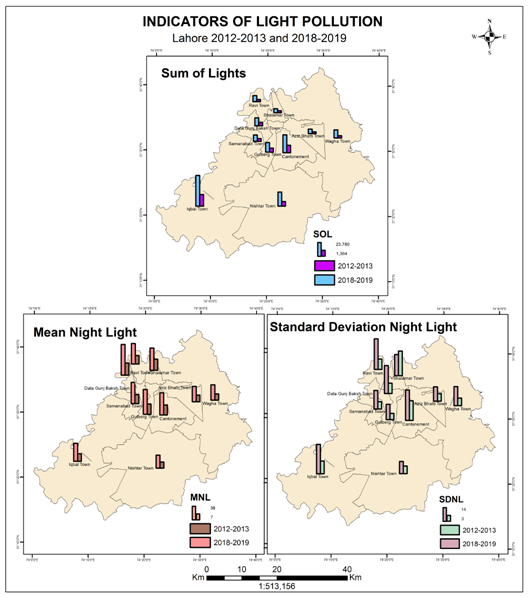
Figure 8. SOL, MNL and SDNL in Towns of Lahore
Figure 8 illustrates a rise/decline to SOL, MNL and SDNL indicators.
Table 1.2012-2013 and 2018-2019 SOL, MNL and SDNL in Lahore Towns
|
Towns |
Sum of Light |
Mean Night Light |
Standard Deviation Night Light |
|||
|
2012-13 |
2018-19 |
2012-13 |
2018-19 |
2012-13 |
2018-19 |
|
|
Iqbal Town |
8967.49 |
23780.59 |
9.24 |
22.32 |
5.77 |
13.34 |
|
Gulberg Town |
3052.76 |
7402.03 |
12.82 |
31.10 |
2.86 |
7.03 |
|
Shalimar Town |
1534.54 |
3005.97 |
13.95 |
27.83 |
11.24 |
9.60 |
|
Ravi Town |
1748.77 |
4749.40 |
10.66 |
25.67 |
4.73 |
13.93 |
|
Data Gunj Baksh Town |
2434.06 |
6176.36 |
15.11 |
38.36 |
4.70 |
12.71 |
|
Samanabad Town |
2148.03 |
4954.04 |
11.18 |
26.63 |
3.35 |
8.49 |
|
Nishtar Town |
3552.02 |
10843.04 |
7.62 |
16.30 |
3.45 |
5.55 |
|
Cantonment |
5769.19 |
13878.59 |
12.46 |
27.70 |
8.94 |
13.79 |
|
Aziz Bhatti Town |
1364.93 |
3506.47 |
8.37 |
19.26 |
3.44 |
6.57 |
|
Wagha Town |
1731.27 |
6280.49 |
7.83 |
19.32 |
3.45 |
8.68 |
Changing Trend of Light Pollution
The results suggest that in Lahore light pollution is expanding and increasing mainly as a result of the rapid expansion of urban and infrastructure in residential areas of the city (Figure 9).
The Iqbal town and Cantonment areas are being established with addition of new housing societies as the primary urban clusters, the commercial and economic heart of the town in these cities. Compared to other towns, Wahga Town and Nishtar Town had a lower trend and a more declining tendency since these towns had more residential cum commercial lands. A growing trend has been noted in marketplaces and industrial regions, apart from residential areas.
Figure 9 depicts the increasing and decreasing trend in the research area of light pollution. Red color denotes the highest increase, Green color shows the lowest trend and White color determine minimum or no change at all.
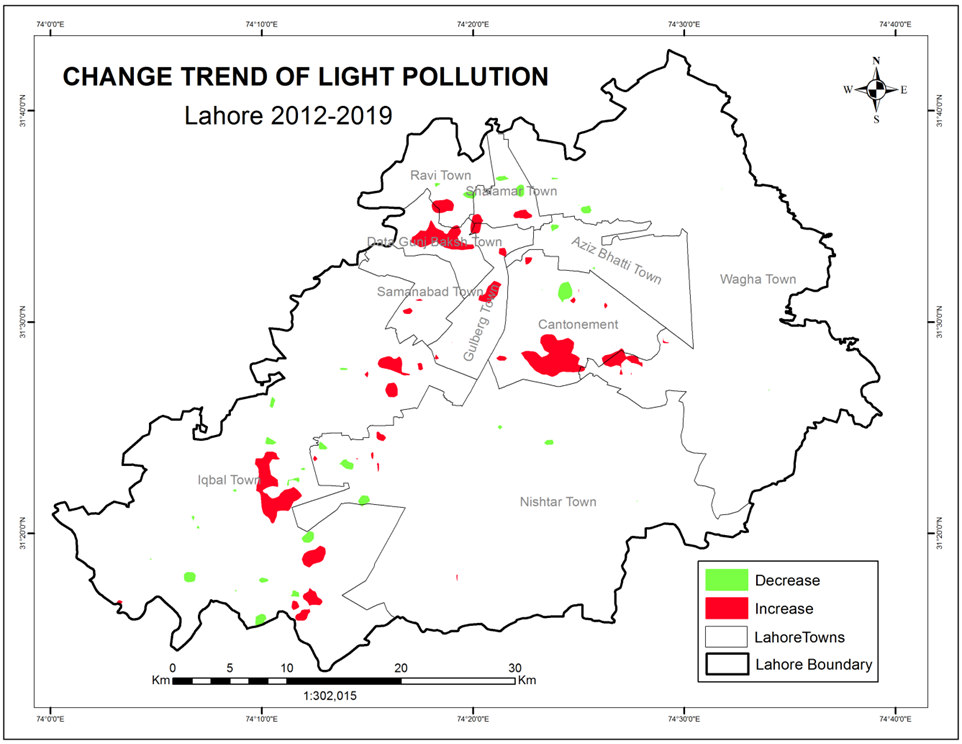
Figure 9. Change Trend of Light Pollution
Patterns of Sky Glow
The night sky of Lahore was contaminated by light substantially. The average luminance of the sky in Lahore (Figure 10) is 17.15mag, indicating the nighttime low-quality sky. The highest skylight was discovered in the walled city 15.0 mag arcsec-2, as the walled city is a commercial hub in Lahore. During the field visit, it was observed that, no light fitting shields were used on roadways, residential areas and parks, and high-power bulbs were installed that produced increased light pollution (Figure 10) [25]. In nearly all marketplaces, it was found that in the late evening excessive lights were used for publicity or security purposes, electricity was wasted causing light contamination to the environment (Figure 11). The lowest detected Glow sky in the village Manga Mandi Lahore was 19.09 mag arcsec-2.
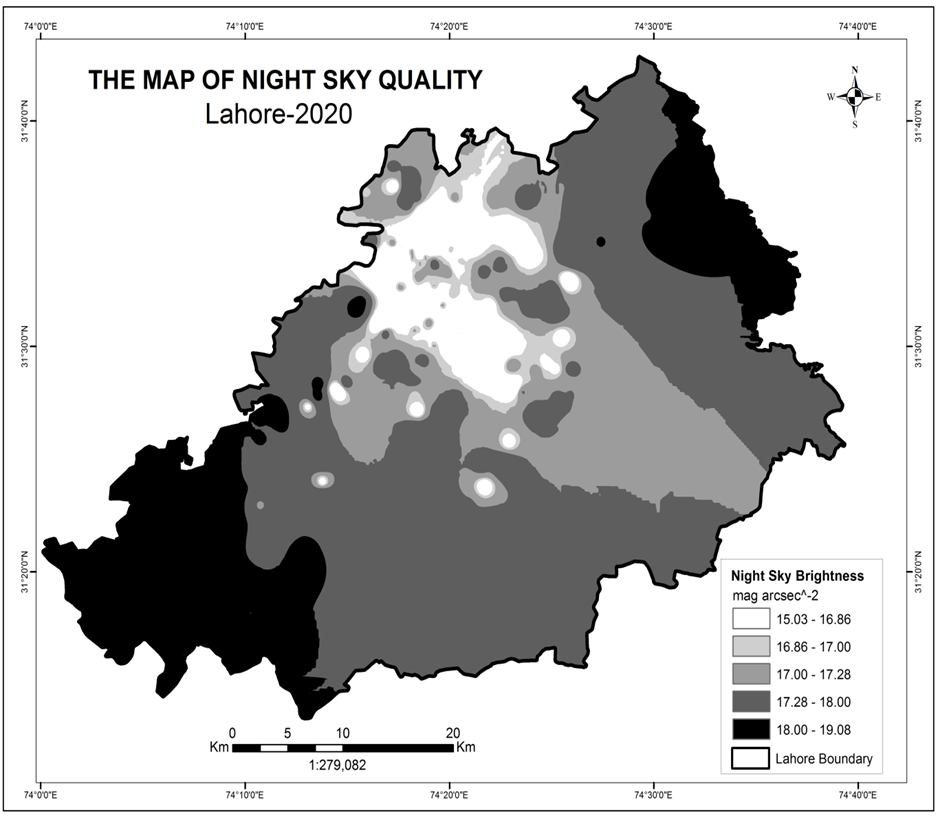
Figure 10. Map of Night Sky Quality Lahore
Figure 10 shows the glow of the sky and the night sky measured in colour magarcsec-2.
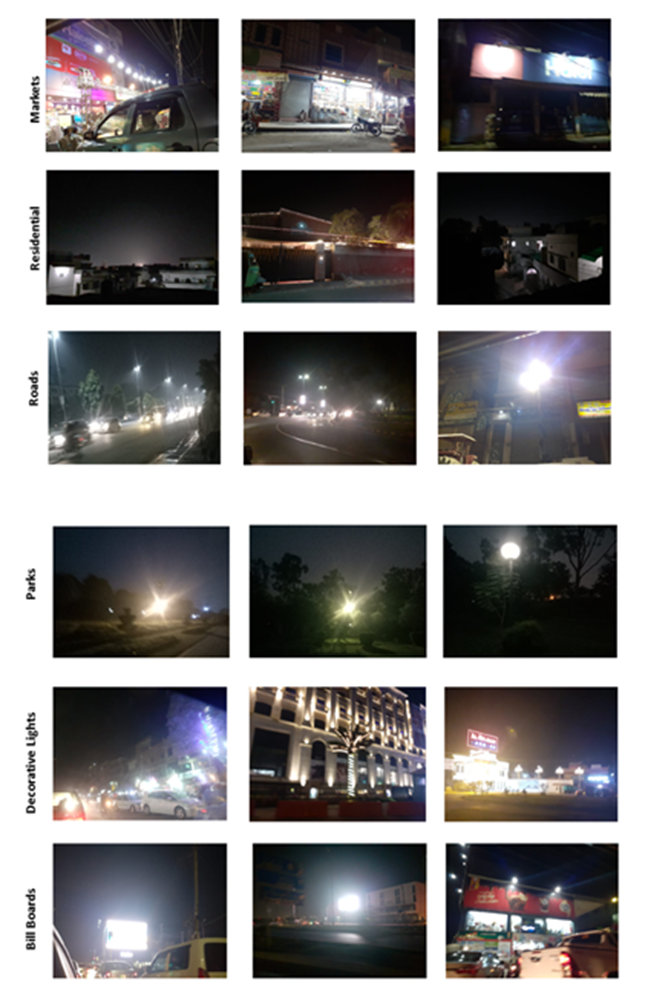
Figure 11. Light Condition Pollution at various places
Figure 11 illustrates the status of light pollution in residential, market, road and park sectors.
- CONCLUSION
This study synthesizes and tracks Spatio-temporal changes in light pollution and it investigates the quality night sky, measures human perceptions and identifies risks to human health through light pollution. VIIRS-DNB provides the night sky measuring information about artificial light pollution, called SQM-L and analysis of the nighttime satellite data in Lahore shows that light pollution has increased significantly over the past 7 years. In the study period, light pollution rose by around 23.43%. While analysis of night time light fluctuations shows that over 53.99% of Lahore suffered from light pollution, 42.51% of which had encountered large fluctuations, 11.48% of which had medium fluctuations. The remaining 46.01 percent of Lahore experienced from 2012 to 2019 lowest variations. Suburban, non-residential and agriculture zones with almost no light pollution are largely undeveloped, with low to lower fluctuations. In the metropolitan districts, commercial centers, markets and industrial areas of Lahore, great to high oscillations were observed. Results show that light pollution in Lahore is growing, with urbanization and the expansion of the infrastructure notably increasing in the residential districts of the city. Decision-makers and environmental policy can benefit from this. No large-scale light pollution study was undertaken in Pakistan before this examination. This study is an application to analyze the light pollution in Lahore of geospatial technologies.
This article dedicated to our first author Hajra Nisar, who died due to Covid-19 in December 2021.
Conflict of Interest. Authors declare no conflict of interest for publishing the manuscript in IJIST.
Project details. Nil
REFERENCES
- Gallaway., R.N. Olsen, and D.M. Mitchell. The economics of global light polltion. Ecological Economics 69(3): 658-665, 2010.
- Prastyo, and D. Herdiwijaya. Spatial Analysis of Light Pollution Dynamics Around Bosscha Observatory and Timau National Observatory Based on VIIRS-DNB Satellite Images. Journal of Physics: Conference Series. IOP Publishing, 2019.
- How Does Outdoor Lighting Cause Light Pollution?. Available from: https://www.delmarfans.com/educate/basics/lighting-pollution/, 2020.
- U. Kuechly. Aerial survey and spatial analysis of sources of light pollution in Berlin, Germany. Remote Sensing of Environment 126: 39-50, 2012.
- Chalkias., M. Petrakis., B. Psiloglou, and M. Lianou. Modelling of light pollution in suburban areas using remotely sensed imagery and GIS. Journal of Environmental Management 79(1): 57-63, 2006.
- Ngarambe., H.S. Lim, and G. Kim. Light pollution: Is there an Environmental Kuznets Curve?. Sustainable Cities and Society 42: 337-343, 2018.
- Nurbandi., F.R. Yusuf., R. Prasetya, and M.D. Afrizal. Using visible infrared imaging radiometer suite (VIIRS) imagery to identify and analyze light pollution. IOP Conference Series. Earth and Environmental Science.IOP Publishing, 2006.
- Falchi., P. Cinzano., D. Duriscoe., C.C. Kyba., C.D. Elvidge., K. Baugh., B.A. Portnov., N.A. Rybnikova, and R. Furgoni. The new world atlas of artificial night sky brightness.Science Advances 2(6): 1600377, 2016.
- Punjab. District at Glance- Geographical Conditions.Available from: https://lahore.punjab.gov.pk/geographic_conditions, 2020.
- Schulte-Römer., J.Meier., E. Dannemann, and M. Söding. Lighting Professionals versus Light Pollution Experts? Investigating Views on an Emerging Environmental Concern. Sustainability 11(6): 1696, 2019.
- D. Schuler., R. Schatz, and C.D. Berweger. From global radiance to an increased local political awareness of light pollution. Environmental science & policy 89: 142-152 2018.
- Zhao., B. Yu., Y. Liu., S. Yao., T. Lian., I. Chen., C. Yang., Z. Chen, and J. Wu. NPP-VIIRS DNB daily data in natural disaster assessment: Evidence from selected case studies.Remote Sensing 10(10): 1526 (2018).
- Xu., Q. Wang., J. Jin, and P. Jin. An increase in nighttime light detected for protected areas in mainland China based on VIIRS DNB data.Ecological Indicators 107: 105615 (2019).
- Qiu., X. Shao., C.Y. Cao., S. Uprety, and W.H. Wang. Assessment of straylight correction performance for the VIIRS Day/Night Band using Dome-C and Greenland under lunar illumination. International Journal of Remote Sensing 38(21): 5880-5898, 2017.
- Krikigianni., C. Tsiakos, and C. Chalkias. Estimating the relationship between touristic activities and night light emissions.European Journal of Remote Sensing 52(sup1): 233-246, 2019.
- Birriel, and J.K. Adkins. A simple, portable apparatus to measure night sky brightness at various zenith angles. JAAVSO 38: 221-229, 2010.
- Schlyter. Radiometry and photometry in astronomy. Available: stjarnhimlen. se/comp/radfaq. Html 1, 2019.
- Netzel, and P. Netzel. High resolution map of light pollution over Poland.Journal of Quantitative Spectroscopy and Radiative Transfer 181: 67-73, 2016.
- VIIRS Day-Night Band Cloud-free Composites. 2015.
- Leng., G. He, and W. Jiang. Investigating the Spatiotemporal Variability and Driving Factors of Artificial Lighting in the Beijing-Tianjin-Hebei Region Using Remote Sensing Imagery and Socioeconomic Data. International journal of environmental research and public health 16(11): 1950, 2019.
- Butt, M.J.(2012). Estimation of Light Pollution using Satellite Remote Sensing and Geogrpahic Information System Techniques. GIScience and Remote Sensing. 49[(4): 609-621, 2012.
- Mustafa, F., Bu, L., Wang, Q., Yao, N., Shahzaman, M., Bilal, M., Aslam, R. W., and Iqbal, R.: Neural-network-based estimation of regional-scale anthropogenic CO2 emissions using an Orbiting Carbon Observatory-2 (OCO-2) dataset over East and West Asia, Meas. Tech., 14, 7277–7290, 2021.
- Ahmad, A.; Ahmad, S.R.; Gilani, H.; Tariq, A.; Zhao, N.; Aslam, R.W.; Mumtaz, F. A Synthesis of Spatial Forest Assessment Studies Using Remote Sensing Data and Techniques in Pakistan. Forests 2021, 12, 1211.
- Shahzaman, M.; Zhu, W.; Ullah, I.; Mustafa, F.; Bilal, M.; Ishfaq, S.; Nisar, S.; Arshad, M.; Iqbal, R.; Aslam, R.W. Comparison of Multi-Year Reanalysis, Models, and Satellite Remote Sensing Products for Agricultural Drought Monitoring over South Asian Countries. Remote Sens. 2021, 13, 3294.
- Mustafa, F.; Wang, H.; Bu, L.; Wang, Q.; Shahzaman, M.; Bilal, M.; Zhou, M.; Iqbal, R.; Aslam, R.W.; Ali, M.A.; Qiu, Z. Validation of GOSAT and OCO-2 against In Situ Aircraft Measurements and Comparison with CarbonTracker and GEOS-Chem over Qinhuangdao, China. Remote Sens. 2021, 13, 899.
 |
Copyright © by authors and 50Sea. This work is licensed under Creative Commons Attribution 4.0 International License. |


