
Bacteriological and Physicochemical Analysis of Groundwater of Kasur
Syeda Sidrish Batool1, Asad Abbas2, Ijaz Hussain2, Abdul Wahab1, Aisha Shafique3 and Maryam Zaheer1.
1 Department of zoology, Government college of science, Wahdat road Lahore
2 Department of Zoology, University of the Punjab Lahore.
3 Government College University Faislabad
* Correspondence: Syeda Sidrish Batool E-mail : batoolsidrish @gmail.com
Citation | Batool.S.S, Abbas.A, Hussain.I, Zaheer.M1. “Bacteriological and Physicochemical Analysis of Groundwater of Kasur”. International Journal of Innovations in Science & Technology, Vol 01 Issue 04: pp 151-167, 2019.
DOI | https://doi.org/10.33411/IJIST/2019010409
Received | July 28, 2019; Revised |Aug 30, 2019 Accepted | Sep 06, 2019; Published | Sep 12, 2019.
Abstract.
Earth is a blue planet because of the rudimentary cause of life, that is water. All the biochemical reactions which are pre-requisite for nourishing life of animals and plants, use water as a basic element. Being a universal solvent, it dissolves almost all minerals present in the soil. It is one of the basic and necessary compounds responsible for the survival of life. The main purpose of research was to determine the quality of groundwater in Kasur near the tanneries. The study is focused on the bacteriological and physicochemical (pH, Temperature, DO, BOD, CO2, TOSM, TDS, TM and heavy metals) parameters. We selected four sites as Din Garh, Qatal Garhi, Mangal Mandi and Kot Haleem Khan for investigation. Coliforms were present in high concentration that produce viruses and bacterial diseases such as typhoid fever, hepatitis, gastrocnemii, dysentery and ear infections. World Health Organization (WHO) has justified that the drinkable water must have zero level of coliform and E.coli. Regarding the Total Suspended Matter (TSM), the values ranged from 0.3-0.5g/l in DIN GHARH, 0.2-0.5g/l in QATAL GHARHI, 0.2-0.5g/l in MANGAL MANDI and 0.2-0.6g/l in KOT HALEEM KHAN. The study concludes that the water pollution due to tanneries in Kasur have changed the bacteriological and physicochemical properties of ground water to a considerable level which is not drinkable. It also conclude that groundwater was contaminated with high concentrations of BOD, TOSM, TDS, TM and Heavy metals due to discharge of industrial effluents.
Keywords: Total Suspended Matter (TSM), Total Minerals (TMs), Total Organic Suspended Matters (TSOM Double Strength Lactose Broth (DSLB) Single Strength Lactose Broth (SSLB).
INTRODUCTION
Earth is a blue planet because of the rudimentary cause of life, that is water [1]. All the biochemical reactions which are pre-requisite for nourishing life of animals and plants, use water as a basic element [2]. Water is a universal solvent due to its dissolving property. The rule “like-dissolve-like” encompasses water solubility because of its chemical and electrostatic bonding, that is hydrogen-bonding which leads one to comprehend that water is not pure in nature, and it obtains polar-pollutants from its adjacent environment, humans and animals as well as from biological microscopic organisms [3,4,5].
Being a universal solvent, it dissolves almost all minerals present in the soil. It is one of the basic and necessary compounds responsible for the survival of life [6,7,8,9]. All the basic process including photosynthesis, osmosis, production and transportation are based on water. Water is the only compound which is found below, over and above the surface [10,11].
Ill-managed urban planning with its huge wastage, is one of major sources responsible for water to get polluted rapidly. There are many other sources which are turning fresh water to turbid like polytene bags, dumping sites, industrial discharge and many others. These sources produce bacteria, viruses and other health hazard factors especially carcinogenic elements [12,13,14,15].
As being a universal solvent, water plays a crucial role in purgative processes and become coherent with other elements [10,16,17,18]. Such contaminated water transports various unwanted elements to life governing cells that cause many water borne diseases like hepatitis and lung cancer etc[19,20]. As being a lattice of microbial growth, water becomes contaminated with bacterial as well as viral organisms. Bacterias are human friendly at one end but carry harmful diseases at the other end [21,22,23]. Numerous people suffer from different fetal diseases like typhoid, jaundice, diarrhea and diphtheria etc due to water pollution [24].
Demographic and weather changes affect the water quality and water table [25,26,27]. A variety of activities such as industrial waste, septic tank overflow or leakage of agricultural inputs, pesticides and urban waste are the major sources of groundwater pollution. The tannery is one of the major industrial sectors in Pakistan, which generate considerable amount of polluting materials that are discharged without any treatment into ponds or stagnant pools [28,29,30]. The water bodies receiving such highly polluted effluents are constantly becoming harmful to be used in agriculture, industry and drinking [31,32].
Throughout the biosphere, people used groundwater for drinking and believed that ground water could be used without any treatment [33]. But now it is proved scientifically that ground water is no more drinkable without treatment because we are fronting with many health hazardous challenges tactlessly grown from water mismanagements, poor drainage system and non-degradable polytene wastages in open places [34,35].
Pure water yields a healthy life. The availability of pure water has become a major problem for the developing countries like Pakistan [36,37,38]. In this research, the industrious adjoined populated area of Kasur is chosen to study the effect of industrial wastage on ground water [39,40]. The study site has become extra byzantine by total absenteeism of run-off treatment facilities [41].
Logistically, the surface water is unconstrained open water that is not suitable for drinking [42,43]. Unwanted elements including organic, inorganic or biological and bacteriological events e.g. Escherichia coli, coliforms and pseudomonas putida that churlish the water quality [44,45,46,47]. Among the biological pollutants, coliforms, fecal coliform and Escherichia coli are considered as main indicators of fecal contamination [48,49].
By definition, a coliform is a facultative anaerobe that ferments lactose to produce acid and gas when incubated at 35-37oC and is a gram-negative, non-spore forming rod shaped bacteria [50,51]. Escherichia coli and Entrobacter aerogens are the major representatives of this group. The Most Probable Number (MPN) of coliform and E. coli/100ml of water samples may range from <1 to>1100 which is significant while investigating the water borne diseases [52,53].
A record of E.coli or either coliform in water samples is an established protocol for assessing the fecal contamination of water sources, storage vessels and nature of pipes transporting water from a treated or untreated water reservoir [54,55]. Clearly it is the contribution of anthropogenic activities higher than the prescribed limit by international standards for human, agrarian and industrial customs [56].
Organic and inorganic compounds in water, are highly toxic and their toxicity depends upon the electronegativity [57,58]. Along with electronegativity of the elements, polarity also leaves a devasting effect on the nature of ground water because it decides the soft or hard nature of water [59]. Groundwater contaminated with transition metals pose a devasting effect to public health. It is so because transition elements are highly electron donors and also highly toxic as per environmental standards [60,61,62,63].
As being xenobiotics, the metals including cadmium, beryllium, aluminum, uranium, mercury, lead, bismuth, barium, antimony, arsenic, and so forth are known as toxic metals [64]. The heavy metals emitted by accidental oil spillage and discharged by industries, traffic, municipal wastes, and hazardous waste sites as well as from fertilizers for agricultural purposes are another source of water contamination [63,64,65,66,67].
The main purpose of research was to determine the quality of groundwater in Kasur near the tanneries. The study is focused on the bacteriological and physicochemical (pH, Temperature, DO, BOD, CO2, TOSM, TDS, TM and heavy metals) parameters.
MATERIALS AND METHODS
Present research focuses the ground water of Kasur. Groundwater samples were collected from four different locations: Din Garh, Qatal Garhi, Mangal Mandi and Kot Haleem khan. The water samples were collected at the same day with the difference of ten to fifteen minutes. About eighty groundwater samples were taken in sterilized glass bottles of 1000ml and immediately processed to compute temperature, pH, and Dissolved oxygen (DO). Same water samples were taken in another sterilized glass bottles of 500c.c which were brought to the laboratory for further analysis. One of the two bottles, was processed for Biological oxygen Demand (BOD) measurements while the other processed for determination of different bacteriological and physicochemical parameters. Carbon dioxide, Total Suspended Matter (TSM), Total Minerals and Total Organic Suspended Matters (TSOM) were computed by standard method. Sterile bottles are capable to prevent the accidental contamination of the water while its transportation to laboratory.
PRESENCE AND ENUMERATION OF COLIFORMS:
Most Probable Number (MPN):
MEDIUM PREPARATION:
Lactose Broth (LB) was used to detect coliform. Lactose utilization indicated by gas liberated in DUHARAM TUBES.
Typical composition (g/l):
Peptone from gelatin 5.0
Beef extract 3.0
Lactose 5.0
pH 6.9 ± 0.2 at 25 ºC
The prepared broth was clear and of light-yellow color.
PRESUMPTIVE TEST:
The presumptive test is used to determine if gas-producing lactose fermenters are present in water sample or not.
MATERIALS:
Durham tubes of DSLB (Double Strength Lactose Broth) 3
Durham tubes of SSLB (Single Strength Lactose Broth) 6
10ml pipette 1
1ml pipette 2
Method:
We used 9 test tubes for each 9 Petri plates therefore, 36 test tubes were used for 4 sites. SSLB and DSLB were prepared, 10 ml solution was transferred from SSLB in six test tubes and 10 ml from the DSLB in the remaining three test tubes. All test tubes were covered properly with cotton and sterilized them.
Three DSLB and six SSLB tubes were set up in a test-tube rack. Three DSLB tubes were labeled as 10 ml; the next three SSLB tubes 1.0 ml; the next three SSLB tubes 0.1 ml. Water bottle to be tested was mixed by shaking with 10 ml pipette, 10 ml of water to each of the DSLB tubes was transferred. With a 1.0 ml pipette, 1 ml of each water sample was poured to each of the next three tubes, and 0.1 ml to each of the third set of tubes. The tubes were incubated at 35 ºC for 24 hours. These tubes were examined in each set. Most Probable Number (MPN) was determined.
CONFIRMATORY TEST:
EMB AGAR (EOSIN METHYLENE-BLUE LACTOSE SUCROSE AGAR)
TYPICAL COMPOSITION (g/l):
Peptone 10.0
Di potassium hydrogen phosphate 2.0
Lactose 5.0
Sucrose 5.0
Eosin Y, yellowish 5.0
Methylene blue 0.4
Agar-Agar 13.5
PREPARATION:
• Suspended36 g/l, autoclave (15 min at 121 ºC), pour plates
• PH = 7.1 ± 0.02 at 25 ºC
• The plates were clear and reddish brown.
PREPARATION OF AGAR PLATE
AGAR solution was prepared in conical flask and was covered properly. Nine Petri plates were used for one sample and sterilized them in autoclave. All Petri plates were dried in oven before pouring. AGAR solution was poured in Petri plates in glass box and let the solution to get solid for few minutes. All the Petri plates were placed in incubator for 24 hours. Each petriplates was labeled according to the labeling on the test tubes. Next day the incoulam was spread from each test tube with the help of spreader in each petriplates in glass box. These petriplates were placed again in incubator. After 24 hours, bacterial colonies formed in the petriplates. Bacteria were present in sample water. This procedure was repeated for each water sample. Different colonies of bacteria with different shape and color were observed.
OXIDASE TEST
With a sterile swab, a small number of organisms were obtained from an AGAR plate. One drop of oxidase reagent (N,N,N’,N’-tetramethyl phenylenediamine dihydrochloride) was placed onto the culture on the swab. Negative reaction occurred that turned the bacteria to light pink.
TOTAL SUSPENDED MATTER (TSM)
The samples of the groundwater were examined at Pakistan Council of Scientific and Industrial Research Center (PCSIR) Lahore, for TSM and TOSM. One hundred millimeter of water sample from sampling station was centrifuged and the supernatant was discarded. The sedimented material was poured in the pre-heated and pre-weighed crucibles. Then these were incubated at 180 ºC for 1 hour to evaporate the water contents. Crucibles were again weighed and the TSM was measured by the following formula.
TSM= A-B.1000 mg/l
Water sample in ml
Where
A= weight of dried residues + crucibles in mg
B= weight of crucibles in mg
TOTAL ORGANIC SUSPENDED MATTER
About 100 ml of water sample was transferred in pre heated and pre weighed crucibles. These crucibles were placed in furnace at 550 ºC for two hours. After two hours, crucibles were again weighed and the TOSM was measured by following formula.
TOSM= A-B mg/l
A= Pre weighed of crucibles
B= Weighed of crucibles after two hours
DISSOLVED OXYGEN (DO)
DO matter was used for finding the rate of dissolution.
Carbon dioxide contents
Manual method (titrimetric method) was used for finding the content of CO2 in water.
Temperature and pH
Thermometer was used to compute temperature and pH meter was used for measuring the pH of water samples.
Heavy metals
Detection of heavy metals (Arsenic and Zinc) was executed by atomic absorption spectrophotometer in Pakistan Council of Scientific and Industrial Research Center (PCSIR) in Lahore.
SOME PHYSIOCHEMICAL ATTRIBUTES OF THE GROUNDWATER OF DIFFERENT AREAS OF KASUR
Results and Discussion.
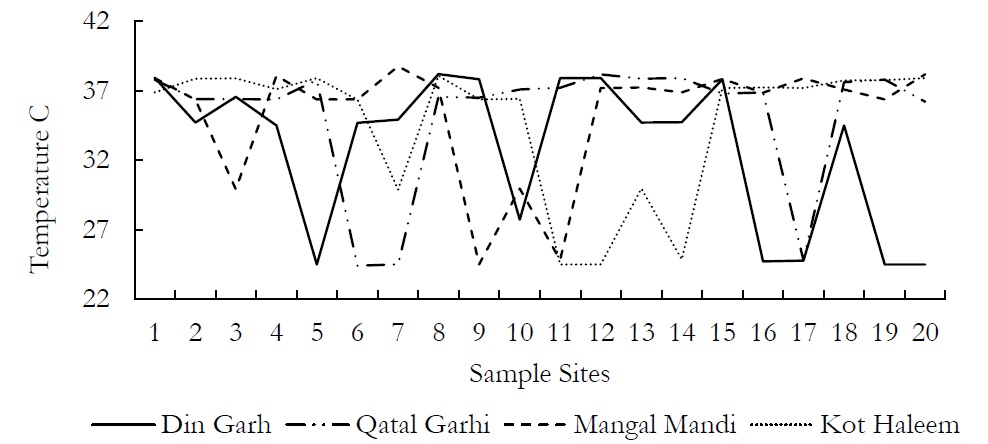
Figure 1. Variations in temperature values at various sites at an averaged depth of 150ft.
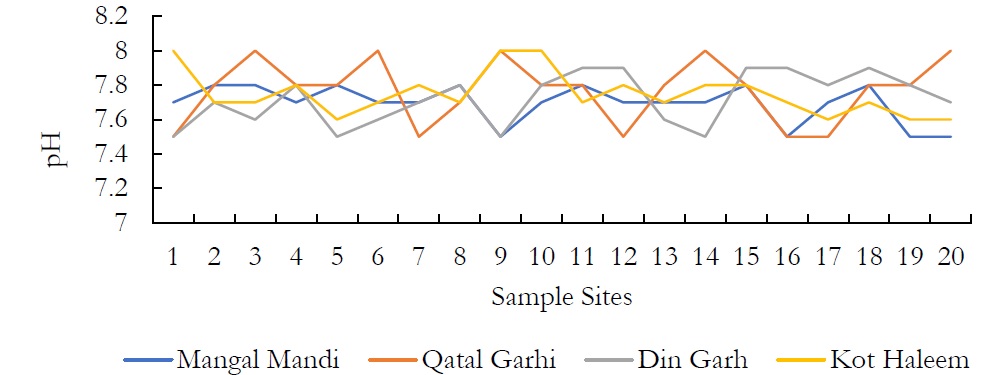
Figure 2. Variations in pH values at various sites at an averaged depth of 150ft.
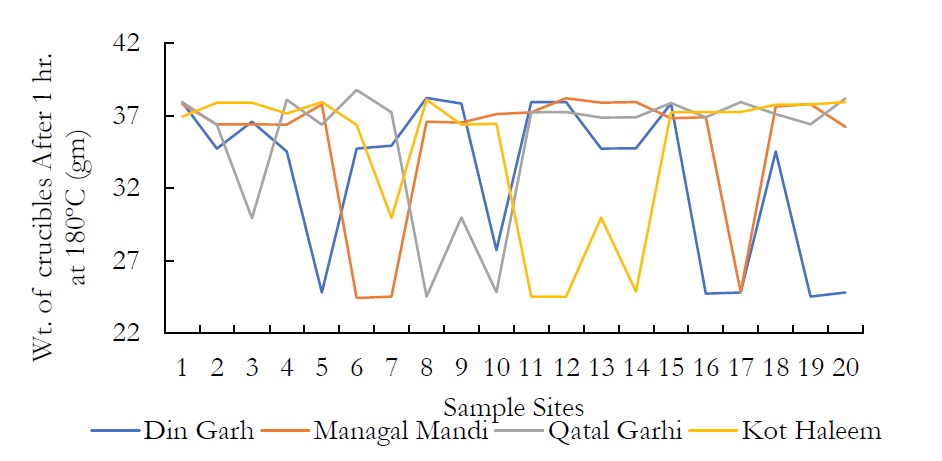
Figure 3. Wt. of crucibles After 1 hr. at 180ºC (gm) at various sites.
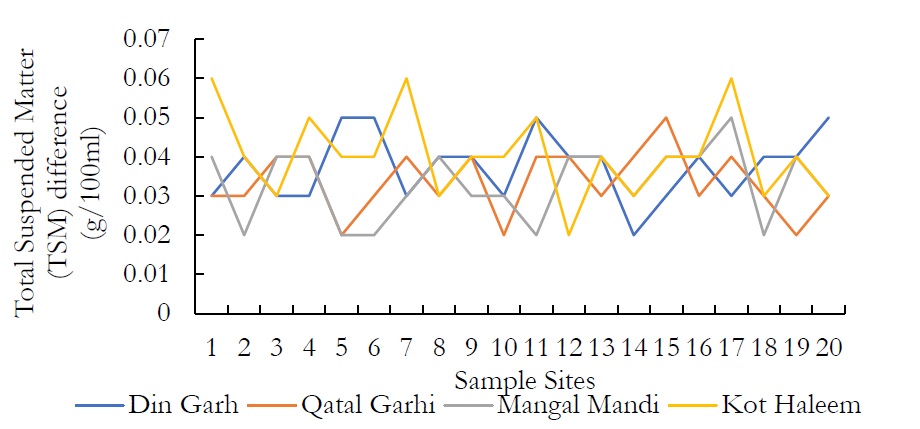
Figure 4. Total Suspended Matter (TSM) difference (g/100ml)
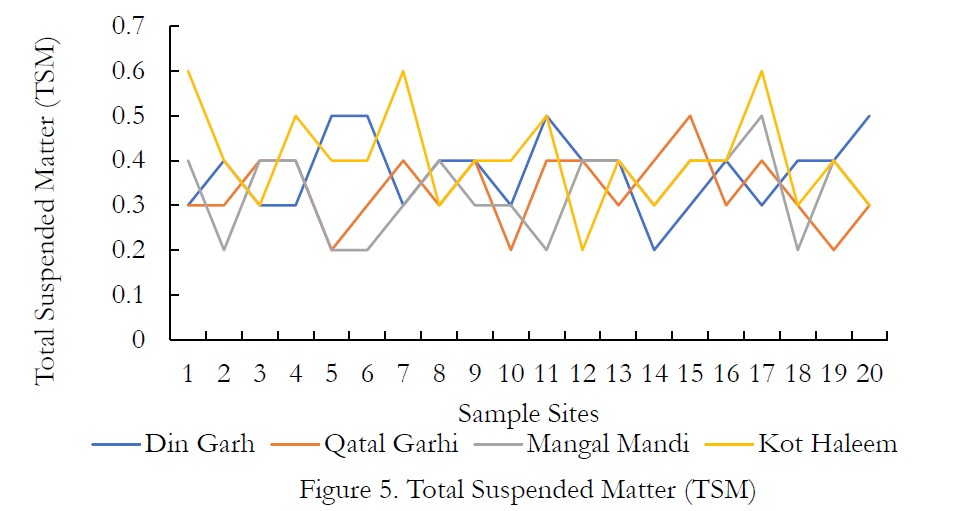
Figure 5. Total Suspended Matter (TSM)
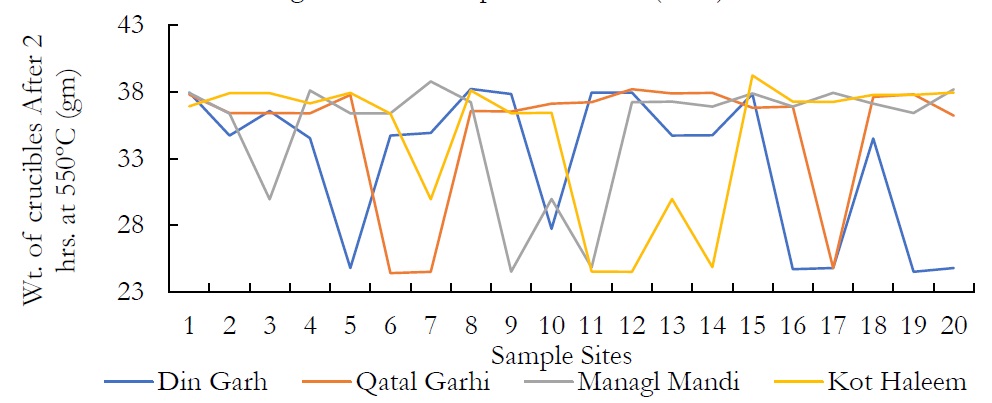
Figure 6. Wt. of crucibles After 2 hrs. at 550ºC (gm)
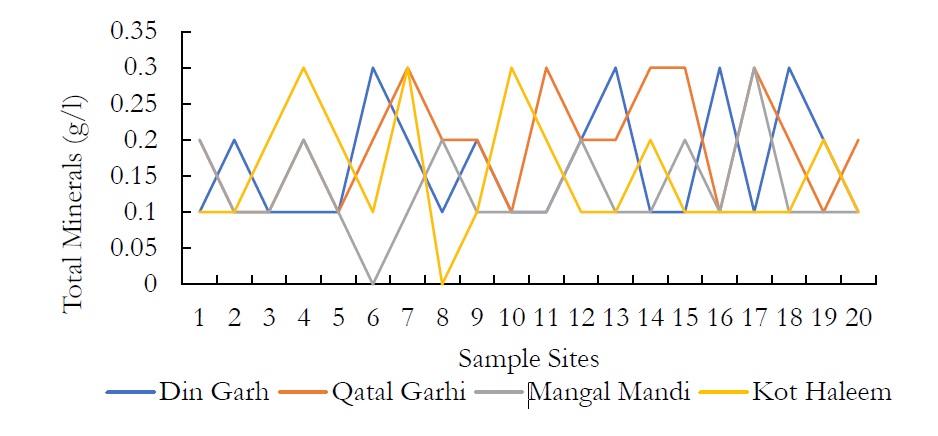
Figure 7. Total minerals (g/l) at various places in the study site.
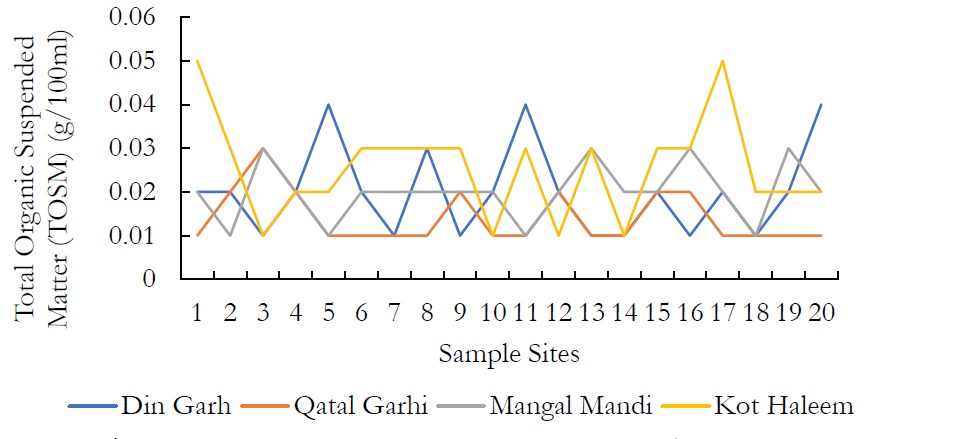
Figure 8. Total Organic Suspended Matter (TOSM) (g/100ml).
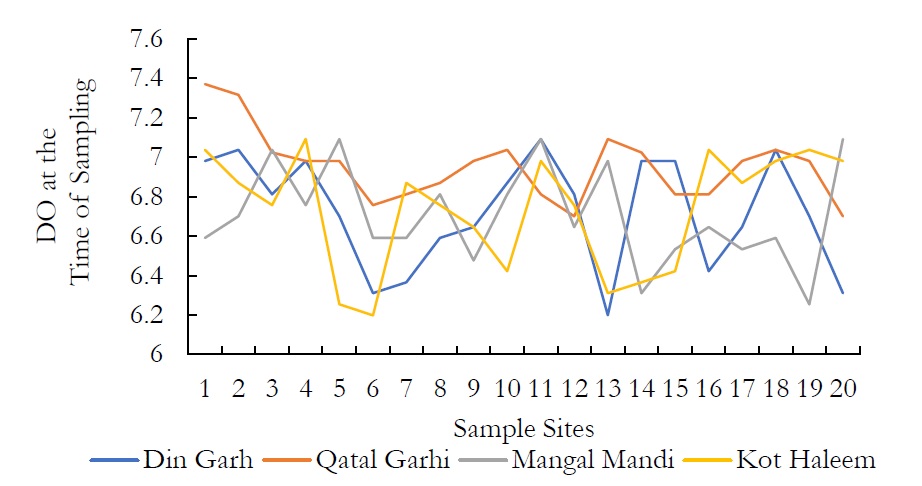
Figure 9. DO at the time of sampling.
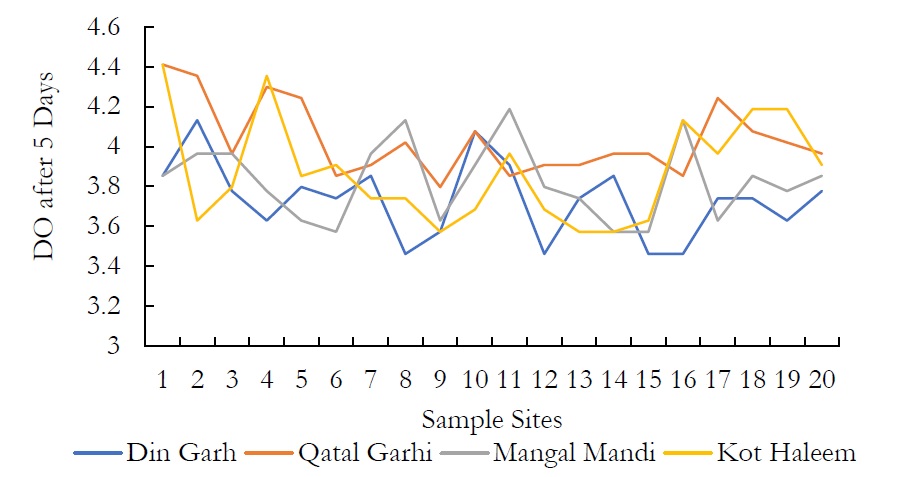
Figure 10. DO after a temporal window of 5 days.
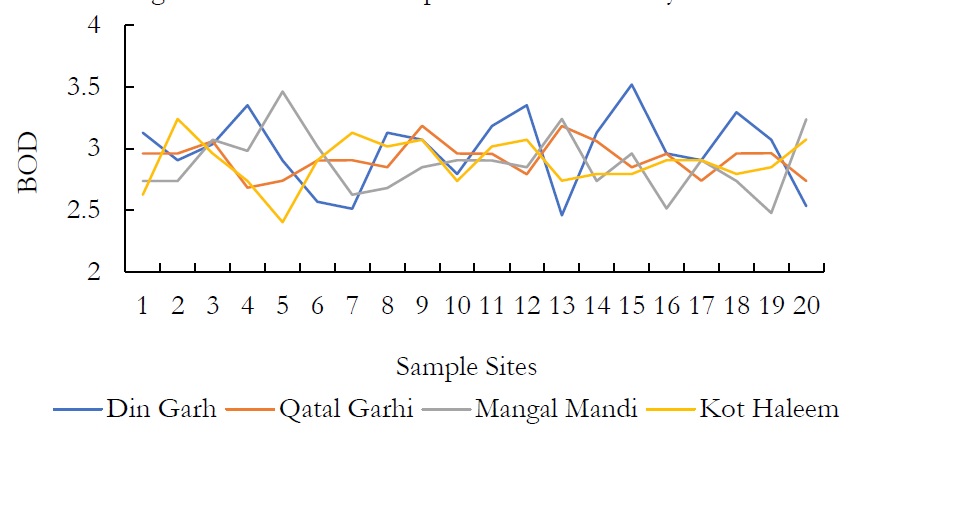
Figure 11. BOD at various sample sites.
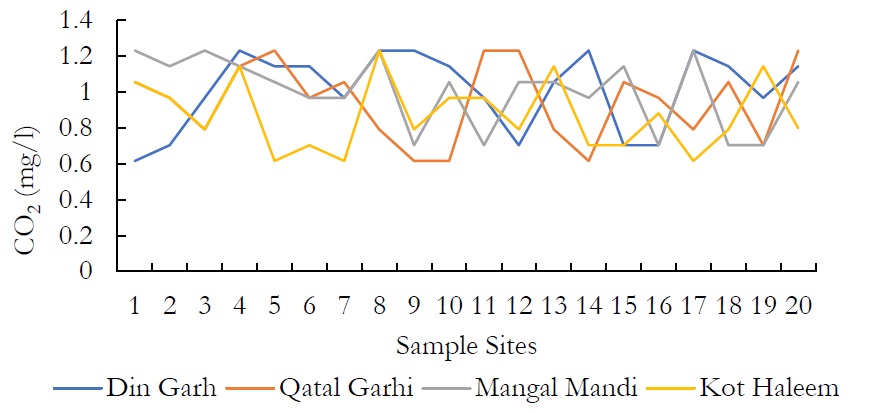
Figure 12. CO2 (mg/l) at various locations.
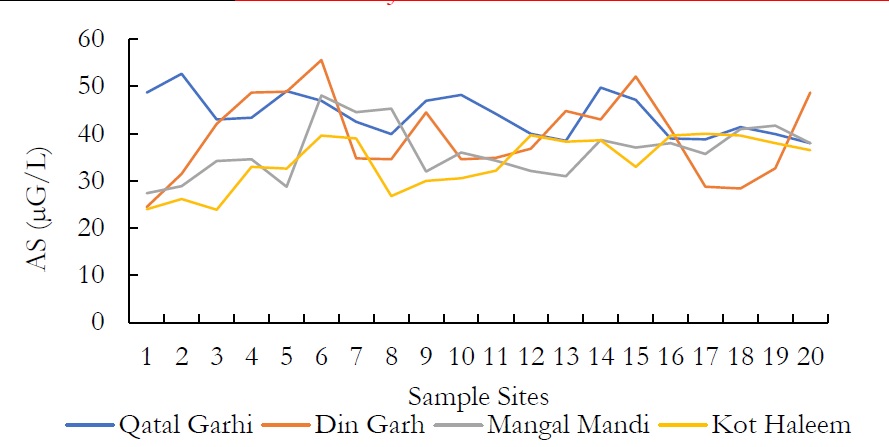
Figure 13. AS (μG/L) at various spatial locations.
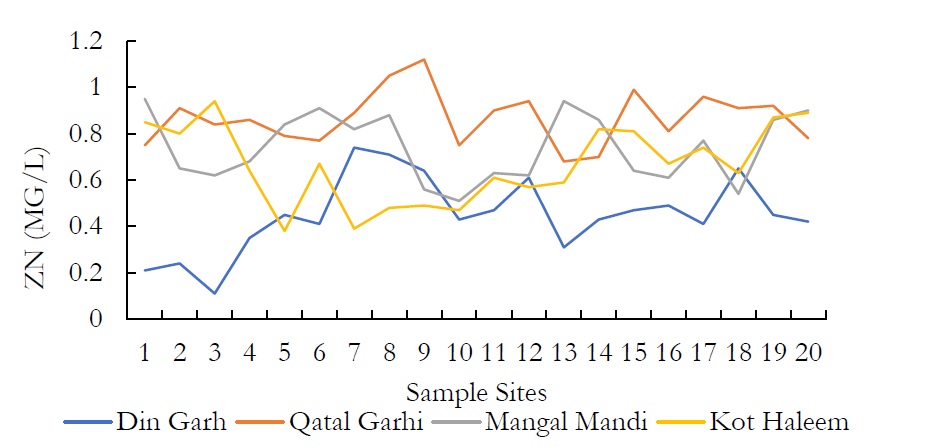
Figure 14. ZN (MG/L) at various spatial locations.
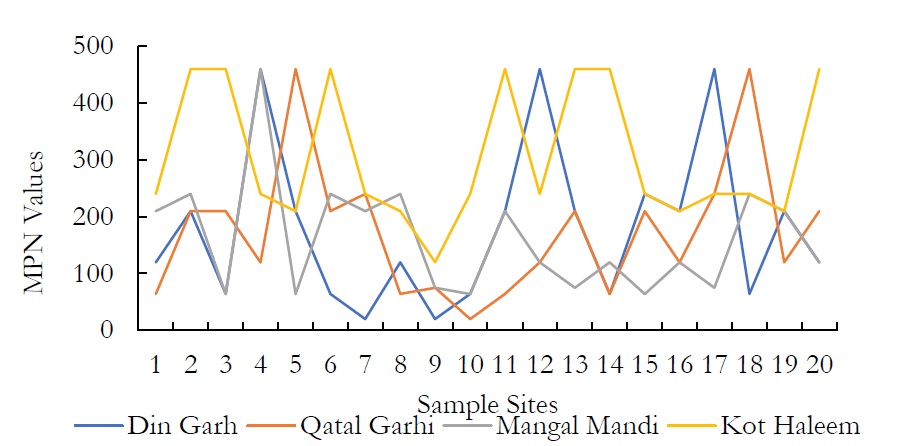
Figure 15. MPN values at various spatial locations.
All the human activities which take part in economic growth, either these are industrial, agrarian, fabric or fashion, these all affect groundwater badly. Current research was conducted in four different residential areas of Kasur. Kasur is an industrial city where physical, chemical and microbiological properties of groundwater had been changed due to anthropogenic activities during recent decade. People use ground water for drinking and for irrigation to their crops. In present study, 80 groundwater samples were collected from four different areas and different parameters (pH, Temperature, BOD, DO, CO2, TDS, TOSM and Heavy metals) were used to check the physicochemical and bacteriological contamination of groundwater. The physiochemical and bacteriological parameters of ground water were observed changed while making a comparative analysis with previous studies conducted in Kasur. The results show that the ground water of study site was polluted with physiochemical elements like heavy metals. Groundwater temperature was computed using a glass thermometer that ranged from 25-26ºC in DIN GARH area, 23-26ºC in QATAL GARHI area, 25-26ºC in MANGAL MANDI and 25-26ºC in KOT HALEEM KHAN area. The temperature values are within the permissible limits set by National Environment Quality (NEQS) so it can be used for irrigation purpose.
The pH of groundwater ranged between 7.5-7.9 in DIN GHARH, 7.5-8.0 in QATAL GHARI, 7.5-7.8 in MANGAL MANDI and 7.7-8.0 in KOT HALEEM KHAN. The pH of groundwater was observed neutral to alkaline in nature. These values of pH are within limit set by NEQS for pH that is 6-10.
The DO values were measured which were from 6.198-7.036 mg/l in DIN GHARH, 6.254-7.370 mg/l in QATAL GHARHI, 6.757-7.370 mg/l in MANGAL MANDI and 6.199-7.091 mg/l in KOT HALEEM KAN. There was a gradual decrease in DO values when computed after a temporal window of 5 days. The decrease in DO value ranged from 3.573-4.411mg/l in DIN GHARH, 3.573-4.132mg/l in QATAL GHARHI, 3.797-4.355mg/l in MANGAL MANDI and 3.462-4.132mg/l in KOT HALEEM KHAN. The decrease in the DO values after 5 days of respiration for first sampling might be due to elevated level of fecal bacteria. The DO concentration for groundwater ranged from 1.7mg/l-6.7mg/l according to international standards. Dissolved oxygen (DO) is the most important factor in the assessment of water quality. Suitable DO is energetic for aquatic life.
The BOD values of groundwater samples were ranged from 2.458-3.519 mg/l in the study areas. High levels of BOD in study area was due to industrial effluents containing huge amount of organic matter. Biological oxygen demand trials the recyclable materials in water and helps in the growth of bacteria and other organic by-products.
The values for CO2 were ranged from 0.616-1.144mg/l in DIN GHARH, 0.704-1.232mg/l in QATAL GHARHI, 0.616-1.232mg/l in MANGAL MANDI and 0.616-1.232mg/l in KOT HALEEM KHAN. Unlike oxygen, CO2 enters into chemical combination with water to form H2CO3, which in turn reacts with available limestone to form CO2 and bicarbonates.
Coliforms were present in high concentration in the complete study site. MPN values ranged from 20 to >1100 in all the groundwater sample sites. When the groundwater samples were processed for the coliform estimation, contaminants were found in all the samples of research areas restricted more than >1100 MPN. In fact, this value is in maximum range as per normal.
Coliform bacteria remain active in human and animal wastes. The bacterial contamination in ground water is studied by coliform test in water drainage system. The presence of coliform bacteria in groundwater indicates the mixing of surface water with ground water. Viruses and bacterial diseases such as typhoid fever, hepatitis, gastrocnemii, dysentery and ear infections can be contracted in water with high fecal coliform counts. World Health Organization (WHO) [67]has justified that the drinkable water must have zero level of coliform and E.coli. In this research it is justified that ground water of Kasur area is contaminated with fecal coliforms.
Regarding the Total Suspended Matter (TSM), the values range from 0.3-0.5g/l in DIN GHARH, 0.2-0.5g/l in QATAL GHARHI, 0.2-0.5g/l in MANGAL MANDI and 0.2-0.6g/l in KOT HALEEM KHAN. The nature of TSPM includes settleable particles, which require more than 6hrs. For the total minerals (TMs), more or less the same pattern was observed. WHO further designates the limit of TDS in drinking water that is 1000 mg/L however, high TDS concentration indicates that various minerals and solids have been dissolved in groundwater. High concentration of TDS governs the remarkable changes in water that effect the taste, hardness and corrosive property of the water. High TDS concentrations are due to the presence of bicarbonates, carbonates, sulphates, chlorides and calcium, which may originate from natural sources, sewage, urban runoff and industrial wastewater.
Total Organic Suspended Matter (TOSM) values of all the groundwater samples were ranged from 0.1-0.4g/l in DIN GHARH, 0.1-0.3g/l in QATAL GHARHI, 0.1-0.3g/l in MANGAL MANDI and 0.1- 0.5g/l in KOT HALEEM KHAN. High concentration of organic carbon states high concentration organic compounds as contaminants.
Atomic Absorption Spectrophotometer was used for the detection of heavy metals which resulted that both, surface and ground water are contaminated with heavy metals. The limits prescribed by WHO for toxic metal production as residual of industries is much lower that is in groundwater available in Pakistan. Both surface and groundwater are sponsors of heavy metals. Many of these metals are important in trace amount of human health. However, in higher amounts they cause water pollution and can be toxic causing serious health issues. Arsenic (As) and Zinc (Zn) are heavy metals which were found in the groundwater of Kasur.
The concentration of As in ground water was observed as 24-52 mg/L. Arsenic concentration vary widely in this groundwater. However, the chronic intake of high arsenic value in groundwater would potentially cause health hazards in future over a long-range period, since this element is reduced into arsenic, which is accumulated in the human body and arsenic is more difficult to remove from drinking water supplies than arsenate. The results show that the value of Zn was ranged from 0.21-0.74 mg/L in DIN GHARH, 0.68-1.12 mg/L in QATAL GHARHI, 0.54-0.95 mg/L in MANGAL MANDI and 0.38-0.94 mg/L in KOT HALEEM KHAN. The chronic drinking of additional Zn in water include severe gastrointestinal effects. Diminished immune function, vicissitudes in lipoprotein and cholesterol levels, abridge copper status and Zinc iron interactions.
CONCLUSION
The study concludes that the water pollution due to tanneries in Kasur have changed the bacteriological and physicochemical properties of ground water to a considerable level. Groundwater was contaminated with high concentrations of BOD, TOSM, TDS, TM and Heavy metals due to discharge of industrial effluents. The continuous release of agricultural runoff, untreated industrial discharges and drainage are the major causes of groundwater pollution in Kasur.
Author’s Contribution. All the authors contributed equally.
Conflict of interest. We declare no conflict of interest for publishing this manuscript in IJIST.
Project details. NIL
REFERENCES
[1]. ABOWEI, J. F. N. AND GEORGE, A. D. I., 2009. Some physical and chemical characteristics in okpoka creek, Nigeria. Res. J. Environ. Earth Sci. 1: 45-53.
[2]. VANLOON, G.W. AND DUFFY, S. J., 2005. The hydrosphere In: Environmental chemistry: A Global perspective 2nd Ed. 197-211. New York: Oxford university press.
[3]. MENDIE, U., 2005. The Nature of water. In: The Theory and practice of clean water production for domestic and industrial use. Lacto-medals publishers, Lagos. 1-21.
[4]. CHITMANAT, C. AND TRAICHAIYAPORN, S. 2010. Spatial and temporal variations of physical-chemical water quality and some heavy metals in water, sediments and fishes of the Mae Kuang river, Northern Thailand. Int. j. Agric. Biol. 12: 816-820.
[5]. SIMMONS, I. G., 1974. The ecology of natural resources. Edward Arnold Ltd, 25 HILL street, London.
[6]. TEMPLETON, R. G., 1948. Fresh water fisheries management. Fishing new books limited Franham, Surry, England.
[7]. HUSSAIN, M., 1989. Environmental degradation: Realities and Remedies. Ferozens (pvt) limited, 60 shahrah-e-Quaid-e-Azam, Lahore, Pakistan.
[8]. McKINNEY, M. L. AND SCHOCH, R. M., 1998. Environmental Science, System and Solutions. Jones and Bartlett Publishers, Sudbury, Massachusettes, London.
[9]. McMURRY, J. AND FAY, R. C., 2004. Hydrogen, oxygen and water, 4th Ed. In: HAMANN, K. P. (ed.). MUCMURRY FAY chemistry. Pearson Education, New jersey. 575-599.
[10]. DANIELOPOL, D. L., GRIEBLER, C. AND GUNATILAKA JOS, A., 2003. Present state and future prospects for ground water ecosystems. Environmental conservation, 30(2): 104-130.
[11]. YAKASAI, I. A., SALAWU, F. AND MUSA, H., 2004. Concentration of lead in ahmadu Bello univ. dam, raw, treated (tap) and ABUCONS pure water. Chem. class j. 1: 86-90.
[12]. BORCHARDT, M. A., HAAS, N. I. AND HUNT, R. J., 2004. Vulnerability of drinking water wells in La Crosse, Wisconsin to enteric-virus contamination from surface water contribution. Appl. Environ. Microbiol., 70: 5937-5946.
[13]. DORNLR, S., HUCK, P., SLAWSON, R. AND ANDLRSON, W., 2004. Assessing level of pathogenic contamination in a heavily impacted river used as a drinking water source. J. Toxicol. Environ. Hlth., 67: 1813-1823.
[14]. ATLAS, R. M. AND BERTHA, R., 1997. Microbial ecology fundamentals and application. Benjamin: comings science publishing. 1-69.
[15]. REID, D.C., EDWARDS, A.C., COPPER, D., WILSON, E. AND MCGAW, B.A., 2003. The quality of drinking water from private water supplies in aberdeenshire, uk. Water Res. 37: 245-254.
[16]. LATIF, Z., SAJJAD, M., TASNEEM, M. A., KHAN, I. J., FAZIL, M. AND ALI, M., 1999. J. Anal. And Envr. Chem., 4: 21.
[17]. GUNKEL, G., KOSMOL, J., SOBRAL, M., ROHN, H., MONTENEGRO, S. AND AURELIAN, O. J., 2007. Sugar cane industry as a source of water pollution-case study on the situation in Ipojuca River, pernambuco, Brazil. Water, Air and soil pollution 180(1-4): 261-269.
[18]. MOR, S., RAVINDRA, K., DAHIYA, R. P. AND CHANDRA, A., 2006. Leachate characterization and assessment of groundwater pollution near municipal solid waste landfill site. Environ. Monit. Assess. 118(1-3): 435-56.
[19]. AWAN, M. A., SIDDIQUE, M. I., KHAN, R. A. AND SHAH, A. H., 2002. Combined effect of salinity and industrial effluents on the growth of Eucalyptus Cammaldulensis dehnn. Pak. J. agri. Sci., 39(2): 80-82.
[20]. BACH, H., TARRE, S., AND GREEN, M., 1998. Post treatment of groundwater denitrification fluidization bed reactor effluent to achieve drinking water quality. J. IND. Microbial Biotechnol. 20(6): 354-359.
[21]. EISEN, C. AND ANDERSON, P. 1979. Effect of urbanization on Ground water Quality. Milwaukee Wisconcin USA, Jackson. 378.
[22]. KUMAR, A., 2002. Biomonitoring of sewage pollution. New Delhi: A P H publishing corporation. Inc. 39-103.
[23]. EDBERG, S. C., RICE, E. W., KARLIN, R. J. AND ALLEN, M. J., 2000. Escherichia coli: The best biological drinking water indicator for public health protection. J. Appl. Microbiol. Symp. Supplement, 88: 106-116.
[24]. BENSON, H. J., 1994. Microbial application, Laboratory Manual in general microbiology. W. M. C Brown publishers, Dubuque, U.S.A.
[25]. McLELLAN, S. L., 2004. Genetic diversity of Escherichia coli isolated from urban river and beach water, Appl Environ. Microbial, 70(8): 4658-4665.
[26]. WELCH, P., DAVID, J., CLARKE, W., TRINDADE, A., PENNER, D., BERSTEIN, S., MCDOUGALL, L. AND ADESIVUN, A. A., 2000. Microbial quality of water in rural communities of Trinidad. Panam. Salud. Publica., 9: 172-180.
[27]. GRANDJEAN, D., FASS, S., TOZZA, D., CAVARD, J., LAHOUSSINE, V., SABY, S., GUILLOTLAU, H. AND BLOCK, J. C., 2005. Coliform culturability in overversus understand drinking waters. Water Res., 39: 1878-1886.
[28]. TANDON, P., CHHIBBEER, S. AND REED, R. H., 2005. Inactivation of Escherichia coli and coliform bacteria in traditional brass and earthenware water storage vessels. Antonie Van Leeuwenhoek., 88: 35-48.
[29]. YADAV, R. K., GOYAL, B., SHARMA, R. K., DUBEY, S. K. AND MINHAS, P. S., 2002. Post-irrigation impact of domestic sewage effluent on composition of soils, crops and groundwater-a case study. Environmental international, 28(6): 481-48.
[30]. LONGE, E. O. AND BALOGUN, M. R., 2010. Groundwater quality assessment near a municipal landfill, lagos, Nigeria. 2(1): 39-44.
[31]. MONDAL, N. C., SINGH, V. S., SAXENA, V. K. AND PRASAD, R. K., 2007. Improvement of Groundwater Quality due to fresh water ingress in potharlanka island, Krishna Delta, India. Environ. Geol.
[32]. SHAKIR, L., EJAZ, S., ASHRAF, M., AHMAD, N. AND JAVEED, A., 2011. Characterization of Tannery Effluent wastewater by proton-induced x-ray Emissio(PIXE) Analysis to investigate their Role in water pollution, Environ. Sci. pollut. Res. 19: 492-501.
[33]. AZIZULLAH, A., KHATTAK, M. N. K., RICHTER, P. AND HADER, D., 2011 “Water pollution in Pakistan and its impacts on public health- a review” Environmental international, 37(2): 479-497.
[34]. SARDANS, J., MONTES, P. AND JOSEPH, P., 2011. Electro thermal Atomic Absorption Spectrometry to determine As, cd, cr, cu, hg and pb in soils and sediments: A review and perspectives, soil sediment contam., 20: 447-491.
[35]. BAREEN, F. AND TAHIRA, S. A., 2010. Efficiency of seven different cultivated plant species for phytoextraction of toxic metals from tannery effluent contaminated soil using EDTA, soil sediment contam. 19: 160-173.
[36]. BAREEN, F. AND TAHIRA, S. A., 2011. Metal Accumulation Potential of wild plants in Tannery Effluent Contamination soil of kasur, Pakistan: Field Trials for Toxic Metal clean up using saveda fruticose, j. Hazad Mater. 186: 443-450.
[37]. GILLER, K. E., WITTER, E. AND MCGRATH, S. P., 1998. “Toxicity of heavy metals to microorganisms and microbial processes in agricultural soils: a review,” soil Biology and Biochemistry, 30(10-11): 1389-1414.
[38]. VODELA, J. K., RENDEN, J. A., LENZ, S.D., MCHEL HENNEY, W. H. AND KEMPPAINEN, B. W., 1997. Drinking water contaminants. Poult. Sci., 76: 1474-1492.
[39]. IGWILO, I. O., AFONNE, O. J., MADUABUCHI, U. J. AND ORISAKWE, O. E., 2006. Toxicological study of the Anam River in otuocha, Anambra state, Nigeria. Arch. Environ. Occup. Health, 61(5): 205-208.
[40]. PAL, T., MUKHERJEE, P. K. AND SENGUPTA, S., 2002. Nature of arsenic pollutants in groundwater of Bengal basin-a case study from Basuipur area, west Bengal, India. Curr. Sci. 22(5): 554-561.
[41]. WANG, W., YANG, L., HOU, S., TAN, J. AND LI, H., 2001. Prevention of endemic arsenium with selenium curr. Sci. 18(9): 1215-1218.
[42]. ADEPOJU-BELLO, A. A., OJOMOLADE, O. O., AYOOLA, G. A. AND COKER, H. A. B., 2009. Quantitative analysis of some toxic metals in domestic water obtained from Lagos metropolis. The Nig. J. pharm. 42(1): 57-60.
[43]. CSURO, M., 1997. Environmental sampling and analysis of Lab Manual. Lewis Publishers, New York, USA.
[44]. HUSSAIN, F., 1989. Field and laboratory manual of plant ecology. National Academy of Higher Education, University Grants Commissions, H-9, Islamabad, Pakistan.
[45]. COLLIN, C. H., LYNE, P. M. AND GRANGE, J. M., 1995. Collins and Lyne’s Microbiological method. 206-212. Bulterworth, Heinemann Ltd., oxford.
[46]. MERCK, 1996. Microbiology Manual. Merk KGaA, Darmstadt, Germany 70-244.
[47]. KJOLLER, C., POSTMA, D. AND LARSEN, F., 2004. Groundwater acidification and the mobilization of trace metals in a sandy aquifer. Environ. Sci. Technol. 38(10): 2829-2835.
[48]. DOWNS, T. J., CIFUENTES-GACIA, E. AND SUFFET, I. M., 1999. “Risk screening for exposure to groundwater pollution in a waste water irrigation district of the mexico city region,” Environ. H. pers., 107(7): 553-561.
[49]. RASHID, M., AWAD, S. R. AND SALAM, M. A., 1995. “Monitoring of groundwater in Gabal el Asfar waste water irrigated area (Greater cairo),” W. sc. And Tech., 32(11): 163-169.
[50]. FAROOQI, F., MASUDA, H. AND FIRDOUS, N., 2007. Toxic fluoride and arsenic contaminated groundwater in the Lahore and kasur districts and possible contaminant sources. Environmental pollution 145: 839-849.
[51]. DUTKA, B. J., 1973. Microbiology Laboratories, Scientific Operations Division, Canada Center for Inland water, Burlington, Ontario.
[52]. NAEEM, M., KAZI, A. A., REEHMAN, S. AND IQBAL, J., 2008. Geo hydro chemical and isotopic study of the Effects of Tannery Effluents on the Groundwater Quality in kasur Area, j. chem. soc, pak., 30(1): 26.
[53]. KUMAR, A., BAGAVATHIRAJ, B. AND BAGAVATHIRAJ, K., 1996. Physicochemical and microbiological aspects courtallam water. Pollution Research, 15(2): 159-161.
[54]. MANAHAN, S.E., 1994. Environmental chemistry. 6th. Ed. Lewis publishers, CRC press Inc. USA.
[55]. LANGE, W., 1967. Effects of carbohydrates on the symbiotics growth of plankton blue-green algae with bacteria. Nature, 215-217.
[56]. KUENTZEL, L. E., 1969. Bacteria, carbon dioxide and algal blooms. J. water poll. Cont. Fed., 41: 1737-1747.
[57]. STYENBERG, M. C., VENTER, S. N., DE WET, C. M. E., DU PLESSIS, G., HOLOS, D., RODDA, N. AND KFIR, R., 1995. Water science and technology. Management of microbial water quality: New perspectives for developing Areas, 32: 183-191.
[58]. FRANCY, D. S., HEISE, D. R. AND NALLY, R. A., 2000. Occurrence and distribution of microbiological indicators in groundwater and stream water. Water Environment Research 72(2): 152-161.
[59]. BALAKRISHNAN, P., SALEEM, A. AND MALLIKARJUN, N., 2011. Groundwater quality mapping using Geographic information system (GIS): A case study of Gulberga city, Karanataka, india. Afr. J. Environ. Sci. Technol., 5: 1069-1084.
[60]. HARI HARAN, A., 2002. Evalution of drinking water quality at jalaripeta village of Visakhapatnam district Andhra Pradesh. Nat. Environ. Pollut. Technol., 1(4).
[61]. JOSEPH, K., 2004. A cleaner production approaches for minimization of total dissolved solid in reactive dying effluents. Centre for Environmental studies, Anna University, Chennai.
[62]. SOHANI, D., PANDE, S. AND SRIVASTAVA, V., 2001. Groundwater quality at Tribal Town: Nandurban (maha rashtra). Indian j. Environ. Ecoplan., 5: 475-479.
[63]. SUBBA, R. N., 1998. Groundwater quality in crystalline terrain of Guntur district Andhra Pradesh. Visakha sci. j., 2: 51-54.
[64]. STAHL, R. AND RAMADAN, A. B., 2008. Environmental studies on water Quality of the Ismailia canal / Egypt. Institut. fur Techniseche chemie.
[65]. LAURA, V., NEUS, O., ALBERT, S. AND ANGELS, C., 2004. Fertilizer characterization isotopic data (N, S, O, C and Sr) Environmental Science and Technology, 38: 3254-3262.
[66]. GUPTA, S. K. AND CHEN, K. Y., 1978. Arsenic removal by adsorption. Journal of water pollution control, federation 50: 493-506.
[67]. WORLD HEALTH ORGANIZATION 2004. Guidelines for drinking water quality. 1 recommendation. 3rd Ed. World Health Organization, Geneva.


