
Delineation of Drainage Network and Estimation of Total Discharge using Digital Elevation Model (DEM).
Rana Muhammad Imran1*, Abdul Rehman1, Muhammad Muzamil Khan1, Muhmmad Rahat Jamil 1, Usman Abbas1, Rana Saad Mahmood1, Syed Amir Mahmood and Rana M Ehsan.
1 Remote Sensing group, Department of Space Science, University of the Punjab, Quaid-e-Azam Campus, Lahore, Punjab, Pakistan.
*Correspondence | Rana Muhammad Imran E.Mail. rana.mimran22@gmail.com
Citation | Imran.R.M, Rehman.A, Khan.M.M, Jamil.M.R, Abbas.U, Mahmood. R.S, Mahmood..S.A, and Ehsan R.M, Delineation of drainage network and estimation of total discharge using Digital elevation Model (DEM). International Journal of Innovations in Science and Technology, Vol 01 Issue 02: pp 50-61, 2019.
DOI | https://doi.org/10.33411/IJIST/2019010201
Received | Feb 03, 2019; Revised | March 08, 2019 Accepted | March 11, 2019; Published | March 13, 2019.
________________________________________________________________________
Abstract.
The rapid urbanization and the population growth, have increased the demands of fresh water to manage various tasks from domestic to industrial scales.Various man driven sectors such as agriculture, industry and water filtration plants, require fresh water to cater the need of increasing population. Therefore, the management of available fresh water reservoirs is of great importance to save water for a sustainable future “save water save life”. Digital elevation model (DEM) is efficient to extract the drainage network, basin boundaries and to evaluate the volume of fresh water available in study site. We used Arc hydro tools in Arc GIS interface for extraction of drainage network in the study site. Flow direction and accumulation were computed according to Z-value of individual pixel available in the raster grid. A total 127 streams were extracted against 127 catchments. We observed that the catchments bearing steep slopes were incised in comparison to gentle slopes which were mostly eroded. We evaluated the total discharge in cusec using Q=CIA, where the coefficient ‘C’ of rainfall was substituted as 0.76 for each catchment having rocky soil type. The total discharge was estimated as 10871 cusec. GIS tools proved efficient to map watershed in the study site.
Keywords : Digital Elevation Model, Drainage Network, Discharged, Sustainable development; Water filtration plants.
1. Introduction.
The rapid urbanization and the population growth, have increased the demands of fresh water for consumption at domestic level [1]. The enhanced cycle of various human activities like agriculture, urbanization, and industrialization have put huge pressure on available reservoirs of fresh water. Therefore, water resource management have become one of the major issues to be resolved on emergency grounds. Integrated Basin Management (IBM) is a water saving technique which permit the usage of water in a sustainable manner. This technique is also efficient in reducing environmental issues. IBM consider the basin boundaries precisely to get fruitful results.
Digital Elevation Model (DEM) is the basic input which is manipulated in Arc GIS interface to extract basin boundaries. There is a big variety of platforms that offer DEM which include Shuttle Radar Topographic Mission (SRTM) at 90m resolution, and ASTER at 30m resolution. Various geometric errors have been observed in available auto generated models, therefore, the most accurate method of DEM generation is through field survey. Point data containing Z-values, is generated during the field visit. These data values are transformed into the shapefile for its processing that include 1) Identification/filling of sinks 2) Flow direction, (3) Flow accumulation and stream identification etc. [2,3].
Depression in DEM are known as sinks which are generated during data collection from the field. Sinks are actually no data values and their population is dependent upon the technique adopted for dem generation. Sinks must be removed by interpolated values of nearby pixels, to obtain a continuous drainage network. Several techniques are available to obtain depressionless DEM according to O’Callaghan 1984 [4] and Mark 1984 [5]. Some of these techniques are specific for shallow depressions but do not work in deep depressions. Flow direction can be estimated using a most commonly and widely used algorithm known as Deterministic Eight Node developed by O’Callaghan [4] and Mark [5], also known as D8 model. D8 is effective, simple and precise therefore, almost all commercial software use it for computation of flow direction [6]. However, many other techniques are also available to compute flow direction that include random four/eight node [7,8,9].Artificial plains are generated by filling depression as described in a series of studies [10,11,12,13,14,15,16,17]. The flow driven dataset is used further to compute flow accumulation which is a basic input dataset to compute the basin boundaries.
Furthermore, streams are defined by setting a threshold of drainage network. Actually, the threshold determines a minimum number of cells which will participate for individual stream generation. Stream density in drainage network is dependent upon the threshold value [18]. Stream density and threshold are in inverse relation with each other.Tabton,D.G. 1991 [19] and Ames D.2009 [20] have developed a technique to determine the stream threshold, but more probably stream density depends on the requirement of project[21,22,23]. Head water tracing approach was used by Vogt, E.V.2003 [24] to determine threshold for drainage area by incorporating a fitness index. A drawback of this technique is the exclusion of geomorphological features of the basin. Gokgoz,T. 2006 [7] was the first who developed a technique to determine threshold to extract stream network [25]. The stream cells were first identified by Heine, R.A.et al 2004 [26] that include First cell, Middle (flow all) and the End (edge) cell, which describes the nature of cells. According to Heine, R.A. et al 2004 [26], if a flow cell is surrounded by three other cells, it is referred as error flow cell.
Another system to delineate watershed is commonly known as WinBasin that is capable to compute realistic drainage network and to record hydrological responses [25]. Geo Hydro and HEC Geo HMS can compute drainage lines, cross section details and the pour points.Some other models associated to hydrology include water pollutant transportation models, flood models, and water supply model. These models are embedded in Geographic Information System (GIS) interface and are useful to extract spatially distributed hydrologic stimulations [11,27,28,29]. Water resource management and hydrological analysis, such as catchment delineation and streams network extraction [30] are important to study Topographic parameters and geomorphology of an area by delineation of drainage network [20,31,32]. Arc hydro tools are flexible to compute a variety of hydrological analysis, by their integration in Arc GIS interface. These tools are reliable to compute watershed characteristics including flow length and catchment boundaries using DEM [33].
The main objective of this study was to delineate watershed of southern part of Islamabad. It also aims at extraction of catchment areas, drainage network and finally the total discharge in cusec.
Study area.
This research was carried out in Rawlakot Pakistan and its outskirts. The study area is famous for its active geology. It is a hilly area with steep slopes where elevation fluctuates between 500-2500 meters from sea level. The study site is mapped in Figure 1. 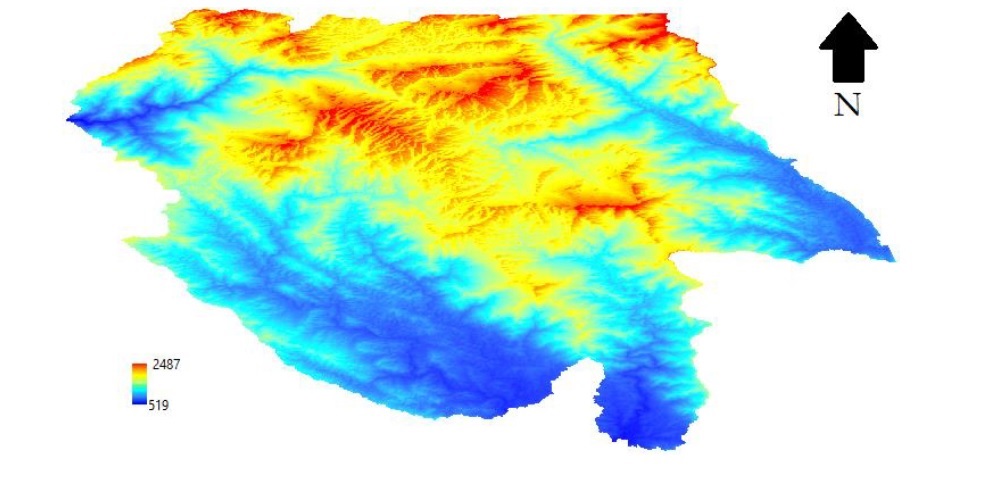
Figure 1. Study site.
2. Materials and methods.
Delineation of watershed is significant to study a test site in details. Erosion and incision are basic phenomenon which describe about the geology and structural arrangement of tectonic plates. Erosion leads to widening and incision is related to vertical cutting of rocks, therefore, the shape of drainage network expresses a clear picture of geomorphology.
The complete procedure to extract drainage network is shown in the Figure 2.
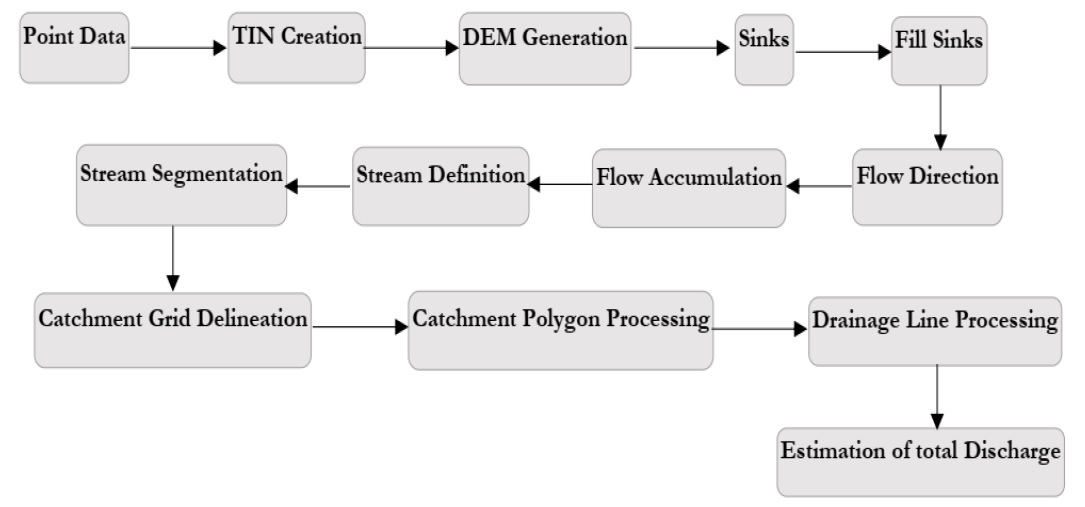
Figure 2. Flow of methodology used in this research.
DEM represents the 3D shape of terrain and also used as input to extract stream network. Various web-based forums offer DEM having different resolution but the most appropriate is the generation of own DEM using point data. The web-based forum offering DEM include SRTM (30 M, 90M) and Aster (30M) resolution. A DEM is comprised of s series of cells arranged in rows and columns. The individual cell of DEM includes Lat, Long and Z-value. A DEM may have abnormal values or nodata values. Abnormal value of any cell is very high Z-factor in comparison to average values of DEM and are commonly known as pits. The removal of sinks/pits from DEM is the pre-processing phase which is important to obtain continuous stream network as shown in the Figure 3.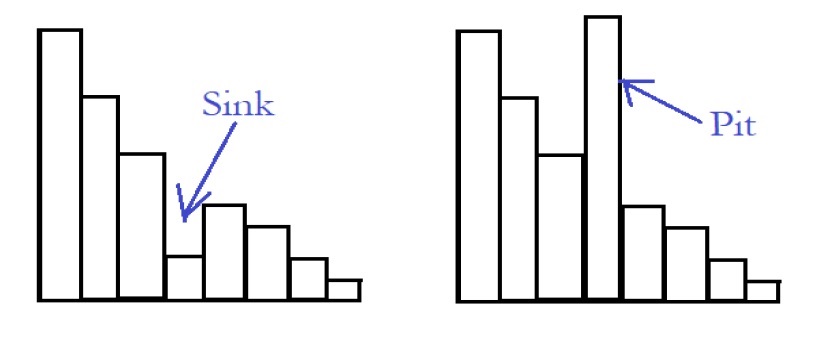
Figure 3. Representation of sinks and pits.
Fill utility, embedded in Arc Hydro tools, is efficient to fill sinks using nearest neighbor interpolation technique. High density of sinks in DEM, require more processing time for sink removal.
The earliest method to compute flow direction of each pixel in a grid was introduced by O’ Challaghan and Mark in 1984 [4] which has been used widely in many researches. This model is commonly known as D8 model which consider a single pixel and incorporate it’s 8 eight neighbors to compute the flow accordingly as shown in the Figure 4 as below.
Figure 4. D8 algorithm applied to central cell to compute flow direction.
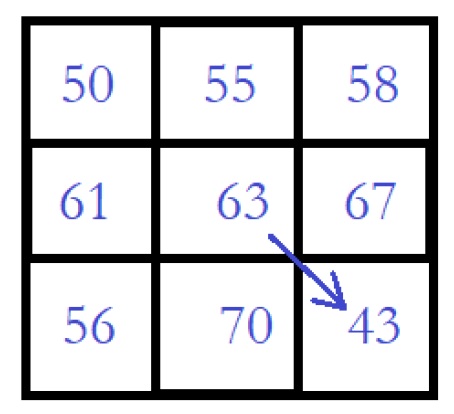
Figure 4. D8 algorithm applied to central cell to compute flow direction.
Figure 4 is showing the flow direction of central cell in any of direction. There may be possible eight directions in which the flow of central cell may be transported as shown in Figure 4. The direction of flow of central cell will be toward the cell having lowest Z- Value i.e., west east direction. The flow is accumulated by input of flow direction dataset computedbefore to generate a drainage network. In this process, flow cells are identified that contribute in generation of drainage network.
In the next step, streams were defined by providing a threshold value. This threshold value decides the density of stream network. Furthermore, the stream network was segmented at the node points using node analysis, to define a stream order using stream segmentation in Arc hydro tools. Stream segmentation is important process which define the catchment area against individual stream and the total discharge. To obtain the vector format, we generated the catchment polygons and drainage lines using the utility of catchment and drainage lines processing in Arc hydro tools.
We computed the total discharge in cusec against each stream using the equation as below [34],
Q = CIA
Where Q represents the total discharge in cusec, I is the intensity of rainfall, A is the area of catchment and C is the coefficient of rainfall. Coefficient of rainfall is an important indicator of soil type of the watershed. The value of C rages between 0 and 1, the value of C approaches to 0 for sandy soil type and toward 1 for clayish soil type.
Result and Discussion.
We applied Arc Hydro tools embedded in Arc GIS to delineated watershed of our study site and mapped the results in Figure 5. In the complete process, we followed the flow of methodology mentioned in Figure 2.
The A part of Figure 5 is showing topographic variations in the study site where the elevation in fluctuating from (519-2487) meter as compared to sea level. Flow direction is computed against each pixel using D8 algorithm and the results are shown in figure 5(B). In figure 5(C) the flow is accumulated and the streams are defined. We applied a threshold value to define streams. This threshold was given by keeping in view the required stream density. The streams were segmented at nodes to obtain a fractured stream network. We obtained a total 127 streams by applying stream segmentation algorithm. This segmented network is the basic input parameter to delineate catchment areas. The catchment areas are known as small basins. Arc hydro tools assign individual stream to each catchment to carry the complete flow of that catchment. The stream length within each catchment, defines the geology beneath a particular basin. The complete procedure up to this step was executed as raster analysis. Finally, we extracted polygons and drainage lines, in vector format to point out the main drainage line and to compute the area of each polygon.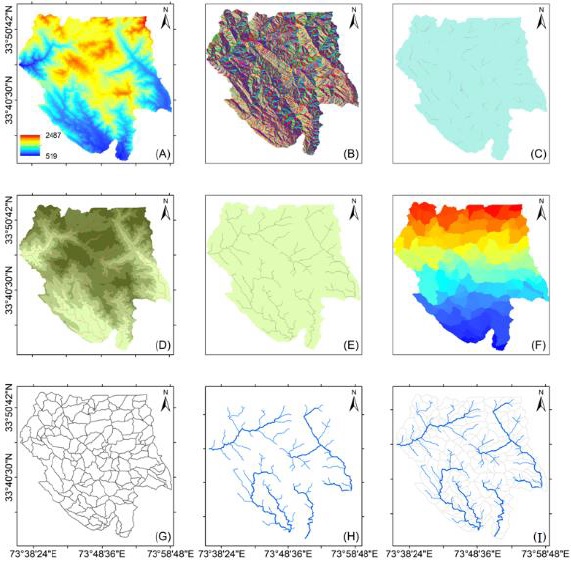
Figure 5. Step by Step delineation of drainage network (A) DEM (B) Flow direction (C) Flow accumulation (D) Stream definition (E) Stream segmentation (F) Catchment grid delineation. (G) Catchment polygon processing and (H) Drainage line processing. Overall stream network is shown in Figure 6 having main stream and connecting small streams along with catchment areas.
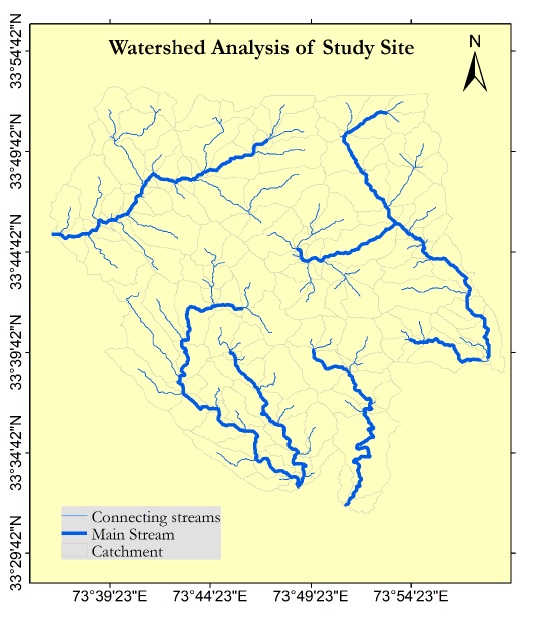
Figure 6. Drainage network representing main stream, connecting streams and catchments.
Discussion
Drainage analysis using DEM, is widely applicable globally. DEM actually describes the topographic variations regarding elevation in a study area. The study area that we selected for drainage analysis, was observed with high variations in elevation from (519-2487) meters. Such topographies are highly active regarding geology.
The shape of stream network, reflects the structural arrangement of rocks, where stream bends represent the existence of hard/soft rocks beneath the earth’s surface that drive water in a complex way like neural network in human body. A part of stream network isshown in Figure 7, where the path of main stream should be straight while reaching from point A to B but it is following the zig-zag path that represent a hard structure underneath the surface of earth as pointed out in Figure 7. On ground truthing, metamorphic rocks were observed at this location which are hard enough to diver the direction of water.
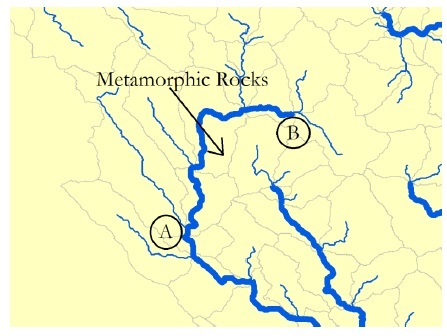
Figure 7. Detection of rock type underneath the surface of earth through drainage analysis.
Erosion and incision were also examined during the field survey. We observed erosion at two locations 1) where the stream network was bearing soft rocks and 2) where the shape of streams were comparatively straight. On the other hand, incision was observed on sharp bends bearing steep slopes.
We computed the total discharge in cusecs by incorporating the catchment areas of individual polygons. The data about intensity of rainfall was collected from local weather station which was 760mm. The coefficient of rainfall was substituted as 0.76 because the whole study areas was comprised of hard rocks therefore, water absorption by the land was limited. Most of rainfall water drains into nearby stream from each catchment due to less soil seepage capacity. Coefficient of rainfall is actually the “drainage limiting factor” that approaches to 0 in case of sandy soil type and toward 1 incase of hard rocks with less water absorption.
Estimation of total discharge in cusec is important to evaluate to construct stream network for saving fresh water in reservoirs. It is significant to evaluated the water carrying capacity of individual stream. We estimated a total drainage of 10871 cusecs in the study site.
Conclusion.
DEM is efficient to delineate watershed of the study site using Arc Hydro tool in Arc GIS interface. It enabled us to perform terrain analysis in 3D space. Pixel based Z-values presented the true picture of earth. The hydrological analysis enhanced the visibility of geological arrangements underneath the earth’s surface. We recommend to use point data for construction of DEM instead of downloading form any web forum to perform better analysis and to get improved results.
Author’s Contribution. All the authors contributed equally.
Conflict of interest. We declare no conflict of interest for publishing this manuscript in IJIST.
Project details. NIL
References.
1. Raza, S.M.H., Mahmood, S.A., Khan, A.A. et al. Delineation of Potential Sites for Rice Cultivation Through Multi-Criteria Evaluation (MCE) Using Remote Sensing and GIS Int. J. Plant Prod. (2018) 12: 1.
2. Chang, K.T. Introduction to Geographic Information Systems, 3rd ed.; McGraw-Hill: New York, NY, USA, 2006.
3. Li, Z.; Zhu, C.; Gold, C. Digital Terrain Modeling: Principles and Methodology; CRC Press: New York, NY, USA, 2005.
4. O’Callaghan, J.F.; Mark, D.M. The Extraction of Drainage Networks from Digital Elevation Data. Comput. Vis. Graph. 1984, 28, 323–344.
5. Mark, D.M. Part 4: Mathematical, algorithmic and data structure issues: Automated detection of drainage networks from digital elevation models. Cartogr. Int. J. Geogr. Inf. Geovis. 1984, 21, 168–178.
6. Jenson, S.K.; Domingue, J.O. Extracting Topographic Structure from Digital Elevation Data for Geographic Information-System Analysis. Photogramm. Eng. Remote Sens. 1988, 54, 1593–1600.
7. Gökgöz, T.; Ulugtekin, N.; Basaraner, M.; Gulgen, F.; Dogru, A.O.; Bilgi, S.; Yucel, M.A.; Cetinkaya, S.; Selcuk, M.; Ucar, D. Watershed delineation from grid DEMs in GIS: Effects of drainage lines and resolution. In Proceedings of the 10th International Specialised Conference on Diffuse Pollution and Sustainable Basin Management, Istanbul, Turkey, 18–22 September 2006.
8. Zhang, W.C.; Fu, C.B.; Yan, X.D. Automatic watershed delineation for a complicated terrain in the Heihe river basin, northwestern China. In Proceedings of the IGARSS 2005: IEEE International Geoscience and Remote Sensing Symposium, Seoul, Korea, 29 July 2005; Volume 1–8, pp. 2347–2350.
9. Zhou, Q.M.; Liu, X.J. Error assessment of grid-based flow routing algorithms used in hydrological models. Int. J. Geogr. Inf. Sci. 2002, 16, 819–842.
10. Costa-Cabral, M.C.; Burges, S.J. Digital Elevation Model Networks (Demon)—A Model of Flow over Hillslopes for Computation of Contributing and Dispersal Areas. Water Resour. Res. 1994, 30, 1681–1692.
11. Fairfield, J.; Leymarie, P. Drainage Networks from Grid Digital Elevation Models. Water Resour. Res. 1991, 27, 709–717.
12. Garbrecht, J.; Martz, L.W. The assignment of drainage direction over flat surfaces in raster digital elevation models. J. Hydrol. 1997, 193, 204–213.
13. Jones, R. Algorithms for using a DEM for mapping catchment areas of stream sediment samples. Comput. Geosci. 2002, 28, 1051–1060.
14. Martz, L.W.; Garbrecht, J. An outlet breaching algorithm for the treatment of closed depressions in a raster DEM. Comput. Geosci. 1999, 25, 835–844.
15. Tarboton, D.G. A new method for the determination of flow directions and upslope areas in grid digital elevation models. Water Resour. Res. 1997, 33, 309–319.
16. Tribe, A. Automated Recognition of Valley Lines and Drainage Networks from Grid Digital Elevation Models—A Review and a New Method. J. Hydrol. 1992, 139, 263–293.
17. Turcotte, R.; Fortin, J.P.; Rousseau, A.N.; Massicotte, S.; Villeneuve, J.P. Determination of the drainage structure of a watershed using a digital elevation model and a digital river and lake network. J. Hydrol. 2001, 240, 225–242.
18. Gülgen, F.; Gökgöz, T. A New Algorithm for Extraction of Continuous Channel Networks without Problematic Parallels from Hydrologically Corrected Dems. Boletim de Ciências Geodésicas 2010, 16, 20–38.
19. Tarboton, D.G.; Bras, R.L.; Rodriguez-Iturbe, I. On the Extraction of Channel Networks from Digital Elevation Data. Hydrol. Processes 1991, 5, 81–100.
20. Ames D, Rafn E, Van Kirk R, Crosby B: Estimation of stream channel geometry in Idaho using GIS-derived watershed characteristics. Environ Model Softw2009,24(3):444–448. 10.1016/j.envsoft.2008.08.008
21. Tarboton, D.G.; Ames, D.P. Advances in the mapping of flow networks from digital elevation data. In Bridging the Gap: Meeting the World’s Water and Environmental Resources Challenges; Amer Society of Civil Engineers: Reston, VA, USA, 2001; pp. 1–10.
22. Tang, G. A Research on the Accuracy of Digital Elevation Models; Science Press: Beijing, China, 2000.
23. Oliveira, F.; Furnans, J.; Maidment, D.R.; Djokic, D.; Ye, Z. Arc Hydro: GIS for water resources. In Arc Hydro: GIS for Water Resources; Maidment, D.R., Ed.; ESRI, Inc.: Redlands, CA, USA, 2002; Volume 1, pp. 55–86.
24. Vogt, E.V.; Colombo, R.; Bertolo, F. Deriving drainage networks and catchment boundaries: A new methodology combining digital elevation data and environmental characteristics. Geomorphology 2003, 53, 281–298.
25. Lin, W.T.; Chou, W.C.; Lin, C.Y.; Huang, P.H.; Tsai, J.S. Automated suitable drainage network extraction from digital elevation models in Taiwan’s upstream watersheds. Hydrol. Processes 2006, 20, 289–306.
26. Heine, R.A.; Lant, C.L.; Sengupta, R.R. Development and comparison of approaches for automated mapping of stream channel networks. Ann. Assoc. Am. Geogr. 2004, 94, 477–490.
27. Konadu D, Fosu C: Digital Elevation Models and GIS for Watershed Modelling and Flood Prediction -A Case Study of Accra Ghana. In Appropriate Technologies for Environmental Protection in the Developing World. Springer; 2009:325–332.
28. Moharana P, Kar A: Watershed simulation in a sandy terrain of the Thar desert using GIS. J Arid Environ 2002,51(4):489–500.
Wu S, Li J, Huang G: A study on DEM-derived primary topographic attributes for hydrologic applications: sensitivity to elevation data resolution. Appl Geogr2008,28(3):210–223.
30. Zhang H, Huang GH, Wang D: Establishment of channel networks in a digital elevation model of the prairie region through hydrological correction and geomorphological assessment. Can Water Resour J 2013,38(1):12–23.
31. Jenson S: Applications of hydrologic information automatically extracted from digital elevation models. Hydrol Process 1991,5(1):31–44.
32. Lacroix M, Martz L, Kite G, Garbrecht J: Using digital terrain analysis modeling techniques for the parameterization of a hydrologic model. Environ Model Softw 2002,17(2):125–134.
33. Lin WT, Chou WC, Lin CY, Huang PH, Tsai JS: WinBasin: using improved algorithms and the GIS technique for automated watershed modelling analysis from digital elevation models. Int J Geogr Inf Sci 2008,22(1/2):47–69.
34. Liu, B., Wang, D., Fu, S. et al. “Estimation of Peak Flow Rates for Small Drainage Areas” Water Resour Manage (2017) 31: 1635.
 |
Copyright © by authors and 50Sea. This work is licensed under Creative Commons Attribution 4.0 International License. |


