
Estimation of Multidimensional Urban Poverty in South Asian Cities: A Case of Lahore Metropolitan Area
Khadija Waheed1, Ayesha Khalid1 and Shams Ur Rehman1
1 Govt College University, Lahore.
* Correspondence: Khadija Waheed: khadijawaheed48@gmail.com.
Citation | Waheed.K, Khalid.A and Rehman.S “How to deal with Multidimensional
Urban Poverty in South Asian Cities: A Case of Lahore Metropolitan Area”. International
Journal of Innovations in Science & Technology, Vol 02 Issue 04: pp 162-180, 2020.
Received Nov 10, 2020; Revised | Nov 26, 2020; Accepted | Nov 27, 2020;
Published | Dec 01, 2020.
Abstract.
Continuous monitoring of spatial variations in urban poverty is a complex multidimensional phenomenon. In urban areas of South Asian countries, various factors contribute to promote urban poverty e.g., rapid and unmanaged urbanization, high migration and inflation rates and fluctuations in land values. The poor community should be focused by policy makers to solve poverty related issues. This research was conducted in a metropolitan city Lahore in Punjab province of Pakistan which is confronting with urban poverty and need to construct a policy for poverty alleviation. Alkire-Foster approach was used to compute urban poverty by
selecting poverty cut off point k=2/5 for this study. It demonstrates that 70.8% of households were poor whereas 29.8% households were living out of poverty with positive potentials. The results can be taken as a reference point to alleviate poverty in other regions of country.
Keywords: Multidimensional poverty; Metropolitan; Alkire & Foster approach; poverty cut off
point and poverty indices.
Introduction.
Poverty refers to pronounced deprivations in human well-being in various dimensions [1,2]. It is considered a complex and multifaceted phenomenon [3] to evaluate for rapidly growing urban areas. Poverty has become a major challenge to the socio-economic prosperity for almost half of the world [4]. The poverty was deep rooted in rural areas, but it has become obvious and prevailing urban issue from the last few decades [4]. In urban areas of South Asian countries, various factors contribute to promote urban poverty e.g., rapid, and unmanaged urbanization, high migration and inflation rates and fluctuations in land values [5,6].
Construction and expansion of squatter settlements and slums in center and periphery of cities is the root cause of poverty in urban areas [7].
Living in poverty excludes people from opportunities and decent employment [8] consequently, affecting their psychological and societal well-beings. It is responsible for generating other social issues like street crimes, environmental pollution and availability of clean water [9, 10, 11]. Therefore, Sustainable Development Goals (SDGs) adopted by United Nations in 2015 include eradication of poverty as the prime target to be achieved by 2030. The reforms need to be introduced to achieve the ultimate prosperity. By taking into account, the
adverse impacts of poverty as well as in achieving the poverty eradication goals, substantial
literature helps to analyze all hurdles on the way of prosperity and to analyze all issues more
appropriately.
Paradigm Shift in Poverty Measuring Approaches
Poverty is considered as multidimensional issue and it has been widely evaluated using traditional one-dimensional approach in broader aspect i.e., income or consumption. In recent years, a growing consensus regarding the insufficiency of one-dimensional poverty measure arouse the need for multidimensional poverty measures which could reflect the poverty situation more comprehensively. Consequently, in 2007 Alkire and Foster (AF) formulated a comprehensive dual cut off method for evaluating poverty in multidimensional perspective.
AF method has been widely used by researchers and policy makers because of its friendly mechanism [12, 13, 14, 15]. AF method is considered as one of the best multidimensional poverty measuring mechanism [16] [17].
Multidimensional Poverty Index (MPI) is an index developed by Alkire and Santos (2010) which follows Alkire and Foster (2007, 2011) dual cut off methodology for poverty evaluation [18]. MPI portrays the in-depth picture of poverty in multiple dimensions as well as monitoring the progress in achieving SDG i.e., aims to eliminate poverty by 2030 from everywhere. Therefore, estimation of MPI by using AF methodology has gained vast attention globally by researchers and policy makers in recent years [18, 19, 20].
The poverty has become one of the largest problems due to its influence over global population specially in South Asian countries. It is surveyed that about 1.3 billion people i.e. 23.1% of global population is multidimensional poor out of which 792 million belong to lower/middle income countries where poverty index ranges from 0 to 86.7% [21]. Pakistan lies below the line of middle income countries.
Poverty Assessment in Pakistan
As a result of commitment with UN in achieving SDGs, MPI was created first time in Pakistan in 2016 by using data from Pakistan Social and Living Standard Measurement (PSLM) surveys. About 38.8% people were found multidimensional poor with average proportion of deprivations of about 50.9% and MPI was 0.198 [22]. In Pakistan, some studies have been conducted for assessment of poverty in multidimensional perspective by adopting AF methodology. Idrees, M. (2017) [23] prepared poverty indices for Pakistan through AF
approach by taking 6 dimensions that include education, health, house services, quality of house, additional services and women empowerment. Multidimensional Poverty was also estimated for Pakistan at national and provincial levels by adopting AF approach [24]. In addition MPI was generated for Punjab province at district level [25].
Moreover, different studies have been conducted to assess poverty for different cities of Pakistan. Khan A.U (2014) [26] examined the magnitude of multidimensional poverty in Rawalpindi city by incorporating education, health and living style of residents. Determinants of urban poverty have also been analyzed in Multan [27] and Sargodha city [28]. Furthermore, the magnitude and determinants of poverty have been analyzed for Christian [29].
In order to properly address this issue and achieving SDG, poverty evaluation studies may be enriched at lowest administration level of major cities like Lahore and Karachi where intracity disparities predominantly found which in turn cause urban poverty. Urban poverty is known as one of major issues in Lahore city where inter-city inequalities prevails in great extent. The most visible demonstration of this issue is the increase
in the quantity and physical density of inner-city slums due to current urban trends. Therefore, Ravi Zone in Lahore metropolitan area is selected to assess urban poverty along with identifying its key contributors.
Materials and Methods
Investigation site.
Ravi town is one of the administrative zones in Lahore metropolitan area, located north-west of Lahore as shown in Figure 1. The latitudinal and longitudinal extent of Ravi Zone is from 74.249o – 74.307o N and 31.589o – 31.616o E respectively. The population of Ravi Zone is approximately 1368506 along with 152750 total number of households (Ravi Zone Administrative Office). River Ravi also flows across north-south of this zone. Ravi zone is segregated into three administrative zones including Shahdra, Badami Bagh and Walled city.
It has total 34 Union Councils (UCs-Union councils are the smallest administrative unit within a city) out of which 14 UCs lies in Shahdra zone, 12 UCs in Badami Bagh zone whereas Walled
city zone has 8 UCs.
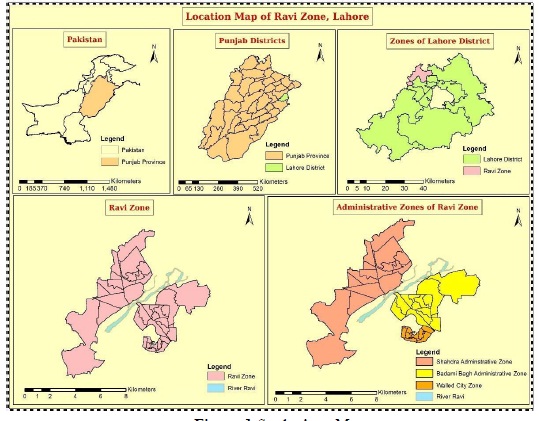
Figure 1. Study Area Map
Ravi Zone is diverse in nature as compared to other 8 zones of Lahore. The area of walled city is most densely populated, where people have substandard living conditions. In addition, Shahdra and adjoining areas that constitute the periphery of Lahore metropolitan area in north also falls under this zone. The squatter settlements are predominantly found in Ravi zone.
Material and methods
Data Collection and Instrument
The present study is based on both primary and secondary data collection and its analysis. Questionnaire was used as an instrument to collect primary data comprising both closed and open ended questions related to the factors associated with poverty (Questionnaire is attached in annexures). Secondary data was also collected from Administrative Office of Ravi Zone regarding the recent statistics about total households and population. Recent GIS based Shapefiles of Ravi Zone were collected from Urban Unit P&D Punjab Pakistan. Sample Size and Sampling Technique We selected a unique household as a unit of analysis and 510 sample households were selected from Ravi Zone. Two step selection procedure was used for sample collection. In the first step 510 sample households were equally distributed among all UCs. In the second step, sample households from all UCs were selected through convenience sampling. As in this study the prime focus was only on poor households. Therefore, sample household were selected through convenience sampling by keeping the assumption in mind that poor household condition is directly associated with poverty in order to make samples truly representative of research area. 2.3. Data Analysis In this study, data analysis were performed in Microsoft Excel with the help of analytical tool i.e. Alkire and Foster (2007; 2011) approach to evaluate multidimensional poverty. The data analysis was performed in two main sections. The first section analyzed data by estimating multidimensional poverty through three poverty indices: headcount ratio (H), intensity of poverty (A) and MPI. In second section, data was analyzed by identifying the percentage contribution of each indicator to overall poverty in order to find the most prevalent factor that contribute in poverty. The detail of these sections are as under: Evaluation of Multidimensional Poverty The study adopted following steps for multidimensional poverty measurement as suggested by Alkire & Foster (2007; 2011). a) Selection of dimensions and indicators b) Define poverty cut off points for each indicator c) Assigning weights to each dimension and indicators d) Define second poverty cut off point (to identify poor) e) Calculation of deprivation score for each household f) Calculation of Incidence of Poverty (H) g) Calculation of Intensity of Poverty (A) h) Calculation of Multidimensional Poverty Index (MPI) Selection of Indicators and Dimensions
Alkire and Foster (2007; 2011) measured multidimensional poverty through 3 dimensions: education, health and living standard with 10 different relative indicators. As Alkire and Foster method is flexible in the selection of dimensions and indicators so the present study assessed multidimensional poverty by using 5 dimensions including education, health, housing condition, housing services quality and employment which are further sub divided into 16 different relative indicators. In this study the selection of dimensions and indicators were
primarily based on existing literature of poverty assessment studies. Moreover, the selected dimensions and indicators in this study also corresponds to SDGs which may further help policy makers to monitor the existing situation in achieving these goals by 2030. Table 1 shows the selected dimensions along with their relative indicators.
Poverty Cut off Point for each Indicator
Poverty cut off point also known as poverty line which is defined as a benchmark upon which a household is declared as deprived in the respective indicator. A household is considered as deprived in particular indicator and denoted by 1 only if the household member’s achievement in that indicator falls under the given poverty cut off point otherwise considered as non-deprived and denoted by 0 (Alkire, 2007, 2011).
Table 1. Dimensions and Indicators along with their cut off points and their relation with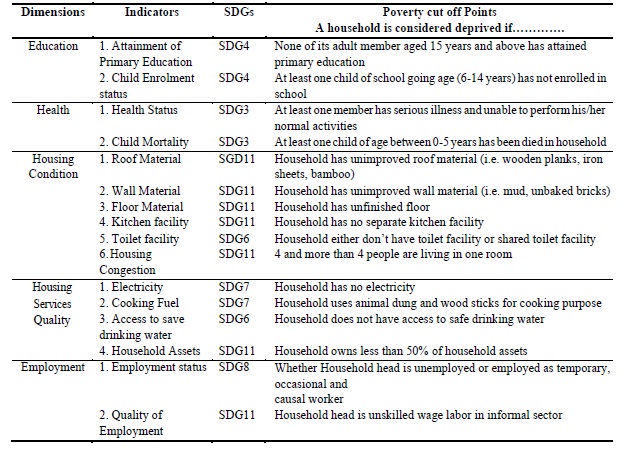
Assigning Weights to Dimension and Indicator
The equal weights were assigned to all dimensions and their relevant indicators. Different weights can also be assigned to dimensions and indicators based on their relative importance but it is very difficult and involves valuable judgement by experts. So the present study assign equal weights to all dimensions and their respective indicators with the help of equal weighting principle as suggested by Alkire and Foster (2007; 2011).
Table 2. Weights Assigned to Each Dimension and Indicator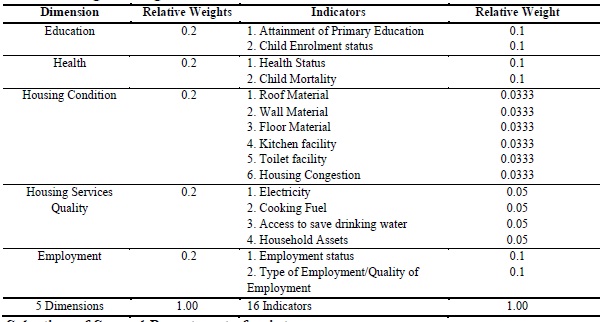
Selection of Second Poverty cut of point
Second poverty cut off point (k) is used to identify the MPI-poor households. Three different approaches are introduced for the identification of poor or deprived households: union, intermediate and intersection approach (Alkire & Foster, 2007, 2011). In union approach household is declared as poor if the household is deprived in any one out of all dimension whereas in intersection approach household is considered as poor if he/she is deprived in all selected dimensions. Identification of poor by using these two extreme
approaches can provide misleading statistics. Therefore, intermediate approach has been widely used in literature for the identification of poor. As the present study have total five dimensions therefore, k can be set as: 1/5, 2/5, 3/5, 4/5 and 5/5.
Calculation of Deprivation Score
Deprivation score (ci) of each household is calculated to identify MPI-poor household. Household is considered as MPI-poor if the deprivation score of each household is greater than or equal to the selected poverty cut off point.

Calculation of Intensity of Poverty (A)
Intensity of poverty also known as average deprivation which estimates the average proportion of deprivations among MPI-poor households in weighted sum of indicators. It is calculated through following formula: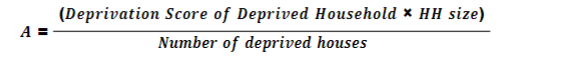
Calculation of Multidimensional Poverty Index
Multidimensional Poverty Index (MPI) also known as Adjusted Headcount Ratio (M0),
which reflects the breadth of poverty i.e. percentage of MPI-poor along with proportion of
average deprivations which they experience. It is calculated by:
Percentage Contribution of each indicator
In order to find out the most prevalent indicator that contribute in overall poverty,
contribution of each indicator was also calculated by following formula: CHR reflects indicator-wise deprivations of only those households who are categorized as
MPI-poor according at selected poverty line.
Results and Discussions.
Multidimensional Poverty Estimates for Ravi Zone
Multidimensional poverty estimates for Ravi Zone are presented at different poverty cut off points (k). The results empirically justifies that as the value of k increases, Headcount ratio (H) and MPI decreases whereas Intensity increases (A). The results indicate that if we set poverty cut off point (k) by using two extreme approaches i.e. union approach where k = 1/5 and intersection approach where k = 5/5 then these poverty lines will present very high and very low statistics respectively as shown in Table 3. Therefore, in our study we
used intermediate approach by taking k = 2/5 as poverty cut off point which was suitable enough for poverty assessment in our case. At our selected poverty cut off point i.e. k = 2/5, 70.8% households are categorized as multidimensional poor with the average proportion of weighted deprivation is 58.0% and MPI being 0.401. The results further depict a positive condition by indicating that very few or no households seems to be deprived at 4/5 and 5/5 poverty cut off point.
Table 3. Multidimensional Poverty Estimates of Ravi Zone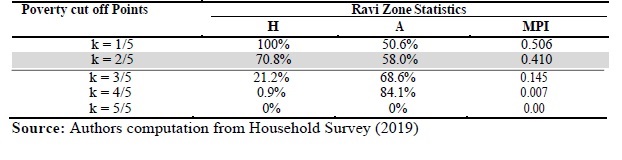
Estimates of Poverty at Administrative Zone level
Multidimensional poverty estimates when segregated at administrative zone level then the results shows that at k = 2/5, Shahdra Zone records the highest incidence of poverty where 80% of the people are MPI-poor and remaining 20% are categorized as non-poor while in Badami Bagh 65% and in Walled City Zone 35% households are categorized as MPI-poor. MPI-poor of Shahdra zone faced the highest level of deprivations i.e. on average they are deprived in 56% of weighted indicators. In Badami Bagh and Walled City Zone the MPI-poor experience was relatively low. Likewise in case of MPI, Shahdra Zone reflects the highest
breadth of poverty i.e. 0.45 whereas Badami Bagh and Walled city zone has relatively low breath of poverty with very slight difference in statistics i.e. 0.35 and 0.32 respectively. The analysis revealed that Shahdra Zone ranked 1st in all three poverty indices as compared to other zones. Although other two zones have relatively low poverty estimates but a very slight difference is found in the statistics among these two zones.
Table 4. Multidimensional Poverty estimates at Administrative Zone Level
A) Contributors to Poverty at Administrative Zone Level
MPI was decomposed to identify the contribution of each indicator and dimension to overall
poverty.
a) Contribution of each indicators to Poverty
The results indicate that in all three zones; Shahdra, Badami Bagh and Walled City, attainment of primary education contributed most to poverty among all indicators with a very slight difference in statistics i.e. 17.4%, 16.9% and 17.7% respectively. Quality of employment made the second whereas child labor status made the third highest contribution to poverty among all zones. The results are shown in Figure 2,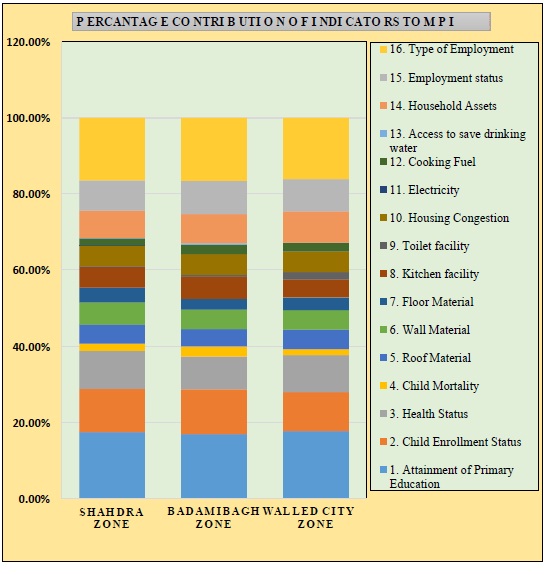
Figure 2. Contribution of each indicators to Poverty
b) Contribution of each Dimension to Poverty
The results indicate that education dimension contributed most to overall poverty among all administrative zones with a very slight difference in statistics. Employment made the second highest contribution to poverty in Badami Bagh zone of about 25.3% whereas in Shahdra and Walled City zone housing, the condition made second highest contribution i.e., 25.7% and 25.8% respectively. Employment made third highest contribution in Shahdra and walled city zones whereas in Badami Bagh Zone, housing condition made third highest contribution to poverty. Housing Services Quality had least contribution in poverty among all three zones.
The results are shown in Figure 3,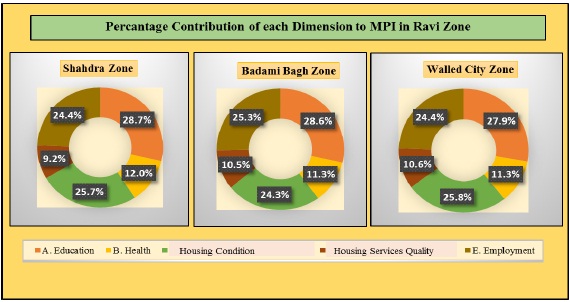
Figure 3. Contribution of each Dimension to Poverty
B) Estimates of Poverty at UC level
Estimates of multidimensional poverty at UC level were computed with the help of choropleth thematic map to illuminate inequalities across UCs. The results demonstrates that UC-wise poverty incidence is ranging from 30-95%. Accordingly, UCs are classified into five main categories: very low poverty (30-38%), low poverty (39-59%), moderate poverty (60- 68%), high poverty (69-80%) and very high poverty (81-95%). The results demonstrates that Shams Abad, Chah Chambay Wala, Javaid Park, Majeed Park, Aziz Colony, Ladhey Shah, Ravi
Clifton Colony, Hanif Park, Bhama Jhuggian and Bhatti Gate have very high poverty incidence among all. Whereas 3 UCs Qila Lakshaman Singh, Auqaf Colony and Badar Colony experience very low poverty incidence.
In case of intensity of poverty, UCs were again classified into five categories: very low poverty intensity (47-49%), low poverty intensity (50-52%), moderate poverty intensity (53- 55%), high poverty intensity (56-58%) and very high poverty intensity (59-63%). High poverty intensity was found in 8 UCs: Javaid Park, Qazi Park, Begum Kot, Bhama Jhuggian, Hanif Park, Siddique Pura, Bhatti Gate and Shahi Qila where MPI poor on average deprived about 59-63% in weighted sum of indicators. In UCs like Siddiqia Colony, Badar Colony, Qila
Lakshaman Singh, Data Nagar and Azam Market MPI-poor have very low intensity of poverty.
MPI values at UC level vary from 0.15-0.55 on the basis of this range UCs were categorized into very low MPI values (0.15-0.24), low MPI values (0.25-0.32), moderate MPI values (0.33- 0.41) high MPI values (0.42-0.47) and very high MPI values (0.48-0.55). Javaid Park, Majeed Park, Chah Chambay Wala, Bhama Jhuggian, Hanif Park and Bhatti Gate have very high MPIvalues.
On the other hand MPI values found to be very low in Badar Colony, Auqaf Colony, Qila Lakshaman Singh, Azam Market and Shah Alam Market indicating that all UCs with low MPI values lie under the Walled city and Badami Bagh Zones. The analysis revealed that 1 UC Javaid Park from Shahdra Zone, 2 UCs Hanif Park and Bhama Jhuggian from Badami Bagh Zone and only 1 UC Bhatti Gate from Walled City Zone records very high poverty indices and were categorized as highly deprived UCs. The results are shown in Figure 4.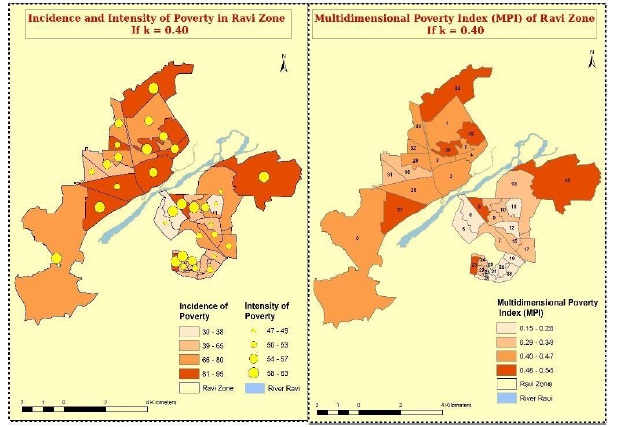
Figure 4. Multidimensional Poverty Indices at UC Level in Ravi Zone
Main Contributors to Poverty at UC level
a) Contribution of each indicators to Poverty
The results revealed variability between two indicators: attainment of primary education and quality of employment. Attainment of primary education make the highest contribution to poverty among 19 UCs whereas in 6 UCs quality of employment contributed highest. In remaining 9 UCs, both indicators contributed equally in poverty. While child enrollment status contributed as second highest to poverty among 18 UCs. On the other hand, two indicators: electricity facility and access to save drinking makes the lowest contribution among UCs. Table5 presents percentage contribution of each indicator to poverty at UC level.
Table 5.Percentage Contribution of each Indicator to Poverty at UC Level
Note: Yellow color in table highlight the indicator which makes highest contribution in poverty. Blue color highlights second highest Contribution.
Gery color highlights third highest contributor and Green color highlights equal contribution of indicators.
1 Attainment of Primary Education
2 Child Enrollment Status
3 Health Status
4 Child Mortality
5 Wall Material
6 Roof Material
7 Floor Material
8 Kitchen Facility
9 Toilet Facility
10 Housing Congestion
11 Electricity Facility
12 Cooking Fuel
13 Assess to save drinking water
14 Household Assets
15 Employment Status
16 Quality of Employment
Source: Authors Computation from Household Survey (2019).
b) Contribution of each Dimension to Poverty
The results demonstrate the variability among dimensions across UCs regarding highest contribution. In 24 UCs, education contributed highest whereas housing condition make highest contribution in 6 UCs although in 4 UCs employment dimension highly contributed to overall poverty. Table 6 shows the dimension-wise contribution to poverty among all UCs.
Table 6. Percentage Contribution of each Dimension to Overall Poverty
Note: Yellow color highlight the dimension which makes highest contribution in poverty. Blue color highlights second highest, Green color highlights third highest contributor and purple color highlights forth highest contribution.
Source: Authors Computation from Household Survey (2019).
Conclusion
It was revealed that poverty cut off points (k) affect poverty estimates. As the value of k increases, two multidimensional poverty indices: H and MPI continues to decrease whereas A increases. The study concluded that in Ravi Zone, 70.8% of households are considered as MPI-poor whereas 29.8% households are living out of poverty with positive potentials. The results revealed that in Ravi Zone, Shahdra administrative zone found to be highly deprived as compared to other two zones. In case of UCs, 4 UCs: Javaid Park, Hanif Park, Bhama
Jhuggian and Bhatti Gate are categorized as highly deprived in Ravi zone. The study further revealed that in Ravi zone, attainment of primary education followed by quality of employment and child enrollment status played a vital role in driving poverty. The results showing an alarming situation because these three indicators have a significant correlation with each other i.e., attainment of primary education determine quality of
employment which in turn effects child enrollment status because people with low education which is unable to get better jobs which meet their needs so they engage their children in child labor despite of educating them. It is recommended that government and policy makers should concentrate in creating quality job opportunities for the unskilled and uneducated people.
Future Avenues
❖ This study can be further enhanced by assessing multidimensional poverty in all zones of
Lahore at segregated administrative unit levels.
❖ Multidimensional poverty measuring tool can be further enhanced by adding more
dimensions and indicators in it.
❖ The study can further assign unequal weights to different indicators and dimensions
according to their relative importance.
Acknowledgements
The corresponding author would like to thanks Dr. Ali Iqtadar Mirza (Department of
Geography, Government College University Lahore) and Dr. Shaker Mehmood, (Department
of Urban and Regional Planning, University of Engineering and Technology Lahore) for their
intellectual guidance and support. The corresponding author is also indebted to Administrative
Office of Ravi Zone and Urban Unit Department for data sharing.
Author’s Contribution. All the authors contributed equally.
Conflict of interest. We declare no conflict of interest for publishing this manuscript in IJIST.
Project details. NIL
REFERENCES
[1] World Bank. (2000). World development report 2000-2001: attacking poverty. World Bank
Group.
[2] Haughton, J., & Khandker, S. R. (2009). Handbook on Poverty and Inequality:
Washington. DC: The World Bank.
[3] Bhuiya, A., Mahmood, S. S., Rana, A. M., Wahed, T., Ahmed, S. M., & Chowdhury,
A. M. R. (2007). A multidimensional approach to measure poverty in rural
Bangladesh. Journal of health, population, and nutrition, 25(2), 134.
[4] Khan, A. U., Saboor, A., Ali, I., Malik, W. S., & Mahmood, K. (2016). Urbanization of
multidimensional poverty: empirical evidences from Pakistan. Quality & quantity, 50(1),
439-469.
[5] UN-HABITAT (2016). World Cities Report 2016: Urbanization and Development-Emerging
Futures, UN, New York, Retrieved from: http://doi.org/10.18356/d201a997-en.
[6] Elhadary, Y. A. E., & Samat, N. (2012). Political economy and urban poverty in the
developing countries: Lessons learned from Sudan and Malaysia. Journal of geography and
Geology, 4(1), 212.
[7] Arimah, B. C. (2010). The face of urban poverty: Explaining the prevalence of slums in developing
countries (No. 2010/30). WIDER working paper.
[8] Mercado, S., Havemann, K., Sami, M., & Ueda, H. (2007). Urban poverty: an urgent
public health issue. Journal of Urban Health, 84(1), 7.
[9] Seals, A., & Nunley, J. (2007). The effects of inflation and demographic change on
property crime: A structural time series approach. Department of Economics and Finance
Working Paper Series. Middle Tennessee State University, Murfreesboro, TN.
[10] Gillani, S. Y. M., Rehman, H. U., & Gill, A. R. (2009). Unemployment, poverty,
inflation and crime nexus: Cointegration and causality analysis of Pakistan. Pakistan
Economic and Social Review, 79-98.
[11] Hassan, M. S., Akbar, M. S., Wajid, A., & Arshed, N. (2016). Poverty, urbanization and
crime: Are they related in Pakistan. International Journal of Economics and Empirical
Research, 4(9), 483-492.
[12] Vijaya, R. M., Lahoti, R., & Swaminathan, H. (2014). Moving from the household to
the individual: Multidimensional poverty analysis. World Development, 59, 70-81.
[13] Dehury, B., & Mohanty, S. K. (2015). Regional estimates of multidimensional poverty
in India. Economics: The Open-Access, Open-Assessment E-Journal, 9(2015-36), 1-35.
[14] Mahoozi, H. (2015). Gender and spatial disparity of multidimensional poverty in Iran.
[15] Gebreslassie, G. H. (2015). Multidimensional measurements of poverty analysis in
urban areas of Afar Regional State. International Journal of Science and Research, 4(7), 2627-
2635.
[16] Gebreslassie, G. H. Comparison of Multidimensional Measurements of Poverty
Analysis: Cross Sectional Data Evidence from Tigray.
[17] Dotter, C., & Klasen, S. (2017). The Multidimensional Poverty Index: achievements, conceptual
and empirical issues (No. 233). Courant Research Centre: Poverty, Equity and Growth-
Discussion Papers.
[18] Kumi-Boateng, B., Mireku-Gyimah, D., & Stemn, E. (2015). Where are the Poor?
Mapping Out A GIS-Multidimensional Non-Monetary Poverty Index Approach for
Ghana. Ghana Mining Journal, 15(2), 11-20.
[19] Santos, M. E., & Villatoro, P. (2018). A multidimensional poverty index for Latin
America. Review of Income and Wealth, 64(1), 52-82.
[20] Ab-Rahim, R., & Mohammed, M. (2019). Multidimensional Poverty Index of Niger
State, Nigeria. International Journal of Academic Research in Business and Social
Sciences, 9(7).
[21] Poverty, O., & Human Development Initiative. (2019). Global multidimensional
poverty index 2019: illuminating inequalities.
[22] Oxford Poverty and Human Development Initiative (2017). “Pakistan Country Briefing”,
Multidimensional Poverty Index Data Bank. OPHI, University of Oxford.
Retrievedfrom:https://www.undp.org/content/dam/pakistan/docs/MPI/Multidim
ensional%20Poverty%20in%20Pakistan.
[23] Idrees, M. (2017). Poverty in Pakistan: A Region-Specific Analysis. The Lahore Journal
of Economics, 22(2), 139-163.
[24] Khan, F. N., & Akram, S. (2018). Sensitivity of multidimensional poverty index in
Pakistan. The Pakistan Journal of Social Issues, 9, 98-108.
[25] Afzal, M., Rafique, S., & Hameed, F. (2015). Measurement of living standards
deprivation in Punjab using AF method (periodical comparison approach). The
Pakistan Development Review, 739-762.
[26] Khan, A. U., Saboor, A., Hussain, A., Sadiq, S., & Mohsin, A. Q. (2014). Poverty
assessment as a multidimensional socio-economic concept: the case of the Rawalpindi
region in Pakistan. Asia Pacific Journal of Social Work and Development, 24(4), 238-250.
[27] Chaudhry, I. S., Malik, S., & Imran, A. (2006). Urban poverty and governance: the case
of Multan city. The Pakistan Development Review, 819-830.
[28] Awan, M. S., & Iqbal, N. (2010). Determinants of Urban Poverty: The Case of Medium
Sized City in Pakistan. Working Papers & Research Reports, 2010.
[29] Zahra, K., & Zafar, T. (2015). Marginality and multidimensional poverty: A case study
of Christian community of Lahore, Pakistan. Pakistan Journal of Commerce and Social
Sciences (PJCSS), 9(2), 322-335.


