
Estimation of relation between moisture content of soil and reflectivity index using GPS signals
Muhammad Farhan Saleem1, Hania Arif 2, Hafiz Haroon Ahmad 3
1 College of Earth and Environmental Sciences, University of the Punjab
2 Center for Integrated Mountain Research, University of the Punjab
3 Department of Space Science University of the Punjab `
* Correspondence: Muhammad Farhan Saleem, farhansaleem477@gmail.com
Citation | Farhan. S. M, Arif. H, Ahmad. H. H, “Estimation of relation between moisture content of soil and reflectivity index using GPS signals”. International Journal of Innovations in Science & Technology, Vol 03 Issue 04: pp 218-230, 2021.
Received | Dec 01, 2021; Revised | Dec 26, 2021 Accepted | Dec 27, 2021; Published |Dec 31, 2021.
________________________________________________________________________
The irrigation system throughout the world is affected by the variations in water content due to different soil structure, textures and climate change. The irrigation system supplies sufficient water to the agricultural fields in order to fulfill the prerequisites. The measurement of soil moisture content (62%) is crucial for precision irrigation and sustainable agricultural system. Site specific agricultural system was utilized to overcome all issues related to soil water moisture contents in the paddock. Smart technology was utilized to record GPS signals utilizing the signals reflected on the Earth’s surface. The GPS was utilized to analyze dielectric soil properties and moisture content in proposed areas. The main objective of this study was to determine water content with stimulus soil type, ground cover and compaction on the irrigation system by utilizing the GPS-based techniques. The result indicated positive relation between soil moisture content and the signals reflected on the earth surface. All factors affecting the irrigation system were not related to the reflected signals and did not affect the soil moisture content. The reflectivity was not reduced by ground cover. Whereas, comparative relationship was found between soil moisture content and reflectivity index i.e. soil moisture contents were increased with reflectivity index up to 0.02 %. The results showed that GPS signals system have significant impact on estimation of soil moisture content in precise irrigation system.
Keywords
Remote Sensing, Soil Moisture, Reflectivity index, GPS, Site-Specific Irrigation
- Introduction
Agricultural management requires up to need water supplies which is now being analyzed using a new concept which is Site-specific or Variable-Rate Irrigation (VRI). This technology is significantly used to reduce water utilization, nutrient leaching and runoff [1]. Soil retains a definable amount of water which is commonly known as moisture content of soil. A successful site specific irrigation system is obtained through continuous measurement of moisture content of soil [2]. Behavior of soil is significantly affected by the moisture content, therefore it is essential to accurately monitor the moisture content of soil.
Water content of soil significantly affects the nutrients and content of moisture and influence the aeration of soil. Moisture content of soil keep changing the availability of water through irrigation or rainfall. Availability of moisture in soil is highly significant for effective growth and efficient functioning of plants. Lack of adequate water content in soil lowers the crop yield which can lead to root proliferation, reduce growth and stomatal conductance, impair pigments and reduce protein content in plant [3].
In this modern era, the moisture content of soil can be measured through smart technologies. Volumetric and percentage water content of soil can be analyzed using modern techniques. It can be measured using different kind of sensors including TDR, multi-sensor capacitance probes and tensiometers [4]. A significant number of sensors are required to provide sufficient data regarding spatial variability of irrigated fields since the sensors in a production field measure the moisture content of soil at distinct locations [5,6]. Thus utilizing sensors for determining moisture content for site specific irrigation system can be impractical and expensive [7,8]. Therefore, advanced remote sensing techniques are required for these kinds of measurements [9, 10].
The varying dielectric properties of soil are sensitive to frequency ranging from 1 – 2 GHz and this frequency can effectively penetrate through the vegetation [11, 12]. The dielectric properties of soil are closely related to the moisture content of surface of soil. Civilian-use carrier signal i.e, L-band at a frequency of 1.575 GHz is utilized for measuring moisture content through remote sensing technology [13].
GPS is satellite based global positioning system which is based on the continuous transmission of information in coded form. Initially the GPS system was only for military use but later on it was intended for civilians because of its wide range of applications [14]. The main objective of this study was to determine water content and influence soil type, ground cover and compaction on the irrigation system utilizing the GPS-based techniques. The GPS effectively analyzes the dielectric properties of soil. In addition to the general functions of positioning and navigation, the GPS can also be utilized for various other functions including remote sensing, sensing of atmosphere and monitoring of earthquake and surface deformation [16].
The signals are reflected and directed by the object, which are received by GPS receiver antenna. GPS receiver antenna is highly sensitive to the moisture content. This system works by recording the signal to noise ratio (SNR) [16]. The signals are varied as the moisture content of soil near receiver antenna changes. Thousands of geodetic quality GPS receivers are being utilized throughout the world. Geodetic quality receivers are highly efficient and cost effective method accurately determines various geophysical parameters including moisture content of soil [16].
The geodetic quality GPS antenna collects both reflected and direct signals, which are further processed by the receiver. This study aims at utilizing GPS signal strength for the estimation of moisture content of soil through determining Signal to Noise ratio (SNR).Multiple regression models are utilized in this paper for determining the relationship between reflectivity index and moisture content of soil.
Study Area
This study was conducted in Sheikhupura which is a district of province Punjab. By population it is the 16th largest city of Pakistan located at 38 km at northern side of Lahore. This district covers nearly 75 km² of area. The district resides nearly 230km above the sea level. The climate of this district ranges from maximum ranges of 45 oC in winters to minimum 1 oC in winters. The annual rainfall in this region ranges up to 500mm. the slope doesn’t affect the distribution of water as the study site is a plain area. The study area is mapped in figure 1.
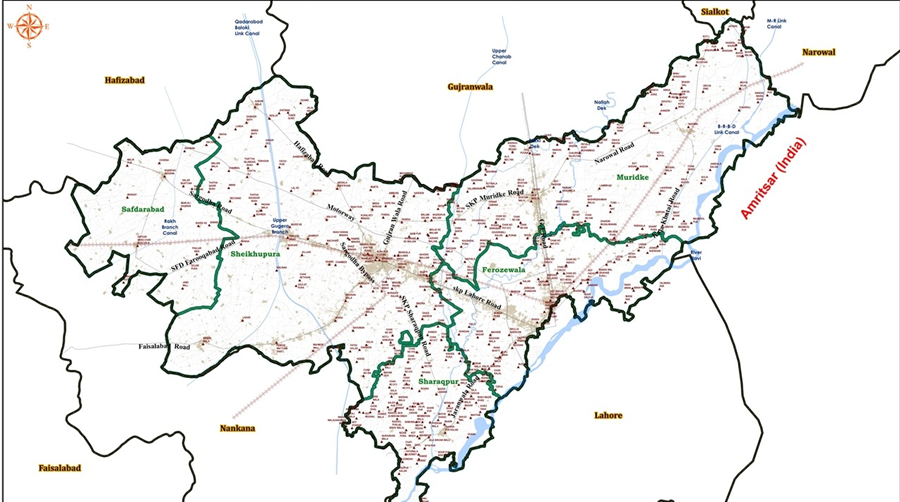
Figure 1: Site map of study area.
Methodology
Three different types of soils were selected to conduct tests repeatedly these soil types include Fuquay sandy loam, Lakeland sand and Faceville loamy sand. The study area was a 2.5 ha field located in sheikhupura [17]. Commercially available Electrical conductivity (EC) was used to obtain electrical conductivity of soil which in turn was used to determine the varying dielectric properties of soil. The electrical conductivity of 0.3 to 0.9 m of top soil was measured by using veris-3100 which is similar to small disk harrow which has a width of 2m [18]. Nearly 20 measurements were taken for a 15 m long plot at the rate of 1 Hz. SS tool box was used to develop a thematic map of electrical conductivity [19].
The faceville soil consists of higher EC and clay content were compared with the Lakeland soil. The average values of electrical conductivity were observed of Fuquay, Faceville and Lakeland are 9.2, 12.9 and 4 respectively. Depending upon the electrical conductivity of soil, the test field was divided into three zones and 21 plots. All plots were supplied nearly 2.5 cm of water and the reflected signals of GPS were collected for all plots. The average value of moisture content was recorded within three days is 8.0%, 6.8%, and 2.9%, respectively. There was no rain within the experimental days [20]. Different soil compactions are created using tractor over plots. The compactions were created within a day and followed by 2.5 cm irrigation. GPS based hydraulic penetrometer was used to collect solid data. The resistance to penetration was quantified using geo referenced data. The values of soil compaction values were obtained by measuring force and average value of CI was 3.2 MPa.
A DMR from 9-m tower was used to take measurements of ground reflectance from the center of rectangles. The equation 1 given below, was used to calculate resolution. where “A” represents footprint of the reflected signal (m2), “h” shows height of receiver above the surface (m), “λ” shows the incoming signal wavelength equal to 19.03 cm, and γ is the elevation angle of satellite signal.

By changing the angle and height of antennas, the resolution of DMR also changes. The receiver of the software accepts high elevation to make a specific area of reflection just below receiver. The angle of elevation changes from 60 to 90 degree at the height of 9 m. The reliever of GPS located in each plot in such a way that reflected signals cross the middle portion of plots. The predicted paths were mapped corresponding to the plots. Figure 2 illustrates the top and bottom sides of DMR which are measured using RF power divider.
Measurements of moisture content for soil were taken from each plot using a soil probe of almost 5 cm. The direct and reflected signals were collected over time using a DMR receiver on exact locations in each plot. Each core of soil was divided into 5cm thick layers and the content of moisture is determined. The soil sample was taken from each layer and the sample is then labeled, weighed and dried at 105˚C for 24-hours through standard procedure.
The satellite tracking antenna was used to determine the reflectivity by developing a ratio of reflected power and power determined. The data of reflectivity was utilized to obtain soil moisture data by developing simple linear regression model. The slope parameter and coefficient of determination (R2) of simple linear regression model was determined using analysis of variance F-Tests. Along the determination of soil moisture the linear regression model also calculated for soil type, soil compaction and crop biomass.

Figure 2. RF power divider was used to measure SNR of top and bottom channels of DMR
Significance of parameters are determined using ANOVA F-Tests. The JMP 10.0.0 and tests were utilized to calculate a significance level of 0.05.
Results and discussion
The reflected index of top 25cm layer of soil was determined 0.788. Moisture content of soil changed from 1 to 12% during the measurement of reflectivity. The linear model of reflectivity index is:
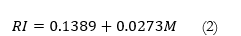
In the above stated relationship, M indicates the moisture content. The increase in reflectivity per moisture content was estimated to be 0.0269. This result showed that the linear regression model can estimate moisture content of soil from reflectivity.
Figure 3 showed the relationship between the reflectivity index and soil moisture contents separated by treatments (COM, CROP, NC). The slopes of regression lines were determined using multiple regression model.

Figure 3. Effects of soil moisture contents on reflectivity index.
Regression line slopes were 0.03, 0.02, and 0.02 for NC, COM, and CROP, respectively. Figure 3 shows the relationship between the reflectivity index and soil moisture contents separated by the three treatments, soil types (Lakeland, Fuquay, and Faceville). Positive relationship between moisture content and reflectivity index was shown by each treatment.

Figure 4. Relationship of reflectivity index and soil moisture contents separated by-treatments: compacted (COM), no compaction (NC), and ground cover (CROP).
Table 1. ANOVA results of reflectivity index versus moisture and treatment.
|
Source |
DF |
Sum of Squares |
Mean Square |
F Ratio |
|
|||
|
Moisture |
1 |
0.37613275 |
0.3713275 |
131.0980 |
|
|||
|
Treatment (COM, NC, CROP) |
2 |
0.04995747 |
0.0249787 |
8.7061 |
|
|||
|
Treatment by Moisture |
2 |
0.00615571 |
0.0030779 |
1.0728 |
|
|||
|
|
||||||||
|
Total |
76 |
0.68676087 |
||||||
Table 2. ANOVA table of reflectivity index versus moisture and soil type.
|
Source |
DF |
Sum of Squares |
Mean Square |
F Ratio |
|
||
|
Moisture |
1 |
0.30355215 |
0.30355215 |
82.8923 |
|
||
|
Soil Type |
2 |
0.01271813 |
0.006359 |
1.7365 |
|
||
|
Soil Type by Moisture |
2 |
0.00429694 |
0.0021484 |
0.5867 |
|
||
|
|
|||||||
|
Total |
78 |
0.77412139 |
|||||
Table 3. ANOVA table of reflectivity index versus moisture and actual compaction measure.
|
Source |
DF |
Sum of Squares |
Mean Square |
F Ratio |
|
||
|
Moisture |
1 |
0.40542071 |
0.40542071 |
131.4979 |
|
||
|
Compaction |
1 |
0.00093599 |
0.00093599 |
0.3036 |
|
||
|
Compaction by Moisture |
1 |
0.00865725 |
0.00865725 |
2.8080 |
|
||
|
|
|||||||
|
Total |
52 |
0.58067948 |
|||||
Table 4. ANOVA table of reflectivity index versus moisture and actual crop biomass measure.
|
Source |
DF |
Sum of Squares |
Mean Square |
F Ratio |
|
||
|
Moisture |
1 |
0.56627584 |
0.56627584 |
157.4121 |
|
||
|
Biomass |
1 |
0.00571571 |
0.00571571 |
1.5888 |
|
||
|
Biomass by Moisture |
1 |
0.00058714 |
0.00058714 |
0.1632 |
|
||
|
|
|||||||
|
Total |
78 |
0.84252875 |
|||||
The relationship of moisture and reflectivity were found consistent according to the results, two multiple regression models were developed to analyze the relationship. One of these models illustrate the soil compaction and moisture while the other model shows the measure of crop biomass. Table 3 and Table 4 presented the ANOVA F-test results for these models. The regression lines were not different for different biomass and compaction measure.
The analyses showed that changing the depth of sample the sensitivity of L-Band towards the soil moisture content is also changed. The figure 5 shows relation of R2 and sampling depth.
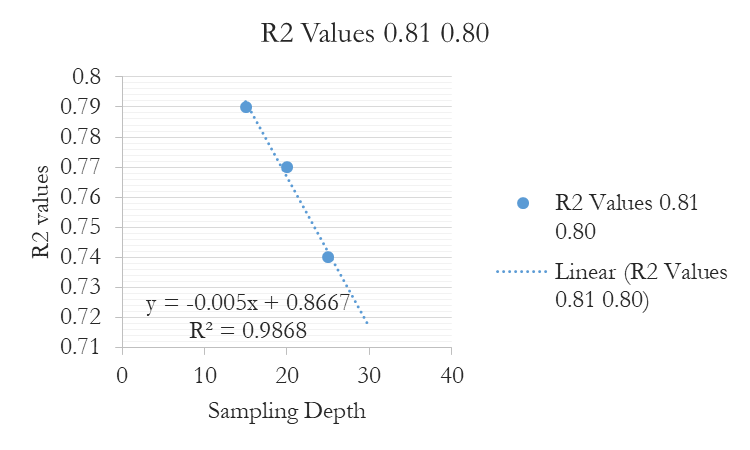
Figure 5. Relationship of R2 and sampling depth.
The R2 value is for the coefficient of determination of the reflectivity index and moisture linear relationship at a particular depth. The strongest relation of moisture content and reflectivity index was observed in first 5 cm of soil sample. The value of R2 decreases as the depth of soil increases. This decrease in value is due to less penetration of GPS signals into the soil.
A positive relation between moisture content of soil and signals reflected by soil on the earth surface is observed. The GPS signals neither affect the moisture content of soil nor changes the irrigation system. While the reflectivity index is affected by the depth of soil. The ground cover did not reduce the reflectivity. While, a comparative relationship was found between soil moisture content and reflectivity index i.e. soil moisture contents were increased with reflectivity index up to 0.02 %.
Conclusion
A comparative relationship was found between moisture content and reflectivity index, when the soil moisture is increased the reflectivity index is also increased up to 0.02 %. The results showed that technology plays a significant role in estimating moisture content of soil in the management of site specific irrigation.
Conflicts of Interest
The authors declare no conflicts of interest.
References
|
[1] |
Bruce, R.R. and Römkens, M.J.M. Fruiting and Growth Characteristics of Cotton in Relation to Soil Moisture Tension. Agronomy Journal, Vol 57, pp: 135-140, 1965. |
|
[2] |
Mathur, D., Khalilian, A., Owino, T. and Sullivan, M. Scheduling of Subsurface Drip Irrigation of Cotton Using Time Domain Transmissometry (TDT). ASAE Technical Paper No. 02-2111, ASAE, St. Joseph, MI, 2002. |
|
[3] |
Paltineanu, I. and Starr, J. Real-Time Water Dynamics Using Multisensor Capacitance Probes: Laboratory Calibration. Soil Science Society of America Journal, Vol 61, pp; 1576-1585, 1997. |
|
[4] |
Sloane, D.H.G. AquaSpy-A Revolutionary New Soil Moisture Sensor. In: Proceedings of the Beltwide Cotton Conferences, National Cotton Council of America Memphis, Memphis, TN, pp: 1751-1753, 2007. |
|
[5] |
Bellamy, C., Khalilian, A., Farahani, H., Privette, C. and Henderson, W. Sensor Based Soil Water & Crop Monitoring in Cotton Production. Proceedings of the Beltwide Cotton Conferences, National Cotton Council of America, Memphis, TN, pp; 383-387, 2009. |
|
[6] |
Walker, J. Estimating Soil Moisture Profile Dynamics from Near-Surface Soil Moisture Measurements and Standard Meteorological Data. Ph.D. Dissertation, The University of Newcastle, Newcastle, Australia, 1999. |
|
[7] |
Jackson, T.J., Schmugge, T.J. and Wang, J.R. Passive Microwave Sensing of Soil Moisture under Vegetation Canopies. Water Resources Research, Vol 18, pp; 1137-1142, 1982. |
|
[8] |
Jackson, T. and Schmugge, T. Surface Soil Moisture Measurement with Microwave Radiometry. 43rd Congress of the International Astronautical Federation, IAF pp: 92-0122, 749-751, 1992. |
|
[9] |
Wigneron, J.-P., Calvet, J.-C., Pellarin, T., Van de Griend, A.A., Berger, M. and Ferrazzoli, P. Retrieving Near-Surface Soil Moisture from Microwave Radiometric Observations: Current Status and Future Plans. Remote Sensing of Environment, Vol 85, pp: 489-506, 2003. |
|
[10] |
Larson, K.M., Small, E.E., Gutmann, E., Bilich, A., Braun, J. and Zavorotny, V. Use of GPS Receivers as a Soil Moisture Network for Water Cycle Studies. Geophysical Research Letters, Vol 35, L24405, 2008. |
|
[11] |
Larson, K.M., Braun, J.J., Small, E.E., Zavorotny, V.U., Gutmann, E. and Bilich, A.L. (2010) GPS Multipath and Its Relation to Near-Surface Soil Moisture Content. IEEE Journal of Selected Topics in Applied Earth Observations and Remote Sensing, 3, 91-99. |
|
[12] |
Njoku, E.G. and Entekhabi, D. Passive Microwave Remote Sensing of Soil Moisture. Journal of Hydrology, Vol 184, pp: 101-129, 1996. |
|
[13] |
Katzberg, S., Torres, O., Grant, M. and Masters, D. Utilizing Calibrated GPS Reflected Signals to Estimate Soil Reflectivity and Dielectric Constant: Results from SMEX02. Remote Sensing of Environment, vol 100, pp: 17-28, 2006. |
|
[14] |
Masters, D., Axelrad, P. and Katzberg, S. Initial Results of Land-Reflected GPS Bistatic Radar Measurements in SMEX02. Remote Sensing of Environment, Vol 92, pp: 507-520, 2004. |
|
[15] |
Grant, M., Katzberg, S. and Lawrence, R. GPS Remote Sensing Measurements Using Aerosonde UAV, NTRS: 2006-08-03 Document ID: 20050234606; Report Number: AIAA Paper 2005-7005, 2005. |
|
[16] |
Zavorotny, V.U., Larson, K.M., Braun, J.J., Small, E.E., Gutmann, E.D. and Bilich, A.L. A Physical Model for GPS Multipath Caused by Land Reflections: Toward Bare Soil Moisture Retrievals. IEEE Journal of Selected Topics in Applied Earth Observations and Remote Sensing, Vol 3, pp: 100-110, 2010. |
|
[17] |
Privette III, C.V., Khalilian, A., Torres, O. and Katzberg, S. (2011) Utilizing Space-Based GPS Technology to Determine Hydrological Properties of Soils. Remote Sensing of Environment, vol 115, pp: 3582-3586. |
|
[18] |
Khalilian, A., Privette III, C.V., Han, Y.J. and Katzberg, S.J. Environmental Enhancement Utilizing Space-Based GPS Technology Developed by NASA to Determine Hydrological Properties for Watershed Management. Unpublished Research Report to South Carolina Space Grant Consortium, College of Charleston, Charleston, 2010. |
|
[19] |
Lund, E.D., Christy, C.D. and Drummond, P.E. Practical Applications of Soil Electrical Conductivity Mapping. In: Stafford, J.V., Ed., Precision Agriculture ‘99—Proceedings of the 2nd European Conference on Precision Agriculture, Denmark, 11-15 July 1999, SCI, Sheffield, pp: 771-779, 1999. |
|
[20] |
ASAE Standards ASAE S313.3: Soil Cone Penetrometer and ASAE S358.2: Moisture Measurement—Forages. American Society of Agricultural & Biological Engineers, ASABE, St. Joseph, 2006. |
|
[21] |
Khalilian, A., Han, Y.J., Dodd, R.B., Sullivan, M.J., Gorucu, S. and Keskin, M. A Control System for Variable Depth Tillage. ASAE Paper No. 021209, ASABE, St. Joseph, 2002. |
|
[22] |
Bolton, M. A Guide to Soil Mechanics. Halsted Press Book, John Wiley & Sons, New York, 1979. |


