
Evaluation of Catastrophic Global Warming due to Coal Combustion, Paradigm of South Asia
Hafiz Haroon Ahmad1, Farhan Saleem2,Hania Arif3
1Department of Space Science, University of the Punjab.
2College of Earth and Environmental Sciences,University of the Punjab.
3Center for Integrated Mountain Research, University of the Punjab.
* Correspondence: Hafiz Haroon Ahmad, hahmadturabi@gmail.com
Citation | Ahmad. H. H, Saleem. F and Arif. H, “Evaluation of Catastrophic Global Warming due to Coal Combustion, Paradigm of South Asia”, International Journal of Innovations in Science and Technology. Vol 3, Issue 4, pp: 198-207, 2021
Received | Nov 18, 2021; Revised | Nov 21, 2021 Accepted | Dec 29, 2021; Published | Dec 31, 21.
Abstract
Coal is a carbon containing non-renewable fossil fuel and one of the major contributors of climate change and global warming. We used TANSO FTS instrument in order to obtain the level of atmospheric carbon dioxide through datasets obtained from GOSAT satellite. GIOVANNI was also used to obtain atmospheric concentration of various gases. Burning of coal causes emission of greenhouse gases (GHG) and black carbon (BC) in atmosphere which are responsible for nearly 0.3°C of 1°C rise in temperature. The annual average value of carbon emission for the year 2010 and 2019 is 388.4 ppm and 409 ppm respectively. Since the pre-industrial times CO2 concentrations have increased up to100 PPM (36%) in the last two and a half centuries (250 years).In South Asia Dhaka has the worst quality of air as CO2 concentration (6.7%) is higher than the country’s GDP (5.25%) and energy consumption (4.77%). While an increasing trend GHG has been observed in Lahore up to 5.5 %. This study concludes that the high concentration of carbon dioxide in atmosphere is responsible for average rise of 1.2 °C temperature annually. This temperature rise can lead to adverse climatic conditions i.e., melting of glaciers which will consequently rise the sea level various landmasses may disappear by 2050.
Keywords: Black Carbon, Carbon Dioxide, Global Warming, Coal Consumption
- Introduction
The atmosphere of earth comprises of various gases which diffuse, attract and reflect different wavelengths. These gases control various atmospheric phenomena including temperature, pressure, humidity and rainfall etc [1]. Black Carbon(BC) and Green House Gases(GHGs) including carbon dioxide, halocarbons, methane and water vapors are responsible for controlling the atmospheric temperature [2]. These gases are responsible for increasing the temperature of atmosphere by absorbing the infrared radiations. GHGs trap heat within the premises of earth’s atmosphere [3]. The status of several other components of climate system of earth is altered due to global warming causing the climatic changes. At global scale, the average concentration of carbon dioxide in atmosphere has been increased from 270-370 ppm since the revolution of industries [4]. Burning of coal in industries is major source of BC and CO2 [5]. The value of CO2 in atmosphere was too low about 55 million years ago, this concentration increased gradually due to anthropogenic activities [6]. Utilization of coal in human activities and industries has reshaped the environmental conditions [7].
Coal is a combustible fossil fuel used in industries and domestic households for various purposes [8]. It is composed of carbon, Sulphur and small quantities of vicious metals including mercury, arsenic and lead which enter into atmosphere upon combustion [9]. Coal is mostly carbon which reacts with aerial oxygen upon burning giving rise in concentration to carbon dioxide and residue entered in atmosphere as tiny BC particles. BC and CO2 trap sunlight giving rise to earth’s temperature in a process termed as global warming [10]. Coal combustion is responsible for the production of hazardous pollutants that impacts the environment in various ways which include creation of greenhouse effect leading to global warming [11]. Major industrial zones are located in Pakistan, Bangladesh and India. There are significant numbers of chemical intensive industries such as textile, leather, food, fertilizer and pharmaceutical industry in Bangladesh. Pakistan is also a developing country and progressing in several industrial fields; like, fertilizer, mining, leather, chemical, and textile and oil refineries. Pakistan is responsible for 0.9% of total coal consumption of the world. About, 70% of the coal in Pakistan is imported for consumption [12]. One third of the carbon dioxide of Pakistan is emitted through coal fired power plants which is equalant to the amount of CO2 released through transportation sources i.e., vehicles. Almost, 1.2 million Cars produce similar amount of CO2 produced by a 1000 megawatt coal fired power plant [13].
Coal mines in eastern South-Asia (India) are also a major cause of air pollution. India's coal production is about 605 million tons, making it the third largest producer globally. India consumes 8% of the total world’s coal, making it the third largest consumer of the resource as well. It is also the third largest importer of coal with a total of 160 million tons in imports, trailing behind China and Japan. Around three-quarters (68%) of electricity generation in India depends on coal. The verified coal reserves in India are estimated at 60.6 billion tons as of 2018, ranking again as number three globally[13]. Over 80% of world’s energy is obtained from burning of fossil fuels including coal, oil and gas. Among all fossil fuels coal is one of the strong contributors of CO2 emitter. Nearly 46% of CO2 is emitted in air by burning of coal. Coal has been the fastest primary energy source in previous decade from the year 2000 to 2020. Mostly the use of coal is in electrical sector. Nearly 70% of the greenhouse gases are emitted from electrical sector due to coal consumption [14].
Global warming is one of the long term environmental impact of coal combustion which is nearly irreversible. Along the increasing temperature, consequences of Global warming include rise of sea level, heat waves, and risks of drought, floods and species loss [15]. If the climatic change due to global warming remained unchecked, it may lead to severe ecological disruption. The main driver of global warming is CO2 which is released into atmosphere by the combustion of coal in industries [16].
To prevent severe catastrophic environmental conditions, the utilization of fossil fuels must be reduced [17]. The coal combustion is responsible for nearly 0.3°C annual rise in temperature above the level of pre-industrial era [18]. It plays dominant role in changing the climate as a consequence of global warming. To decline the emission of CO2 in atmosphere, industries must deploy low carbon containing energy resources and make efficient improvements in climatic conditions related to environmental sector [19].
In current scenario, different technologies are emerging globally to capture and store the CO2 inside the power plant to prevent its loss in environment. These emerging technologies transfer the excess CO2 in the geological repository. Though this technology can protect the climate however, it is quite expensive, but globally several countries are investing in this technology in order to conserve the environmental conditions of Earth [19].
Combustion of coal produces large quantity of CO2 which is greenhouse gas that traps heat and in turn causes warming of climate. CO2 accounts for nearly 72% of total greenhouse gases which are responsible for climatic changes and global warming. Coal is mostly carbon that reacts with oxygen to produce carbon dioxide. Equation 1 shows the combustion reaction of coal in the presence of atmospheric coal.
C + O2 --> CO2. (1)
By burning a gram of carbon nearly four grams of carbon dioxide is produced. On the basis of its type, coal comprises of nearly 60 to 70 percent carbon. Approximately 2 billion tons of coal is being burned annually in power plants around the globe in industrial sector which is responsible for emission of nearly 7 billion tons of carbon dioxide in atmosphere per year. Coal combustion adds nearly 46% of carbon dioxide in Earth’s atmosphere. The combustion of coal for the production of electricity contributes nearly 70% of greenhouse gases in atmosphere.
The aim of this study is to estimate the rise in temperature and climatic changes caused by the burning of coal in domestic and industrial sectors. This study aims at analyzing the impact of gases emitted in atmosphere by coal combustion from the years 2002-2020.
- Materials and Methods
Investigation site
South Asia is a region located at the southern boundary of Asia. The region covers nearly 3.5% of land surface of world. Spatially, it is spread over nearly 5.2 million km2 area which provide residence to nearly 1.9 billion people [20]. This region consists of eight countries including Pakistan, India, Sri Lanka, Afghanistan, Bhutan, Maldives, Nepal and Bangladesh. From previous few years, temperature of south Asia is increasing gradually.
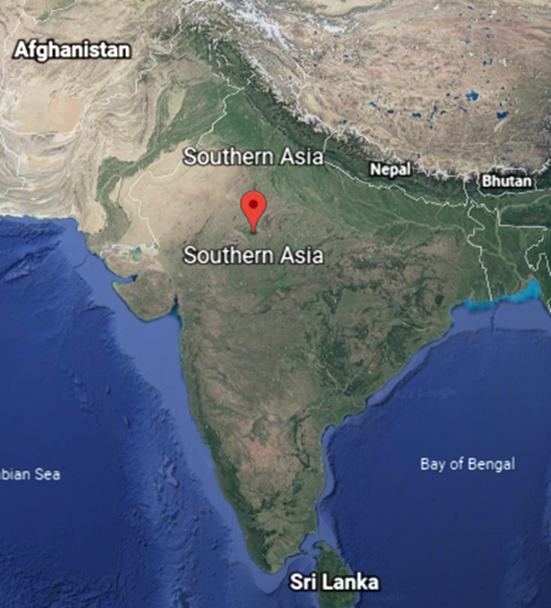
Figure 1. Study site
Material and methods
Daily product (ACOS_L2_Lite_FP) of atmospheric carbon dioxide prepared at a quality Level 2 (version - 9r) was obtained from TANSO FTS instrument aboard GOSAT satellite. This dataset contains bias corrected Carbon Dioxide column averaged dry air mole fraction. The Greenhouse gases observing satellite (GOSAT) is the first ever satellite designed to measure the two major greenhouse gases i.e. CO2 and CH4 from SWIR bands with a temporal resolution of three days.
Concentration of various greenhouse gases was obtained from GIOVANNI. Data acquired from GIOVANNI provided different atmospheric compositions. For the evaluation of natural events, remote sensing satellite data is significant to determine atmospheric compositions at regional and global scales.
Hotspot Identification
In terms of statistics, a region, point or a value that have comparatively higher readings than its surrounding is usually referred to as a hotspot. While in Geostatistics, a geographical dataset in hands spatial clustering or pockets of high and low values are of real importance.
In this particular study, a city is identified as a hotspot only if it has high CO2 concentration and is surrounded by areas with high values as well. For this purpose, ArcGIS geospatial statistical tool Getis-Ord Gi* was utilized. It helps in identification of the spatial clustering present in a data and performs autocorrelation. Getis-Ord Gi* generates an output feature class with standard deviations (Z scores) and statistical possibilities (P values). A larger (positive) Z score value indicates a hotspot while a smaller (negative) value indicates a statistically significant cold spot. It can be mathematically expressed as:

Where;
xi and xj represent attribute values of the variable under study in spatial units i and j (years).
d = distance (m)
ωij = weighted matrix
- Results and discussion
The concentration of carbon dioxide has been increased many folds from the year 2010 to 2019 as shown in the figure 2. Since the advent of industrial sector, at average the concentration of CO2 in air has been increased from 270 to 350 ppm. Atmospheric analysis through GIOVANNI showed that the concentration has increased up to 2.75 ppm from 2000 reaching up to 4.14 ppm in the year 2020. According to the world meteorological organization (WMO) 2020 has been the hottest year with nearly 1.2 °C rise in temperature above pre industrial era. According to WMO the rise in temperature will reach up to 1.5°C by the year 2024 if the consumption of coal and other fossil fuels remained unchecked. To avoid adverse climatic conditions the average global temperature should not be allowed to rise above 1.5°C. Temperature rise above 1.5°C will cause a significant rise in sea level which may lead to floods, droughts and in turn food insecurity. Figure 2 is presenting the atmospheric concentration of CO2on box-plot from 2010 to 2019.
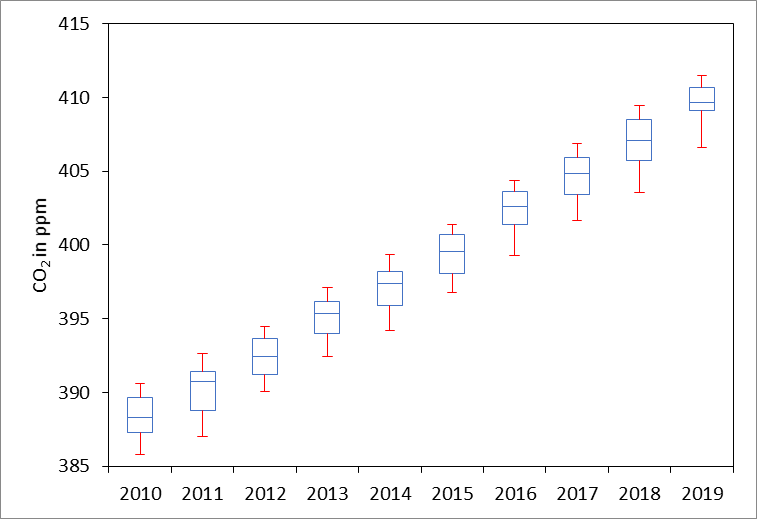
Figure 2. Atmospheric concentration of CO2on boxplot from 2010 to 2019.
The annual average value for year 2010 and 2019 is 388.4 ppm and 409 ppm respectively that indicates a clear and continuous increase of around 5.3% in the concentration of CO2 during the last decade.

Figure 3.Spatial distribution of CO2over investigation site during a) 2002-2006, b) 2007-2012, c) 2013-2016, d) 2017-2020. Measured in PPM by AIRS AIRX3C2M v005. Spatial Resolution 2 x 2.5 Deg.
Figure 3 presents the spatial distribution of CO2over study area from the year 2002-2020 utilizing the AIRS AIRX3C2M v005.In the time span of 2002-2006, the concentration of carbondioxide was highest in North-west region of south Asia which was recorded up to 3.803ppm. In the years 2007-2012 this concentration reached up to 3.903. The level of CO2 was exponentially increased in the entire study site in the time zones of 2013-2016 and 2018-2020 which was 4.005 and 4.057 respectively in the north-west region.The hotspots were identified by using Getis-Ord Gi* hotspot analysis tool in the study area, as illustrated in Figure 4. These hotspots include some of the major cities of south asia including, Herat and Kabul (Afghanistan), Lahore, Faisalabad and Islamabad (Pakistan), Amritsar, Delhi, Mumbai, Pune and Madurai (India), Dhaka (Bangladesh) and Colombo (Sri Lanka).
The northern part of the South Asia is depicted as a major emitter of CO2 in the region because of population increase leading towards frequent industrial activities and thus high fossil fuel burning rate. Southern region emits less GHG and is clearer apart from the ports as they are the hub of emissions due to shipping activities. Low emissions can be associated with fewer inhabitants and agricultural activities combined with more humidity and high air circulations from and to the Arabian Sea and Indian Ocean that aids in diluting the CO2concentrations.
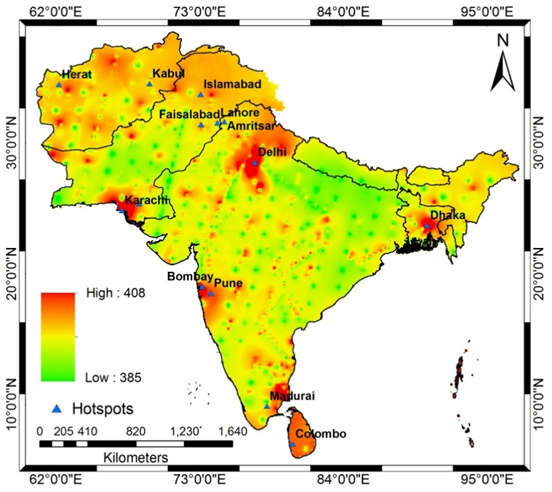
Figure 4.Result of hotspot analysis on point data of GOSAT
Table 1 depicts the average decadal value of CO2 for each hotspot along with its trend over the years. All the hotspots displayed an increasing trend with Dhaka and Lahore showing the highest increasing trend of 5.5%. Dhaka is known for having one of the worst air qualities in the world and motor vehicles play an important role in polluting its environment by burning petroleum. Some of the previous study proved the results generated in this paper as they revealed the growth of CO2 concentration (6.7%) to be higher than the country’s GDP (5.25%) and energy consumption (4.77%). Meanwhile, Lahore showed a high trend of GHG as population is increasing consequently the fossil fuel burning. In addition, the crop burning plays a vital role with the emissions transported from Indian Western Punjab (IWP) pile up the concentration and therefore increase the trend GHG. However, Amritsar depicts the least increasing trend of 4% among all the hotspots. Here, winds play significant role as they scatter the emissions towards the surrounding areas.
Table: 1Decadal increase in xCO2 concentration over the hotspots from 2010 to 2019
|
Sr. No. |
Hotspots |
Coordinates |
Area |
Population |
Average |
Trends |
|
(Lat. N and Long. E) |
||||||
|
1 |
Amritsar |
31.6340° N, |
250 |
1.13 |
397.3±4.5 |
4 |
|
2 |
Colombo |
6.9271° N, |
37.3 |
5.6 |
396.9±4.8 |
5.4 |
|
3 |
Dhaka |
23.8103° N, |
306 |
8.9 |
396.3±4.9 |
5.5 |
|
4 |
Faisalabad |
31.4504° N, |
1300 |
3.2 |
397.3±4.6 |
4.9 |
|
5 |
Herat |
34.3529° N, |
182 |
1.78 |
396.3±4.2 |
5.2 |
|
6 |
Hyderabad |
25.3960° N, |
625 |
1.7 |
397.3±4.4 |
4.7 |
|
7 |
Islamabad |
33.6844° N, |
220 |
1.43 |
397.4±4.5 |
4.7 |
|
8 |
Karachi |
24.8607° N, |
3780 |
15 |
397±4.9 |
5.2 |
|
9 |
Lahore |
31.5204° N, |
1772 |
12 |
396.7±4.7 |
5.5 |
|
10 |
Kabul |
34.5553° N, |
275 |
3.1 |
397±4.7 |
5.4 |
|
11 |
Madurai |
9.9252° N, |
148 |
1.47 |
397±4.5 |
4.8 |
|
12 |
Mumbai |
19.0760° N, |
603 |
12.4 |
397.5±4.8 |
4.9 |
|
13 |
New Delhi |
28.6139° N, |
42.7 |
21.75 |
398±4.5 |
4.9 |
|
14 |
Pune |
18.5204° N, |
331 |
3.99 |
397.2±4.8 |
5.2 |
According to studies, since the pre-industrial times CO2 concentrations have increased to a dangerous level. Various measurements revealed a global increase of 100 PPM (36%) in the last two and a half centuries (250 years). Moreover, studies from Mauna Loa Laboratories in Hawaii depicted a daily mean value as high as 400 PPM in May 2013. The only cause of such high and rapid increase in the CO2 levels over the years is the anthropogenic activities some of which involve fossil fuel combustion, transportation emissions, land-use changes (deforestation), biomass and crop burning and industrial processes[9, 19, 20, 17].
According to NASA once a gas is added in atmosphere it remains in atmosphere for nearly 300 to 1000 years. Anthropogenic activities can significantly cause changes in atmosphere. Half of the concentration of carbon dioxide has been increased after 1980s by the advent of industries. This research revealed that industrial coal combustion has raised the atmospheric temperature up to 412 ppm which is still rising. Since the start of industrial sector nearly 46% of carbon dioxide has been increased when the concentration of carbon dioxide was nearly 280 ppm.
Along the increasing the concentration of greenhouse gases and causing global warming, burning of coal also depletes the level of oxygen in atmosphere as it utilizes aerial oxygen for combustion. In order to control the release of carbon dioxide in atmosphere by burning of coal, carbon capture and storage technologies (CCS) are introduced in several countries of world. US government has invested nearly 4.8 billion$ in research of CSS in the wake of increasing average temperature of world. This study depicts that the combustion of coal must be reduced globally in order to conserve the natural environmental conditions.
- Conclusion
Coal is globally being utilized as an energy source. Burning of coal in furnaces and power plants produces carbon dioxide which is a greenhouse gas.Among all hotspots explored in this study Dhaka and Lahore showed the highest increasing trend of carbon dioxide up to 5.5%. The highest trend of CO2 emission is observed in the north-west region of South-Asia. The concentration of carbon dioxide in atmosphere has been increased from 280-409ppm since the revolution of industries. This high concentration of carbon dioxide in atmosphere is responsible for average rise of 1.2 °C temperature might result inrise the sea level and various landmasses will disappear by 2050. To conserve the environmental conditions the coal consumption must be reduced globally.
Conflict of Interest: Authors declare no conflict of interest while publishing this research paper in IJIST.
Project details. Nil
References:
- Braslau, Norman, and J. V. Dave. "Effect of aerosols on the transfer of solar energy through realistic model atmospheres. Part I: Non-absorbing aerosols." Journal of Applied Meteorology and Climatology4 (1973): 601-615.
- Nayak, Harsita, Shiv Poojan Yadav, and Deepak Kumar Yadav. "Contribution of Natural and Anthropogenic Activities in Greenhouse Gases Emission."Energy 4: 2.
- Al‐Ghussain, Loiy. "Global warming: review on driving forces and mitigation." Environmental Progress & Sustainable Energy1 (2019): 13-21.
- Allen, L. H., Jr. 1990. Plant responses to rising carbon dioxide and potential interactions with air pollutants. Environ. Qual. 19:15-34.
- Singh, Bharat Raj, and Onkar Singh. "Study of impacts of global warming on climate change: rise in sea level and disaster frequency." Global warming—impacts and future perspective(2012).
- Flannery, Tim. The weather makers: The history and future impact of climate change. Text Publishing, 2008.
- Alastuey, A., X. Querol, S. Rodriguez, F. Plana, A. Lopez-Soler, C. Ruiz, and E. Mantilla. "Monitoring of atmospheric particulate matter around sources of secondary inorganic aerosol." Atmospheric Environment 38, no. 30 (2004): 4979-4992.
- Abghari,H.,Tabari,,&Talaee, P.H.(2013).Riverflowtrends in the west of Iran during the past 40 years: impact of precipitation variability. Global and Planetary Change, 101, 52–60.
- Alexander,V.,Zhang,X.,Peterson,T.C.,Caesar,J.,Gleason, B.,Tank,A.M.G.K.,etal.(2006).Globalobservedchanges in daily climate extremes of temperature andprecipitation. JournalofGeophysicalResearch,111,D05109.Ambenje,,etal.(2007).
- InS.Solomon,D.Qin,M.Manning,Z. Chen,M.Marquis,K.B.Averyt, M.Tignor,&H.L.Miller (Eds.), IPCC, 2007: climate change 2007: the scientific basis.Contribution of working group I to the fourthassess- ment report of the inter-governmental panel on climate change(p.243).Cambridge:CambridgeUniversityPress.
- al., "An astronomically dated record of Earth’s climate and its predictability over the last 66 million years," Science vol. 369 (11 Sept. 2020), 1383-1387.
- Ratafia-Brown, Jay A. "Overview of trace element partitioning in flames and furnaces of utility coal-fired boilers." Fuel Processing Technology1-3 (1994): 139-157.
- Dove, Jane. "Student teacher understanding of the greenhouse effect, ozone layer depletion and acid rain." Environmental education research1 (1996): 89-100. https://www.worldometers.info/coal/pakistan-coal/
- Raghuvanshi, Shiv Pratap, Avinash Chandra, and Ashok Kumar Raghav. "Carbon dioxide emissions from coal based power generation in India." Energy Conversion and Management4 (2006): 427-441. https://www.nrdc.org/stories/fossil-fuels-dirty-facts
- Noor.T, Nazeer.I, Attique. Z, Shahzad. M “Global temperature variations since pre industrial era”. International Journal of Innovations in Science & Technology, Vol 03 Issue 02: pp 67-74, 2021.
- CC, 2013b: Summary for Policymakers. In: Climate Change 2013: The Physical Science Basis. Contribution of Working Group I to the Fifth Assessment Report of the Intergovernmental Panel on Climate Change
- Stocker, T.F., D. Qin, G.K. Plattner, M. Tignor, S.K. Allen, J. Boschung, A. Nauels, Y. Xia, V. Bex, and P.M. Midgley (eds.). Cambridge University Press, Cambridge, United Kingdom and New York, NY, USA, pp. 3–29.
- IPCC, 2012a: Summary for Policymakers. In: Managing the Risks of Extreme Events and Disasters to Advance Climate Change Adaptation [Field, C.B., V.R. Barros, T.F. Stocker, D. Qin, D.J. Dokken, K.L. Ebi, M.D. Mastrandrea, K.J. Mach, G.-K. Plattner, S.K. Allen, M. Tignor, and P.M. Midgley (eds.)]. Cambridge University Press, Cambridge, United Kingdom and New York, NY, USA, pp. 3–21. https://www.powermag.com/for-first-time-iea-quantifies-coals-dominant-role-in-global-temperature-increase/
- International Energy Agency, Energy Technology Perspectives 2020, Special Report on Carbon Capture Utilisation and Storage – CCUS in clean energy transitions (September 2020)
- Haq.U.E, Waseem.F“ Appraisal of Temporal Variations in Atmospheric Compositions over South Asia by Addition of Various Pollutant’s in Recent Decade”. International Journal of Agriculture & Sustainable Development, Vol 03 Issue 01: pp 01-15, 2021. https://www.climate.gov/maps-data/dataset/greenhouse-gas-concentrations-graphing-tool


