
Evaluation of LNG consumption in local market through GIS
Ghulam Nabi1, Muhammad Adeel1, Sana Alvi1, Muhammad Zubair Atiq1, Atif Ahmad1, Anmol Shehzadi2, Ayesha Riaz3
1 Remote Sensing group, Department of Space Science, University of the Punjab, Quaid-e-Azam Campus, Lahore, Punjab, Pakistan.
2 Department of Environmental Sciences, University of Geosciences Wuhan China.
3 Department of Geography, University of the Punjab Lahore Pakistan.
*Correspondence | Ghulam Nabi E-mail: ghulamnabi.spsc@gmail.com
Citation | Nabi.G, Adeel. M, Alvi. S, Atiq. M.Z, Ahmad. A, Riaz. A, Raza. S, “Evaluation of LNG consumption in local market through GIS”. International Journal of Innovations in Science and Technology, Vol 01 Issue 02: pp 79-88.
DOI | https://doi.org/10.33411/IJIST/2019010203
Received | March 01, 2019; Revised |April 15, 2019 Accepted | April 17, 2019; Published | April 18, 2019.
________________________________________________________________________
Abstract.
Liquified natural gas (LNG) has become a basic energy source which is mainly used to run industrial wheel. It has played a vital role for boosting economic growth/GDP of Pakistan. Most of power plants and industries use LNG for generation of commodities of domestic use. The contribution of LNG in the total energy supply is 38% which increases up to 40% in winter. This research was conducted in Rana Town Ferozwala. We selected this area because of non-availability of Sui Northern or Southern network of gas pipelines. We used spatial interpolation technique to map the sale of LNG at various sale points throughout the year 2017. We observed the maximum sale of LNG during winter season (Nov-April) where the LNG demands exceeded from 13.2 tons as compared to the normal 8 tons. It was observed that the LNG demand was declined below the approximated demand e.g., a very less amount of LNG was consumed during June and July which was (2.7-6.9) tons and (2.9-6.7) tons respectively that must be more than 8 tons. On field observation we found that most of people prefer the usage of biofuel instead of LNG in summer season because there is excess of dry residue of animals and the dry wood as well for cooking. This trend analysis determines the LNG consumption across a region where interpolation technique proved efficient in public trend mapping for purchase of LNG during 2017.
Keywords. LNG, GDP, Economic growth, interpolation, LNG distribution points.
1. Introduction.
Economic development and fastly growing urbanization have boosted up the energy demands by 30% in last two decades [1]. Liquified natural gas is clean, cheap, efficient, and thus preferred by many countries as compared to various other sources of energy such as, coal and fossil fuels. The demand of natural gas has been increased by 12% in China from 2012 to 2019, which made china 3rd largest user of natural gas throughout the world. The discovery of new sources of natural gas are vary less in comparison to global demands therefore, it is very important to forecast the natural gas demands of any country to manage its energy planning and policy.
Raw estimates of LNG consumption may lead to mismanaged infrastructure and supplies. This situation is accounted for economic losses at regional scales. Therefore, it is significant for all stakeholders of energy sector to manage foreign supply contracts keeping in view the accurate estimates of LNG demand for a sustainable future. In recent decades, many researchers have proposed a variety of models to forecast the LNG demands accurately. There are basic three categories of these models: 1) Artificial intelligence models 2) Statistical models and 3) Hybrid models [2].
The widely used artificial intelligence models include 1) support vector machine 2) neural network model 3) Extreme learning machine model and 4) least square vector machine model. A hybrid model was proposed by wang et al [3] to forecast electricity consumption. The analytical hierarchy process was used by Geng et al [4] who sorted out all the existing energy consumers using weight analysis to manage energy sources by assigning them priority. The support vector machine model was used by Ahmed [5] to review the consumption of electricity in comparison to its productions. A hybrid model was proposed by Barman et al [6] to forecast the electricity load by integrating support vector machine model with grasshopper optimization model. A new load predicting model was introduce by Niu and Dai by integrating grey relational analysis with least square vector machine to predict the demands of electricity [7].
Most of statistical models are based on a variety of regressive approaches e.g., auto aggressive, heteroscedasticity model. Many researchers used statistical techniques to forecast the energy load e.g., Xu et al, [8] used Hp filters to evaluate the energy required for Guangdong in China. Autoregressive moving model was used by Sen et al [9] who generated a relationship between green-house emissions and the energy consumption. An intelligent grey model was presented by Zeng and Li [10] to forecast the demands of natural gas in china for the duration 2015-2020. Multivariate and univariate class models were used by wang and Wu [2] to predict energy market volatility.
Based on above studies, this research aim at identification of LNG demands and enhancement of LNG business using real-time field observations.Study area.
This research was conducted in Rana Town Ferozwala. We selected this area because of non-availability of Sui Northern or Southern network of gas pipelines. There were about 661 active households using LNG in cylinders, refilled by gas distributors. The spatial locations of main LNG distributors are marked in map as shown Figure 1.
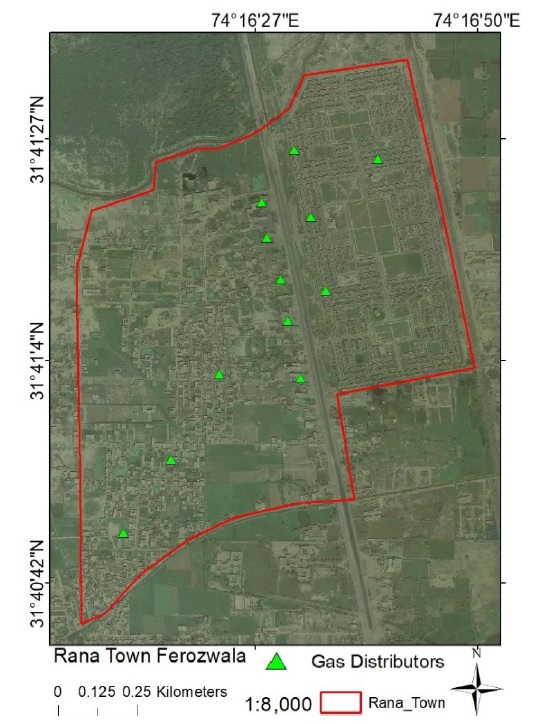
Figure 1. Locations of LNG distributors in Rana Town Ferozwala.
Materials and methods:
Liquified natural gas (LNG) has become a basic energy source which is mainly used to run industrial wheel. It has played a vital role for boosting economic growth/GDP of Pakistan. Most of power plants and industries use LNG for generation of commodities of domestic use [11]. The contribution of LNG in the total energy supply is 38% which increases about 40% in winter. Pakistan has contracted about 4-5 million tons of LNG within this year from Qatar. Pakistan aim at importing LNG from Russia and Japan. Total demands of LNG in Pakistan are nearly 30 million tons for which Pakistan has joined hands with Iran to meet the energy demands. Pakistan will complete the construction of seven LNG terminals by the end of 2019 [12].
The LNG sector and the county’s energy policy are formulated by provincial, institutional and federal entities which are responsible for identifying, addressing all the issues related to distribution, consumption and production of LNG [13]. Gas and Oil sector of Pakistan is extensively regulated, rapidly changing and highly complex.
Transmission, distribution, exploration and development of LNG is regulated by Oil and Gas Regularity Authority (OGRA). All the infrastructure and networks used in distribution of LNG are owned by Sui Northern and Sui Southern gas limited [14]. These companies purchase LNG in huge quantity from petroleum companies and distribute it through transmission networks to commercial, industrial and domestic customers. There is a regulatory mechanism introduced by OGRA for production, extraction, consumption and distribution of petroleum and gas products. These laws cover all regulations and agreements amongst rights, liabilities, stakeholders, and investors to enhance returns from local market [15]
We used spatial interpolation techniques to investigate the variations in purchase of gas at various sale points as shown in Figure 1. Interpolation is a technique of extraction of unknown data points on the basis of known points [16]. Spatial interpolation is widely used in trend mapping e.g., the weather experts use interpolation to construct weather maps to determine temporal variations in rainfall, temperature, humidity or pressure for a specific time span [17]. There are basic three types of spatial interpolations that include Inverse Distance Weightage (IDW), Kriging and Spline [18]. We can accept or reject any of the technique depending upon the application for which we are applying it. In IDW, the sample points are weighted depending upon the associated weights attached to a specific point [19].Here the weighting coefficients are computed which determine the influence of weight of one point on the other. A simple demonstration of IDW is shown in Figure 2.
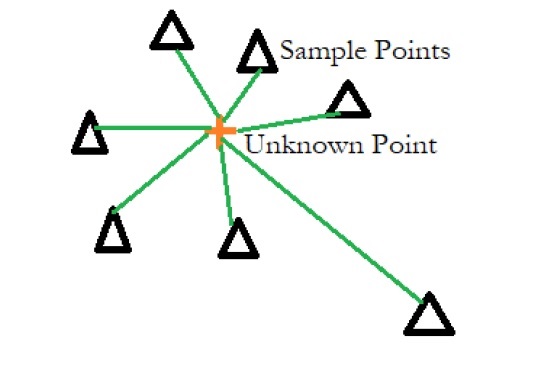
Figure 2. Demonstration of IDW interpolation.
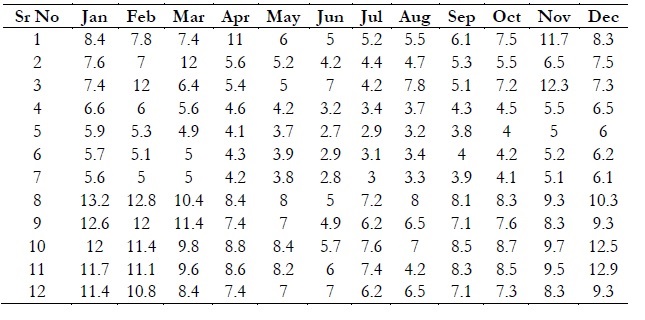
We selected 12 distributors of LNG, working in Rana Town. The spatial locations of these distributors are marked in Figure 1. Figure 1 is showing that 8 distribution points were located along road sides while 4 were away from main road. These distributors were feeding to 661 residents of Rana Town. According to a local survey, a household may consume 0.013 ton per month to run his/her domestic affairs properly, therefore, the total supply of LNG which was required to feed the investigation site, was almost 8.6 tons per month. We obtained the data about LNG sale from sale points on monthly basis. The data is mentioned in Table 1 as below,
Table 1. Monthly LNG sale in tons at various distribution points.
Results and discussions.
We applied IDW interpolation on monthly LNG sale data collected from various distributors working in Rana Town and mapped the results in Figure 3. Figure 3 is showing spatial variations in LNG sale during 2017. The results describe that maximum sale of LNG was performed from the points which were located along the road side. These points were actually located on the Grand Trunk road therefore, LNG customer mostly approach the main shops instead of others which were located in the back areas of the town away from main road. The selection of main point instead of others was due to fluctuations in LNG prices as the main dealers sale at comparatively cheap rates as compared to others.
We observed that maximum sale of LNG was during the winter season (Nov-April) where the LNG demands exceeded from 13.2 tons as compared to the normal 8 tons. The main reason of this increase in demand was due to frequent usage of other appliances e.g., LNG heaters, lamps and furnaces. The material used in stoves and furnaces consume more LNG to maintain its temperature during winter season. However, comparatively very less amount of LNG was required during the summer season.
It was observed that the LNG demand was declined below the approximated demand during summer season e.g., a very less amount of LNG was consumed during June and July which was (2.7-6.9) tons and (2.9-6.7) tons respectively that must be more than 8 tons. On field observation we found that most of people prefer the usage of biofuel instead of LNG in summer season because there is excess of dry residue of animals and the dry wood as well.
Another factor which was a main constrain to consume LNG, was the buying power of residents. Most of residents were observed poor who were living below the line of poverty. They didn’t afford high prices of LNG therefore, they preferred to use other sources for cooking etc.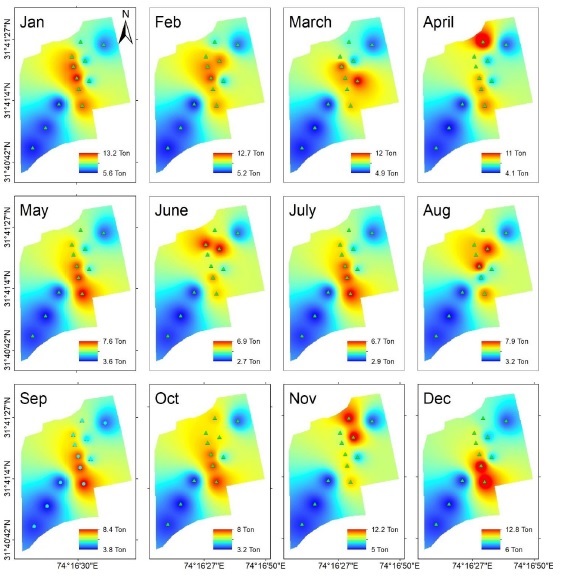
Figure 3. Spatial trends of LNG sale during 2017.
We observed fluctuations in public trend to rush toward various LNG sale points which were located along the road side as shown in Figure 4.
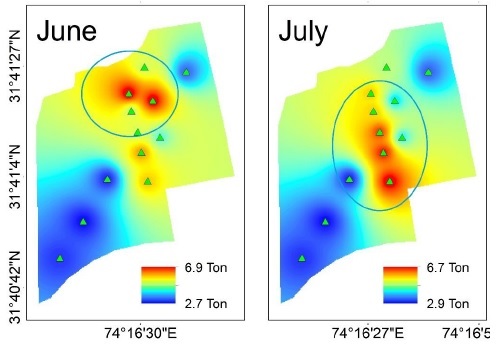
Figure 4. LNG sale during the months June and July 2017.
The hotspots are marked within blue circles in both parts of Figure 4 (A,B). It is clear that red spot has been moved from upper portion of Figure 4A to downward in Figure 4B. It means that the residents visited the upper part of Figure 4A for purchase of LNG in June 2017 while this hotspot shifted to downward in Figure 4B in July 2017. We investigated this trend and observed that people are price conscious therefore, they preferred to buy LNG at low rates ignoring the quality.
Conclusion.
This trend analysis determines the LNG consumption across a region where interpolation technique proved efficient in public trend mapping for purchase of LNG during 2017. This trend analysis is of great importance to manage and enhance the LNG market in a proper way. LNG is the substitute of fuel which contribute about 40% in energy sector of Pakistan therefore, LNG market must be enhanced by keeping in view the public trends and creating awareness among masses.
Acknowledgement. We acknowledge earth explorer for provision of valuable data to accomplish this task.
Author’s Contribution. All the authors contributed equally.
Conflict of interest. We declare no conflict of interest for publishing this manuscript in IJIST.
Project details. NIL
Reference
1. International Energy Agency (IEA). World Energy Outlook; Head of Communication and Information Office: Paris, France, 2010. Available online: http://www.iea.org/ (accessed on 15 October 2017).
2. Wang, Y.D.; Wu, C.F. Forecasting energy market volatility using GARCH models: Can multivariate models beat univariate models? Energy Econ. 2012, 34, 2167–2181. [CrossRef]
3. Ahmad, A.S.; Hassan, M.Y.; Abdullah, M.P.; Rahman, H.A.; Hussin, F.; Abdullah, H.; Saidur, R. A review on applications of ANN and SVM for building electrical energy consumption forecasting. Renew. Sustain. Energy Rev. 2014, 33, 102–109. [CrossRef]
4. Geng, Z.Q.; Qin, L.; Han, Y.M.; Zhu, Q.X. Energy saving and prediction modeling of petrochemical industries: A novel ELM based on FAHP. Energy 2017, 122, 350–362. [CrossRef]
5. Ahmad, A.S.; Hassan, M.Y.; Abdullah, M.P.; Rahman, H.A.; Hussin, F.; Abdullah, H.; Saidur, R. A review on applications of ANN and SVM for building electrical energy consumption forecasting. Renew. Sustain. Energy Rev. 2014, 33, 102–109. [CrossRef]
6. Barman, M.; Choudhury, N.B.D.; Sutradhar, S. A regional hybrid GOA-SVM model based on similar day approach for short-term load forecasting in Assam, India. Energy 2018, 145, 710–720. [CrossRef]
7. Niu, D.; Dai, S. A short-term load forecasting model with a modified particle swarm optimization algorithm and least squares support vector machine based on the denoising method of empirical mode decomposition and grey relational analysis. Energies 2017, 10, 408. [CrossRef]
8. Xu, W.J.; Gu, R.; Liu, Y.Z.; Dai, Y.W. Forecasting energy consumption using a new GM-ARMA model based on HP filter: The case of Guangdong province of China. Econ. Model. 2015, 45, 127–135. [CrossRef]
9. Sen, P.; Roy, M.; Pal, P. Application of ARIMA for forecasting energy consumption and GHG emission: A case study of an Indian pig iron manufacturing organization. Energy 2016, 116, 1031–1038. [CrossRef]
10. Zeng, B.; Li, C. Forecasting the natural gas demand in China using a self-adapting intelligent grey model. Energy 2016, 112, 810–825. [CrossRef]
11. Shaikh, F.; Ji, Q. Forecasting natural gas demand in China: Logistic modelling analysis. Electr. Power Energy Syst. 2016, 77, 25–32. [CrossRef]
12. Zhang, R.; Dong, Z.; Xu, Y.; Meng, K.; Wong, K. Short-term load forecasting of Australian national electricity market by an ensemble model of extreme learning machine. IET Gener. Transm. Distrib.2013, 7, 391–397. [CrossRef]
13. Chaturvedi, D.; Sinha, A.; Malik, O. Short term load forecast using fuzzy logic and wavelet transform integrated generalized neural network. Electr. Power Energy Syst. 2015, 67, 230–237. [CrossRef]
14. Li, S.; Wang, P.; Goel, L. A novel wavelet-based ensemble method for short-term load forecasting with hybrid neural networks and feature selection. IEEE Trans. Power Syst. 2016, 31, 1788–1798. [CrossRef]
15. Fard, A.K.; Akbari-Zadeh, M.R. A hybrid method based on wavelet, ANN and ARIMA model for short-term load forecasting. J. Exp. Theor. Artif. Intell. 2014, 26, 167–182. [CrossRef] Energies 2018, 11, 825 16 of 16
16. Imran.R.M, Rehman.A, Khan.M.M, Jamil.M.R, Abbas.U, Mahmood. R.S, and Mahmood.S.A, Ehsan. U.H. Delineation of drainage network and estimation of total discharge using Digital elevation Model (DEM). International Journal of Innovations in Science and Technology, Vol 01 Issue 02: pp 50-61, 2019.
17. Hassan.S.S, Mukhtar.M, Haq.U.H, Aamir.A, Rafique.M.H, Kamran.A, Shah.G, Ali.S and Mahmood.S.A “Additions of Tropospheric Ozone (O3) in Regional Climates (A case study: Saudi Arabia)”. International Journal of Innovations in Science and Technology, Vol 01 Issue 01: pp 33-46, 2019.
18. Gillani.S.A, Rehman.S, Ahmad.H.H, Rehman.A, Ali.S, Ahmad.A, Junaid.U, and Ateeq.Z.M Appraisal of Urban Heat Island over Gujranwala and its Environmental Impact Assessment using Satellite Imagery (1995-2016). International Journal of Innovations in Science and Technology, Vol 01 Issue 01: pp 1-14, 2019.
19. Nabi.G, Kaukab.I.S, Zain S.S.A.S, Saif.M, Malik.M, Nazeer.N, Farooq.N, Rasheed.R and Mahmood S.A”. Appraisal of Deforestation in District Mansehra through Sentinel-2 and Landsat imagery. International Journal of Agriculture and Sustainable Development, Vol 01 Issue 01: pp 1-16, 2019.
 |
Copyright © by authors and 50Sea. This work is licensed under Creative Commons Attribution 4.0 International License. |


