
Evaluation of tectonic geomorphology of Awaran in Baluchistan, Pakistan using SRTM data.
Abdul Baqi1, Tabasam Jamal2
1Government Boys Postgraduate College,Sariab Road Quetta.
2Department of Geography, Punjab University, Quid e Azam Campus, Lahore.
* Correspondence: Abdul Baqi, baqiaziz7@gmail.com.
Citation | Baqi. A and Jamal. T, “Evaluation of tectonic geomorphology of Awaran in Baluchistan, Pakistan using SRTM data.”International Journal of Innovations in Science & Technology, Vol 03 Issue 03: pp 116-125, 2021.
Received | Aug 05, 2021Revised |Aug 18, 2021Accepted| Sep 23, 2021; Published |Sep 28, 2021.
________________________________________________________________________
An earthquake of September 24, 2013 with a magnitude of 7.7Mw destroyed extensive region of Awaran district located in province Baluchistan in southern Pakistan, the earthquake was nearly 10km deep below the surface of earth. This convulsion brought a havoc in the inaccessible and remote regions and victimized nearly 810 families. This tremor destroyed the non-engineered human structure within 100 km of the earthquake which caused tremendous loss of human lives. In this paper Digital elevation model (DEM) was utilized to study active deformation and mapped the isobase, relative relief, drainag density incision and vertical dissections which indicates that Awaran Fault sinisterly active in NNE-SSW direction and the deformations were highlighted. The high value of drainage density was observed on northern east and in the central region of southern west region of Awaran district. The drainage density is elevated by accelerated erosion in surrounding region. DEM and remote sensing tools proved efficient to study the region efficiently.
Keywords: Awaran Earthquake, Surface dynamic maps, SRTM DEM, Awaran Fault, Isobase Map.
Introduction
Earthquakes have been a cause of tremendous loss of property and lives multiple times in Pakistan [1]. It is because Pakistan is located in a seismically active region of the world. Various regions of Pakistan are at high risk of earthquakes. Earthquakes can either be too low can go unnoticed or too high to wreck the entire city [2]. Pakistan has experienced several tremors at various regions ranging from a magnitude of 7.3 to 7.8 in the northern and southern regions due to dynamic faults [3,4,5]. In these regions nearly half of the community survives with a threat of earthquakes [6].
Nearly 90% of earth’s seismic activity takes place when two or more active tectonic plate pass slides or collides with each other within close belts [7,8,9]. The Tibetan pleatues and the Himalayan mountain ranges were formed because of collision of Indian and Eurasian Plate nearly 50 million years ago [10]. Chaman Fault is a major seismically active fault that runs along Pakistan and Afghanistan in nearly 850 km [11]. Pakistan geologically comprises of Europe-Asian and Indian plates [12].
These geological plates have been divided through faults into left and lateral strike slip faults. Along the Chaman fault the Indo-Australian fault slips towards north [13]. Due to this elementary transform, the boundary of such plates are called as transpersonal boundary. Due to the collision of Indian plate with the Europe-Asian plate the, Chaman fault comprises of compressional elements [14].
The Indian plate joins with Europeasian plate in a counter clockwise spinning motion and the rate of joining decreases western region of India [15]. These plates are separated on the western side due to change in river profile with Chaman fault zone. The Chaman faults consists of 160-325 km wide belt and it is connected to other faults [16]. This belt is dramatically extended to the marginal line in western boarder of Indian- Europe and Asian plates [17, 18, 19].
Chaman fault is the left side strike slip fault which changes to transgressive side in the Europe-Asian and Indian plates. Makran fault located in the southern side of Chaman fault shorten these plates [20, 21, 22]. Indian and Europeasian plates move at the rate of 26mm per year while these faults move at the rate of 5-8mm per year. The earthquakes show distortion in the seismic regions [23, 24, 25].
The aim of this study was to utilize Remote Sensing techniques to analyse surface deformation through remotely sensed datasets and the deformations were maked with maps the regions having high drainage density, surface deformation and incision leasing to severe tremors which can destroy human engineered structures and can lead to loss of hundreds to thousands of lives.
STUDY AREA
Awaran is a city located in Baluchistan, a province in Pakistan. This city is also serving as a tehsil headquarter. Before 1981, the city was a sub division of district Khuzdar. Awaran was proclaimed as a district on November 1992. This district comprises of two tehsils which include Awaran and Mashkae [26]. The study area is mapped in Figure 1.
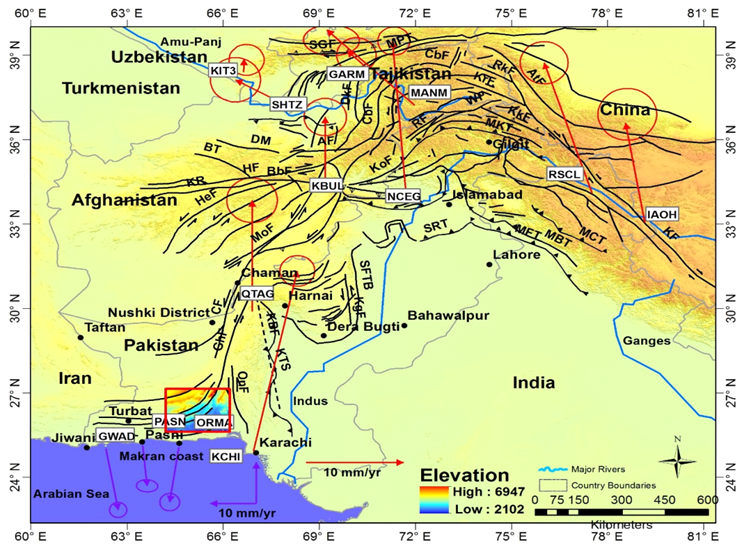
Figure 1: The regional tectonics structures mapped in the context of continental plates of India -Eurasian plate.
The district consists of an unpopulated sub tehsil JhalJhao. The district is expanded in a region of nearly 29510 km2. The district lies between northern latitudes of 25° 26 and 27° 28 and at eastern longitude of 64° 08 and 66° 10.
MATERIALS AND METHODS
Data Acquisition and Processing
In this paper the SRTM DEM and Vector data is utilized to map Awaran district.
Digital Elevation Model ( DEM )
The Earths elevation can be represented digitally by DEM. The DEM is represents topographic variations in hight vertically. This model accurately displays the topography of plains. The following softwares accurately represents the data and portray results in an effective manner [27, 28, 29, 30].
Software Used
Following Softwares are used in this research to attain accurate results.
Table.1 List of Softwares which has been used for this thesis.
|
S.No |
Name of software |
Purpose of usage |
|
1. |
Arc GIS |
Digitizing, |
|
2. |
ENVI (4.7) |
Mosaicing, Classification, importing of shades of hill, for Importing and Exporting(.img to .geotiff), AOIs Truncation |
|
3. |
MATLAB 7.6.0.324 (R2008a) |
The Stream Staller order, to Extract geomorphic Indices and DEM Processing |
|
4. |
River Tools IDL 2.4 |
river network analysis of river as well as D8 algorithm |
|
5. |
Google Earth 7.1 |
Areas Identification |
|
6. |
Coral Draw |
Graph fix up |
Hypsometric Integral (HI)
Hypsometry is globally known for the measurement of geographical features of the surface of earth. The hypsometric terms are used to assess elevations and depths of various structures of earth. It is also used to compare various drainage basins without using any dimension. The specificity of this method is to describe landscape elevations or area of drainage basins. Figure 2 shows the variations in Hypsometrical Integral and shows the elevation and drop of drainage areas [31, 32, 33, 34].
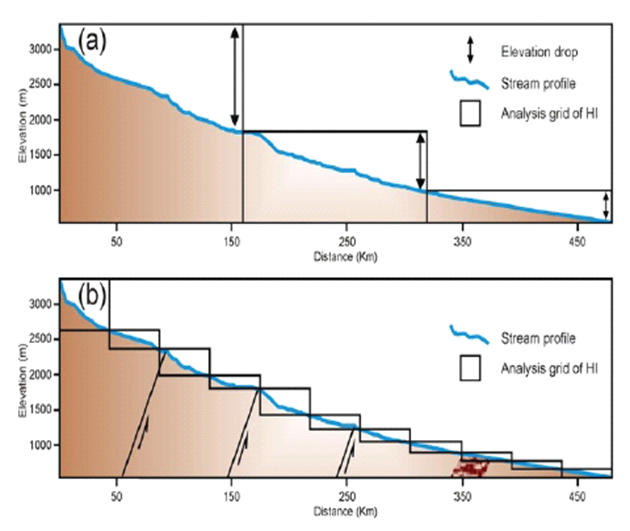
Figure.2: (a) The Elevation Drop and Hypsometric Integral’s variation (b) The watersheds are divided in minor chunks in order to evaluate the variation of local Hypsometrical Integral.
Following equation can be used to determine the value of Hypsometric Integral,
The value of HI ranges from 0 to 1 and the Hypsometric curves show the HI value, the convex shape indicates high HI value whcih indicates the uplift tendency and young active tectonic [35, 36, 37].
RESULT AND DISCUSSION
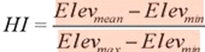
The Analysis of Drainage Density
The value of drainage density is high on NNE side near Sheerin Aab, Taftan and Mastun. The drainage density can have higher values in the central region of SSW of GidarSurab Road and NeemraghKand. The erosion accelerated in surrounding conditions can elevate the drainage density.
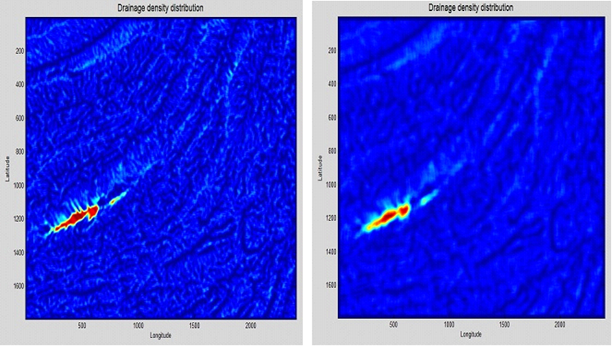
Figure 3: The Drainage density map of zone of awaran’s screen shorts using Matlabhaving window size 1km and 2 km.
The regions having defrosted vegetation has high drainage density due to low rate of absorption of water by cover basins and well organized channel system. Eroded lands have a greater chance of floods and high drainage density due to high runoff.
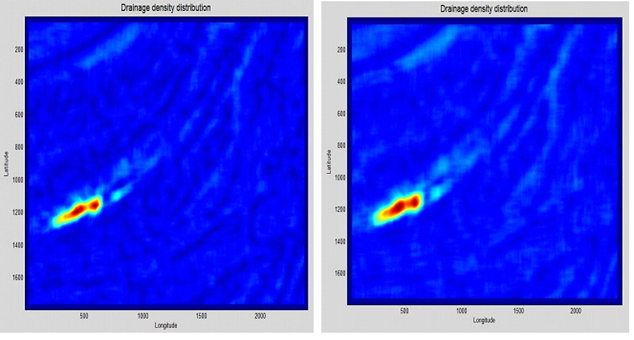
Figure 4: The description of map about the Drainage density of the zone of awaran’s screen shorts using Matlab having window size 3km and 4 km.
Thus the drainage density and erosion goes side by side, increase in any of these factors increases the vulnerability of these regions to natural disasters. Figure 3 and 4 shows the hotspots of high drainage density in Awaran region using maps obtained through Matlab at different windows.
The NWW side of NeemraghKand has low value of drainage density. Lower values of drainage density means lower risk of floods. As the drainage density increases the surface deformation and surface roughness is also increases which increases the risk of natural disasters in seismically active regions. The hotspots are shown in Figure 5 which illustrates the isobase map of study site obtained through Matlab.
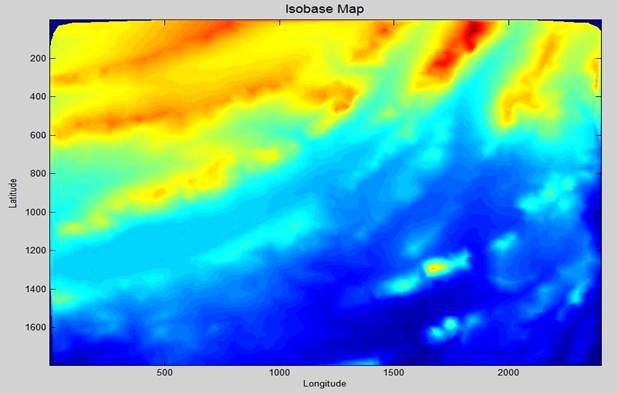
Figure 5: The Isobase level map Screen Shorts of of Awaran zone using Matlab.
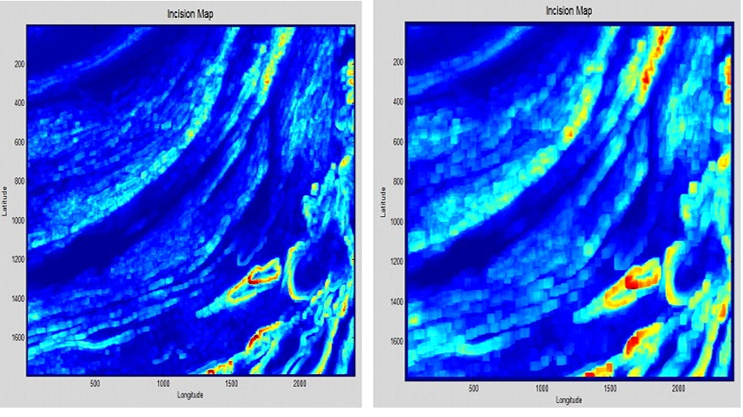
Figure 6: The description of map of relative relief’s about Awaran region having window size 1 km and 2 km by using Matlab.
Bed rocks of Krastic regions have high fluvial deposits, thus the floors of valley are highly weathered and lower height and flood volume. Figure 6 and 7 shows the incision mapped in the study area using Matlab. Incision has been mapped using DEM.
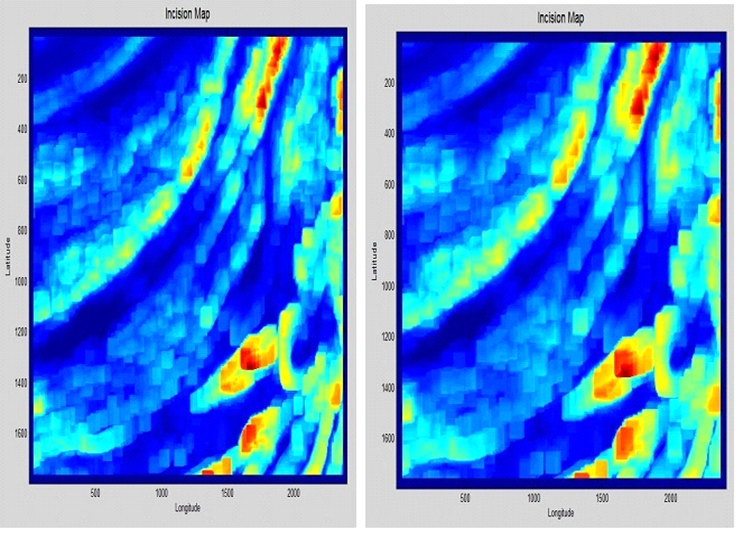
Figure 7. The description of map about Relative relief’s Screen Shorts of region of Awaran of size of window that is 3 km and 4 km by using Matlab
The high deposition of fluvial materials in the stream bed leads to the vertical incision of streams which deepens the floors of networked streams leading to cutting down and increased surface roughness in stream networks.
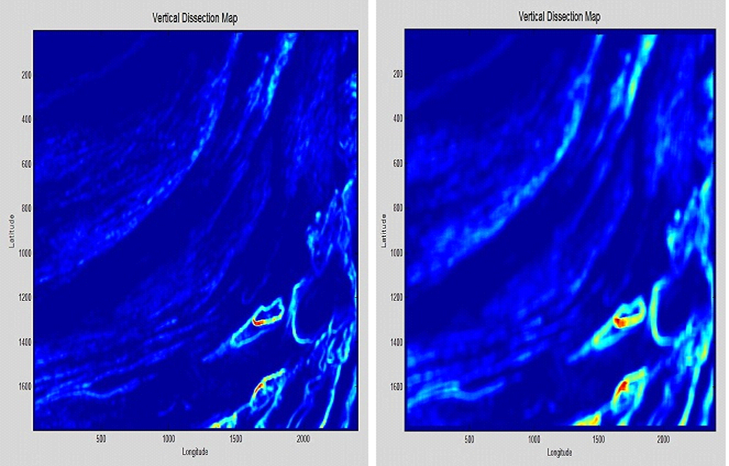
Figure. 8: Description of map of Topographic surface roughness Screen Shorts of zone of Awaran with size of the window 1 km and 2 km by using Matlab.
The regions with low fluvial deposits and high erosion indicates more topographic surface roughness and surface deformation. Figure 8 and 9 shows the vertical dissection map of study site.
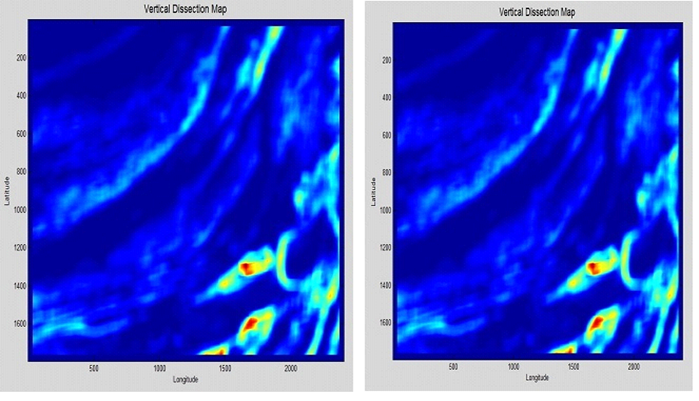
Figure 9: The Topographic surface roughness map Screen Shorts of Awaran zone having window size 3 km and 4 km by using Matlab.
The Hypsometric Analysis
The significant information regarding geomorphic indices can be obtained through Hack stream length gradient index and Hypsometry. These methods can provide significant data regarding slanting, regional uplift and local topographic uplift which may cause surface deformation.
Hypsometry is a method widely used for the assessment of lithological features, intensity and strength of active tectonics and the effect of climate on geomorphology. It also illustrates different elevations present in drainage basin. DEM can be used to determine the value of HC and HI through geographical information system.
The HI and HC values have been used multiple times to investigate, intensity and potency of tectonic activism and elevations at drainage basins. However the HI values have some conflicts. HI values are significantly dependent on geometry and elevation of basin and upon the drainage area of basin.
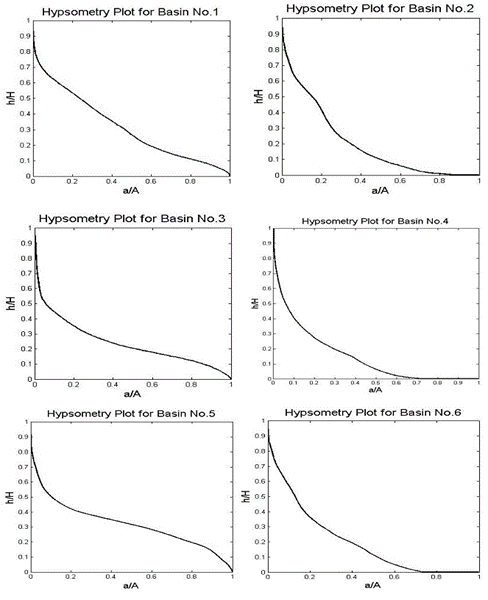
Figure 10: Hypsometric curves (HC) for different basins of order 6
The parameters which can disturb the topography of any region can be analyzed significantly utilizing Hack stream length gradient index and Hypsometry. Hypsometric analysis is an initial geomorphic indices which can provide vital information regarding relative uplift, regional uplift and local topographical uplift. It is widely used to analyze the intensity of active tectonics and their impact on geomorphologic parameters.
Hypsometry illustrates different elevations in the river basins. The HC and HI values are analyzed utilizing digital elevation model. The HI value is highly dependent on basin elevation, basin geometry and drainage areas. Figure 10 illustrates HC values for different basins. Instead of basins, the grid values are used to calculate HI values. In Pakistan, the most seismically active zone is Baluchistan, which has HI value up to order 4. The severe history of earthquakes lies in the lower region of Arabian Sea Syntaxes, it is a region where Indian and Europe-Asian plates collide. The tectonic activity can be determined using different features of Hypsometric Integral which are freely available on the website. SRTM and DEM with a spatial resolution of 90m is used in this study.
Earthquakes occur usually as a result of strike slip of faults. The western regions of Pakistan are experiencing left lateral strike slip along Chaman fault at higher velocity as compared to other regions of country. Destructive tremors are often related to strike slip faults. Chaman fault runs in the western region of Pakistan which is seismically active fault. Baluchistan is considered the most vulnerable province because of seismically active Chaman fault which comprises of Indian and Europe Asian plates that move at the rate of 26 mm per year. The collusion of these plates causes destructive earthquakes. In September 24, 2013 the earthquake hit Awaran with a magnitude of 7.7 M as a consequence of lateral strike slip at shallow depths. It killed nearly 60 thousand people and destroyed the human engineered structures in the region. The tectonic geomorphology of Awaran district makes it highly vulnerable for natural disasters most prominently the earthquakes. The tectonic geomorphology of Awaran district is dependent on several parameters including drainage density, erosion and incision etc.
Conclusion:
The earthquake in the Awaran region had a magnitude of 7.7 Mw which added to the seismic activity along the subduction zone in the Chaman fault and Makran zone and also enhanced the neo tectonic activity in South east and northern region. This incident activated various other faults. These tectonic activities can be analyzed using remotely sensed techniques which are helpful in generating maps and analyze surface deformation precisely.
REFRENCES
- Altamimi, Z., X. Collilieux, J. Legrand, B. Garayt, and C. Boucher, A new release of the International Terrestrial Reference Frame based on time series of station positions and Earth Orientation Parameters. Journal of Geophysical Research, Vol 112, 2007.
- Apel, E., R. Burgmann, P. Bannerjee, and B. Nagarajan, Geodetically constrained Indian plate mo- tion and implications for plate boundary deforma- tion, Eos Trans. AGU, Vol 87, issue 52, pp: T51B-1524, 2006.
- Ambraseys, N., and R. Bilham, Earthquakes and associated deformation in Northern Baluchistan 1892–2001, Bull. Seismol. Soc. Am., Vol 93, issue 4, pp: 1573–1605, 2003.
- Atkinson, G.M., An Overview of Developments in Seismic Hazard Analysis. Proceedings of the 13th World Conference on Earthquake Engineering, Vancouver, 2004.
- Ambraseys, N., and R. Bilham, Earthquakes and associated deformation in northern Baluchistan, Bull. Seismol. Soc. Am., Vol 93, pp: 1573 – 1605, 2003.
- Bender, F. K., and H. A. Raza (Eds.), Geology of Pakistan, Beitr. Reg. Geol. Erde, vol. 25, pp: 414, 1995.
- Banks, C. J., and J. Warburton (1986), ‘Passive-roof’ duplex geometry in the frontal structures of the Kirthar and Sulaimanmountain belts, Pakistan, J. Struct. Geol., Vol 8, pp: 229 – 237, 1986.
- Bernard, M., B. Shen-Tu, W. E. Holt, and D. M. Davis (2000), Kinematics of active deformation in the Su- laiman lobe and range, Pakistan, J. Geophys. Res., Vol 105, issue 13, pp: 253–13,279, 2000.
- Bullard, E.C., Everett, J.E. & Smith, A.G., The fit of the continents around the Atlantic, Phil. Trans. R. Soc. London, Ser. A., Vol 258, pp: 41–51, 1965.
- Bilham, R. Earthquakes in India and the Himalaya: tectonics, geodesy and history. Annals of Geophysics, Vol 47, pp: 839–858, 2004.
- Beun, N., P. Border, and I. Carbonnel, Premieres donneesquantitatives relative au coulissage du crochement de Chaman, Afghanistan du sud-est, C. R. Seances Acad. Sci., Ser. D, Vol 288, pp: 931–934, 1979.
- Bannert, D., A. Cheema, A. Ahmed, and U. Schaffer, The structural development of the western fold belt, Pakistan, Geol. Jahrb., Reihe B, Vol 80, pp: 60, 1992.
- Griesbach, C. L. On the geology of the country between chappar Rift and Harnai in Baluchistan. Geological Survey of India, Vol 26, pp: 113-147, 1893.
- Garcia, M. E.,W. Szeliga, and R. Bilham, Modeling vertical deformation associated with the 1931 Mach earthquake, Pakistan, Eos Trans. AGU, Vol 87, issue 52, 2006.
- Haq, S. S. B., and D. M. Davis, Oblique con- vergence and the lobate mountain belts of western Pakistan, Geology, 25, 23–26, 1997.
- Howard, A.D., Dietrich, W.E., and Seidl, M.A., Modeling fluvial disintegration on provincial to mainland scales: Journal of Geophysical Research, v. 99, pp. 13 971–13 986, 1994.
- Howard, A.D., Dietrich, W.E., and Seidl, M.A., Modeling fluvial erosion on regional to continental scales: Journal of Geophysical Research, vol 99, pp: 13 971–13 986, 1994.
- I, Waqar. A, et al., “EVALUATING FOCAL MECHANISM OF SEPTEMBER 24, 2013 AWARAN EARTHQUAKE WITH GEOSPATIAL TECHNIQUES”. International Journal of Innovations in Science & Technology, Vol 02 Issue 03: pp 108-124, 2020.
- Jackson, J., and D. McKenzie, Active tectonics of the Alpine-Himalayan Belt between Turkey and Pakistan. Geophysical Journal of the Royal Astronomical Society, Vol 77, issue 1, pp: 185–264, 1984.
- Kazmi, A. H., Active Fault system in Pakistan. In: Farah, A.& DeJong, K. A. (eds.) Geodynamics of Pakistan. Geology Survey of Pakistan, Queta, pp: 333-340, 1979.
- Lawrence, R. D., R. S. Yeats, S. H. Khan, A. Farah, and K. A. DeJong, Thrust and strike slip fault interaction along the Chaman transform zone, Pakistan, Geol. Soc. London Spec. Publ., Vol 9, pp: 363–370, 1981.
- Lawrence, R. D., Khan, S. H. and Nakata, T., Chaman Fault, Pakistan- Afghanistan. AnnalesTectonicae, Vol 6, pp: 196– 223, 1999.
- Lawrence, R. D., S. H. Khan, and T. Nakata, Chaman fault, Pakistan-Afghanistan, Ann. Tectonicae, Vol 6, pp: 196–223, 1922.
- Lawrence, R. D., S. H. Khan, and T. Nakata, Chaman fault, Pakistan-Afghanistan, Ann. Tectonicae, Vol 6, pp: 196–223, 1992.
- Kazmi, A.H. and Rana, R.A. Tectonic Map of Pakistan, Geological Survey of Pakistan, 1982.
- Lawrence, R .D. and Yeats, R. S. Geological reconnaissance of the Chaman fault in Pakistan. In: Farah. A. &Dejong. K.A. (eds) Geodynamics of Pakistan, 1979.
- Molnar, P., and Tapponnier, P. Cenozoic tectonics of Asia: Effects of a continental collision, Science, Vol 189, issue 4201, pp: 419– 426, 1975.
- Molnar, P., and J. M. Stock, Slowing of India’s convergence with Eurasia since 20 Ma and its im- plications for Tibetan mantle dynamics, Tectonics, Vol 28, 2009.
- Oldhem T. A catalugue of indian earthquakes from the earlieat time to the end of A D 1869. Memoirs of the Geological Survey of India, Vol 19, issue 3, pp: 163-215, 1982.
- Oldham, R. The Cutch (Kutch) earthquake of the 16th june 1819 with the revision of the great earthquake of the 12 june 1897. Memoirs of the Geological Survey of India, vol46, pp: 163- 213, 1926.
- Power, E. O. F., & Subprojects, T. QUETTA ELECTRIC SUPPLY COMPANY FOR AUGMENTATION & EXTENSION OF POWER TRANSFORMER SUBPROJECTS, 2013.
- Quittmeyer, R. C., Farah, A. and Jacob, K. H. The seismicity of Pakistan and the relation to surface faults. In: Farah, A. and Dejong, K. A. (eds.) Geodynamics of Pakistan. Geological Survey of Pakistan, Quetta, pp: 351-358, 1979.
- Szeliga, W. M., Historical and modern seismotectonics of the Indian plate with an emphasis on its western boundary with the Eurasian plate, 2010.
- Szeliga, W., R. Bilham, D. M. Kakar, and S. H. Lodi (2012), Interseismic strain accumulation along thewestern boundary of the Indian subcontinent, J. Geophys. Vol 117, 2012.
- Sarwar, F., Iqbal, S., Qaisar, M., Rehman, A., Akhtar, F., & Raza, S. M. Earthquake Statistics and Earthquake Research Studies in Pakistan, (May), pp: 97–104, 2016.
- Schelling, D., Structural geology of the Bolan block, western Pakistan, Tech. Rep. 5-20885-99, Energy and Geosci. Inst., Univ. of Utah, Salt Lake City, 1999.
- Treloar, P. J., and Coward M. P., Indian plate motion and shape: constraints on the geometry of the Himalayan orogeny. Tectonophysics, Vol 191, pp: 189–198, 1991.


