
Generation of Digital Surface Model (DSM) USING UAV/ QUADCOPTER
Huma Ahmed Hassan1, Syed Amer Mahmood1, Saira Batool2, Areeba Amer4, Mareena Khurshid3, Hina Yaqub1, Sajjad Ali Gill5
1 Department of Space Science University of the Punjab Lahore.
2 Centre for Integrated Mountain Research (CIMR) University of the Punjab Lahore.
3 Department of Geography University of the Punjab Lahore.
4 Wuhan University China.
5 Department of Sports Science University of the Punjab Lahore.v
* Correspondence: Marina Khurshid and Email : marinakhurshid@gmail.com Citation | Hassan.H.A, Mahmood.S.A, Batool.S, Amer.A, Khursheed.M, Yaqub.H. Gill.S.A, ” Generation of Digital Surface Model (DSM) USING UAV/ QUADCOPTER” International Journal of Innovations in Science & Technology, 2020 Vol 2 Issue 3 PP 89-107 Received |Aug 15, 2020; Revised | Sep 11, 2020; Accepted | Sep 13, 2020; Published | Sep 15, 2020. ___________________________________________________________________
Abstract
Satellite imageries are being used as primary source of information due to their vast coverage and high temporal resolution. Unnamed Aerial Vehicle (UAV) is being used these days because of its accuracy, autonomous flights, cost effectiveness and rapid overview of data. UAV provides a fully or partially autonomous image acquiring platform which is devoid of any manned flight controller. In this research Phantom 3 advanced Quadcopter was used for an image acquisition plan for generation of Digital Surface Model (DSM). Two designs were drawn through this workflow for the reconstruction of Department of Space Science and technology in university of Punjab. For the first design 3D quadcopter is hovered at the height of 120 feet (37 meters) which covered an area of 83 x 130 meter, frontal and sidewise overlapping is 80%, and the camera is kept at an angle of 70° for the double grid type pattern. For second mission design a circular flight is taken to obtain images at the height of 27meters with coverage area of (107 x 106) meter, 45° camera angle and 10° circular angle. For reconstruction of urban area, quadcopter is hovered at relatively greater height of 210 feet (64 meters), following the double grid pattern. In order to attain desired GST, the camera is flown at a constant height over the Area of Interest (AOI). The highly overlapped images obtained using Phantom 3, advanced Quadcopter are then processed using Pix4d software for processing of images. Initially, the common points of adjacent images are matched automatically. After matching similar points, additional geographic information of coordinates and z-value of elevation associated with it is generated in 3D space by sparse point cloud. Then a detailed 3D model along the precise geo location is obtained using dense point cloud. A study surface area and its texture are generated using 3D mesh. Finally, a desired 3D surface model is accurately generated containing desired AOI. The results are analyzed using UAV imagery to generate high resolution DSM. DSM for construction of urban area of Department of Space Science was generated at a very high resolution of 3.55cm and 1.8cm respectively. The accuracy of geo locations can be improved by using GPS loggers or by taking the GCPs. It is suggested by many authors that 3D surface model of reconstruction of building is quite accurate geographically and geometrically, after the comparison of bundle block adjustments, Ground Sampling Distance (GSD) value, 3D matching and average point cloud density of DSM. Thus, the 3D surface models are used in parameters, features extraction and estimation of values including depth and elevation values, in texturing, 3D data collection for 3D visualizations, 3D roof tops and building facades and contour maps and orthodox photos. Keywords: DSM, UAV image high resolution, Quadcopter Introduction Imaging system based on Ghost 3 Quadcoptor used to generate DSM, it is an accurate representation of next generation of DJI quadcopters. Its features include a compass, flight controller, barometric, gyroscopic, vision positioning system, GPS, and RTH sight, and a return system that returns the quadcopter to the position from where the flight was started [1]. The quadcopter is accountable for a precise flight even in the absence of GPS signals because of vision positioning system. It has 4480mAh intelligent flight battery which provides maximum flight for 23 minutes. The aircraft has a weight of 1280 grams which also include propellers and battery [2]. A representation is shown in Figure 1.
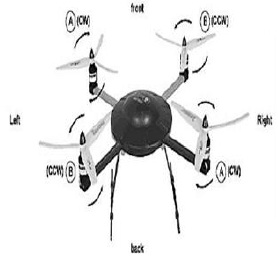
Figure 1: Physical Structure of Quadcopter
Camera and Gimbal The phantom 3 is advanced technology paired with a mini-CMOS camera sensor. This sensor accurately records videos up to 1080p and take images up to 12 megapixels. In order to minimize distortion while camera is capturing views in air, the f/2.8 aperture lens is used with a fixed focal length of 20mm with a field view of 94⁰. The camera has a 6.17 mm × 4.55mm (4032 × 3024 pixels) CCD sensor with image size. The video size 2.7K (2704 x 1524 pixels), but due to small size of pixel, videos are not recommended. The raw photographs are stored in a class 10 compatible Micro SD card with a maximum capacity of 64GB which display telemetry data of a flight and status of aircraft. Certain other variables are automatically recorded in the aircraft’s internal storage [3]. A stable platform is provided by 3axis stabilizing gimbal system to capture constant and clear photographs and videos for a digital coupled camera [4]. Tilt motion ranging from -90⁰ to +30⁰ of the digital camera is controlled by gimbal system. DJI Pilot App DJI is a mobile application especially designed for Phantom 3 Advanced aircraft, [5]. This application controls gimbal, adjust the camera and field, shares photos and videos. This app is recommended for best practice of aircraft. Flight The Phantom 3 Advanced quadcopter can take appropriate images in <10m/s wind speed as it is sensitive in severe weather condition. Its flight is supported usually in open regions which are devoid of any crowd, obstacles, tall trees, high voltage electricity lines, and metallic objects and GPS sensors in sunshine hour [7]. This system isn’t always legitimate close to the polar regions [8]. Flight Planning A number of deliberations are required for mapping and planning of flight. Flight operation is planned either physically or automatically through GPS waypoints. In order to construct a map of a regular flight pattern, the manual controls prove more effective and valuable in self-directed and real time covering missions. Drone mappers usually operate the drone according to their expertise, some operate autonomously and some mappers operate the drone manually. Pilots should have complete knowledge of driving the drone whether physically or automatically. Drone should not move out of line of sight to pilot unless the pilots have particular requirement, enough practice, and authoritarian permission to move apart from line of sight. Drone may show unpredictable behavior due to bad weather conditions, signal interference, GPS hindrance, and other nominal faults. Drone is preferred to fly manually in lower forest canopies and in populated towns. Before beginning, the mission areas should be inspected and fight barriers should be analyzed. Before takeoff, pilot must have the ground survey of the mapped area [9]. Designing the flight orientation One of the major elements of drone mapping is the orientation of a flight rout. Generally, the drone mapping orientations are illustrated as transects and are normally designed in a regular array. Drone generates highly precise map in a flight transect grid by taking images with sufficient overlap. A double grid flight plan is required by 3D surface model to attain all sides elevation of constructed structure which are accurately visible in images. In order to get high quality and more efficient map results some mappers suggest hovering of the drone with different patterns of overlapping at different altitudes within the same area. But a lot of data and storage is required by this process to solve the problems of height difference. While some mappers suggest to maintain invariable altitude for variable attributes of ground. Pilots use software to locate an area to be mapped by the use of polygon and a camera needed for a required height in order to implement a flight plan using grid pattern. The mission plotter after fulfilling all essential requirements calculates GSD, shows the serial transect of waypoints, total pictures, and other useful material. Before launching, the drone operators modify and plan the amount of overlapping, mission elevation, each of shot distance, and other constraints. All the data of mission planning is stored either in computer or in-flight controller of drone and also implemented in field wok [9]. A demonstration of flight control is shown in Figure 2.
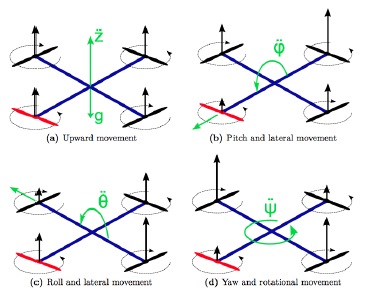
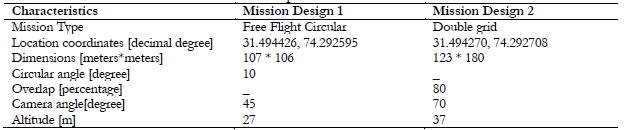
Figure 2: Flight Control of Quadcopter. Recommended Overlapped Percentage In order to ensure an adequate amount of sideward and frontward pictorial overlapping, the drone mission mapping is organized and planned. Overlapping values depend upon the situation such as densely populated areas need more overlapping than planned landscapes. According to the tutorial of Pix4D software, 60 percent sidewise and 75 percent onward overlapping is required. The operator needs to adjust the flying speed by adjusting the space present in each capturing photograph, gap between transects, altitude of mission and by the direction of camera in order to achieve a specific degree of overlapping. The recent mission planning software are more affective as they save time by automatically estimating required parameters. Highly forested zones require higher overlapping. Higher overlapping patterns show that more time and paths for flight are required. Higher overlapping also indicates longer time required for processing, more photographs and increased computer storage for the production of better results [10][11]. Materials and methods Processing Software Software selection depends upon the finance, processing power and the task needed to achieve. A variety of softwares are used for drone mapping according to status of drone. Thus, in this research a well-known image processing software the Pix4D is used which has comparatively simple interface and comprehensible guide. It is the most accurate technique to convert aerial images captured by drone or quadcopter technology into 3D digital surface model, 2D rectified mosaics and point clouds. For specialized aerial mapping applications, it offers a creditable track record ranges. The software is upgraded according to the market demands of drone mapping at the regular intervals of time. Moreover, the professional photography equipment is expensive and has extensive power management requirements. At the time of writing the year 2017, Pix4D priced at 12,500.00 with license and one year lease of $5,000.00. 1st Project The area under study is 3D modeling of Space Science Department located in University of Punjab Quaid e Azam Campus Lahore. The Department of Space Science was established in 1985 with 31°29'39.7"N 74°17'33.3"E coordinates. A specific plan of image acquisition is required for the reconstruction of 3D building of study area. In this research, two missions are proposed which have double and circular grid types. Mission design 1 The circular type mission freely took photographs for the first mission design of Space Science Department (31.494426°, 74.292595°) at 27 meters high covering the area of 107 x 106meter. The drone flies at the camera angle of 45° around the building and 10° circular angle around the building in circular type mission. In order to ensure the desired GSD, the camera need to attain a constant altitude and complete the track of flight over AOI as shown in Figure 3
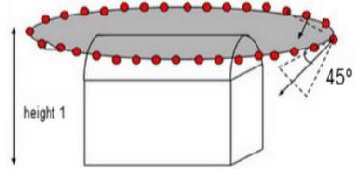
Figure 3: image acquisition plan for circular grid Mission design 2 In second stage of reconstruction, department of Space Science (31.494270°, 74.2925708°) at 37meters height covering an area of 83 x 130 meter in such a way that all sides of building (north, west, south, east) can be clearly seen on the images taken by double grid pattern. It is recommended that the frontal overlap should be 80 percent with respect to flight orientation and the sidewise overlap between the flying track should be 80 percent with 70° camera angle. The images are recommended to be taken at an angle of 70º and not in the direction of nadir in order to clearly see the sides of building [10] as in Figure 4.

Figure 4: Double grid image acquisition plan
Table 1 illustrates the specifications of both missions.
2nd Project A new policy was designed for the Sui Gas Society in Lahore located at higher altitude for the comparative analysis. The mission design contained double grid type pattern for the reconstruction of 3D urban areas at the altitude of 64 meters in order to clearly see all the sides (north, west, south, east) of buildings in the images. It is recommended that the frontal overlap should be 80 percent with respect to flight orientation and the sidewise overlap between the flying track should be 80 percent with 70° camera angle. The images are recommended to be taken at an angle of 70º and not in the direction of nadir in order to clearly see the sides of building. a) Computing the GSD for a given Flight Height The distance between two adjacent pixels is measured from air in order to obtain GSD on the surface of earth. GSD value determines the quality and accuracy of Orth mosaic. This value is inversely proportional to height of flight it decreases as the height increases. Results and Discussions Analyzing the Quality Reports According to the quality report, summaries of both projects are given below in table:
Table 2: Summary Report of Both Projects
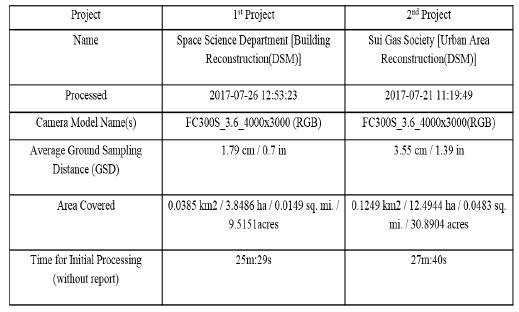
The name, processing time, camera model and its name, 2D area covered by the project and the average GSD is given in the summary report of this research paper. About 1.60cm GSD is estimated during the first project while the actual average GSD is 1.79cm which are quite close to each other. However, the GSD value in the 2nd project is 3.55cm, the GSD value is increased due to the greater 2D area and increased altitude of 2nd project. Following table describes the quality check report of both projects.
Table 3: Quality Check Report of Both Projects
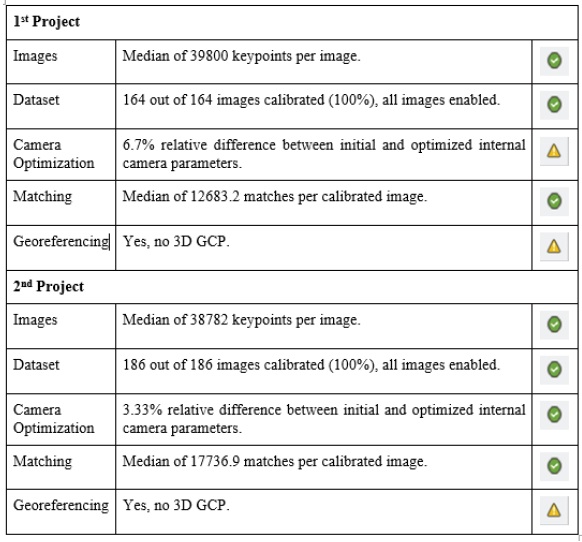
The quality check report indicates that all checks are green if the report is good. The yellow check of camera optimization during the 1st project 5-20 percent initial contrast increase, it is tolerated according to the situation while the value is 3.33 percent (<5%) in the 2nd project. The Geo referencing check for both projects is yellow because 3D GCPs are not applied externally. The Phantom 3 Advanced system has automatically georeferenced these projects. All the remaining checks are green. The first column of report shows the keypoint median value on every image, the unique points on the images that are identified are the key points. For a green check greater than 10,000 (>10,000) key points from each image should be extracted, in this research therefore the key points 39800 and 38782 have been taken out for both projects respectively. Second column contains total images which are operated in model rebuilding. It also signifies user restricted images. The check shows green when 95 percent or greater images are rectified in one block. The fourth column identifies the medium of matches per calibrated image which is green for more than 1000 (>1'000) matches.
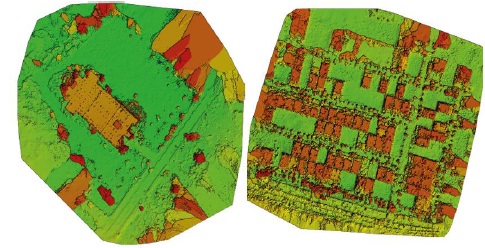
Figure 5: DSM of Space Science Department (Left) and Sui Gas Society (Right) Calibration Details
Table 4: Calibration Details of Both Projects
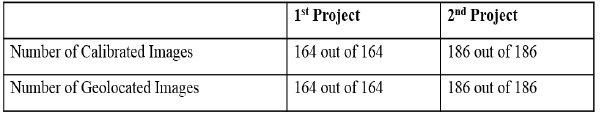
For both projects from the total number of photographs taken during flight are all gauged and enabled for reconstruction model. These photographs are geologically located. Original Image Points
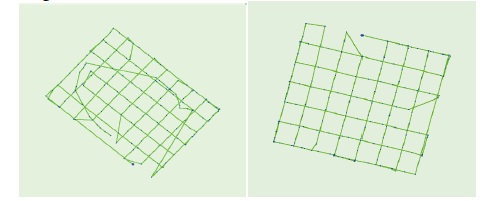
Figure 6: Original Image Points of Space Science Department (Left) and Sui Gas Society (Right) The geological locations of images corresponding to flight are verified by these figures. According to these figures, first project contains circular and double grid mission design while second group comprised of double grid mission. Initial and Calculated GCPs/Tie Points Positions
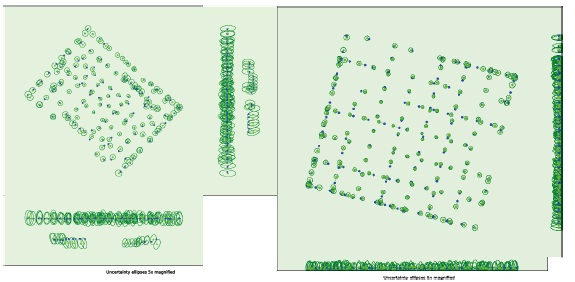
Figure 7: Initial and calculated GCPs/Tie Points Positions of Space Science Department (Left) and Sui Gas Society (Right) The correlation between initial point (blue crosses) between its calculated region (green crosses) in GCPs is calculated at the top of view (XY plane), front-view (XZ plane), and side-view (YZ plane). Dark green light indicates uncertainty as a result of bricks. If you only use landscape photographs, the size of ellipse is same. The resulting image structure is well centered and well angled, while original definition becomes well known.
Table 5: Absolute Camera Points and Orientation Uncertainties
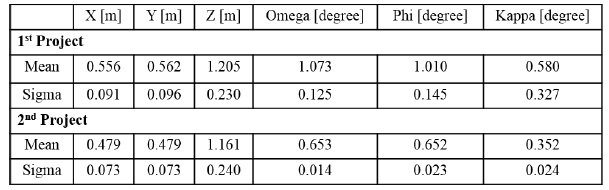
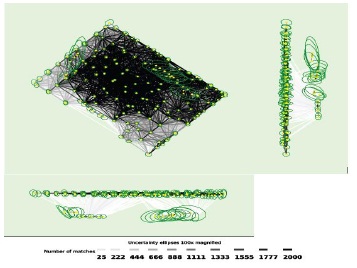
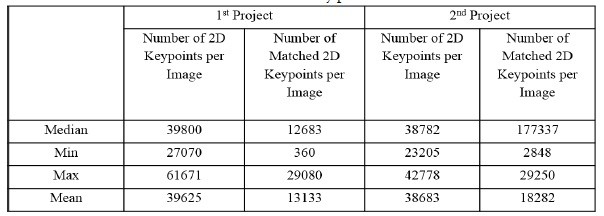
Figure 8: 2D Key points Matches of Space Science Department (Top) and Sui Gas Society (Bottom) The strong association of 2D key points with manual tie points or other images is shown by darker part while the brighter part indicates weak association. The upper figures are more associated than the lower figures and indicated by dark part. Compared to the first image of the first action there is a lot of relevance between the images shown by the darker part than the bottom of second action image. If sufficient connection is shown between the image and the table, there is only one block. If there are several bricks, the color of each block will be different. In a small image, all the small ellipses of uncertainty are of the same size in the program. Depending on the project, 3D points will be awarded in the corresponding table using the 2D key.
Table 6: 2D Key points.
Geolocation Details Absolute Geolocation Variance The calibrated and geolocated images having imprecise input coordinates, are inaccurate images. Optimized locations of these images are tracked by Pix4D mapper software but the given geolocation table do not highlight and mention these values.
Table 7: Absolute Geolocation Variance
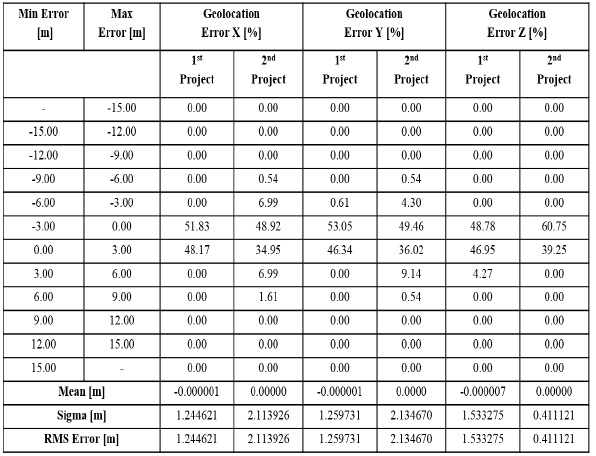
The earliest two columns display the minimum to maximum errors ranging from -1.5 to 1.5 which show the geolocation error. These errors indicate accuracy towards X, Y, Z plane, the next three columns show percentage of images indicating geologically located error in X, Y and Z orientation which is basically the difference between calculated and initial geolocations. The precise direction of first project is not related to the errors in geolocations. Geolocation errors in orientation of X and Y of 2nd project and Z orientation of first projected is illustrated in the give table.
Point Cloud Densification details
Table 8: Processing Options of Point Cloud Densification
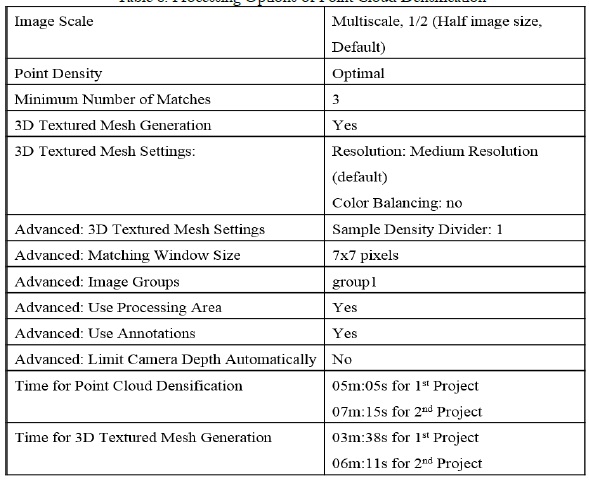
Multiscale image is used in the point cloud classification in which default image size and densified point cloud density is considered optimal. Minimum number of reprojections is considered the minimum number of matches per 3D point on images ranging from 2-6. For this project the minimum value of effective reprojections is 3, 3D textured mesh is generated using by default resolution medium but balancing algorithm is not considered for this generation. Sample density divider having option 1 is used in advanced 3D textured mesh. In order to match the dense points in the photographs, matching window size and 7x 7 pixels size is generally used. One unified point cloud is generated per group of images for making image groups. Point Cloud and Mesh also take into account the used processing area. Camera depth automatically limit the in-point cloud densification. The last columns display time spent on unified point cloud and 3D textured mesh generation for both projects.
Table 9: Results of Point Cloud Densification
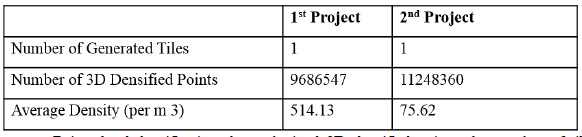
Point cloud densification show obtained 3D densified points, the number of tiles produced, and the average 3D unified points per cubic meter for the project. Results show that the average density is greater for DSM generation and process a greater number of 3D unified points in the 1st project. DSM, Orth mosaic and Index Details
Table 10: Processing Options of DSM, Orthomosaics and Index Details
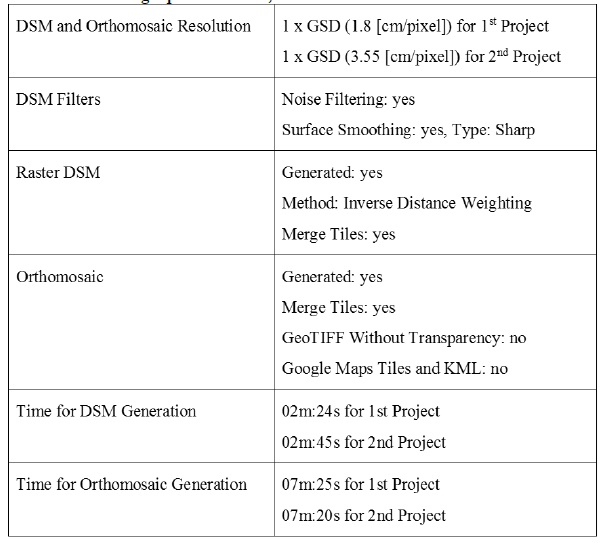
Reconstruction resolution building of Space Science Department is 1.8 [cm/pixels] that is close enough to the calculated GSD value of 1.6 [cm/pixel] and reconstruction resolution of Sui Gas Society urban area is 3.55[cm/pixels]. DSM of urban area reconstruction and Orth mosaic value is given below as a DSM hub, the surface smoothing and noise filters are activated along the sharp smoothing surface. By the use of the inverse distance weighting method, raster DSM is generated and DSM tiles are merged into one file to generate Orth mosaic. Google Maps Tiles, GeoTIFF without Transparency, and KML are not generated in this project. In the last two columns, time is displayed, time spent on both projects for DSM and Orth mosaic Generation.

Figure 9: Orth mosaic and the corresponding DSM Cross-section measurements For fixed DSM sections, it can be concluded that each feature below the section is defined by a particular resolution due to monitoring. The section line description also shows a white wall with the exact location and elevation, GCP can be used to improve the accuracy of geo referencing and geolocation.
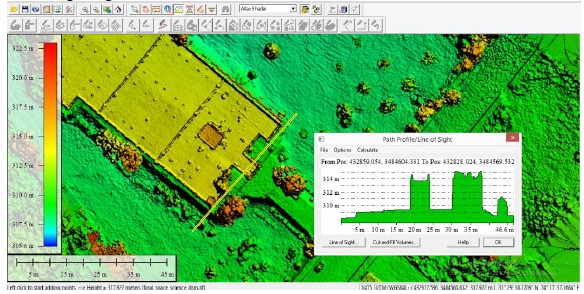
Figure 10. A representation of software
Use of 3D Model and DSM Modeling buildings and tree heights The height values of features on the surface of earth can be characterized by the DSM. The value of surface features is calculated by the distance between the ground level connecting the uppermost points. 2D article is removed by extending the 3D model to the certain height. Different parameters such as height and length, circumference, perimeter and building area measurement under reconstruction can be calculated by using DSM.
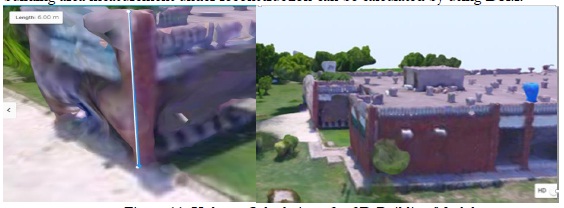
Figure 11: Volume Calculations for 3D Building Model
Trees Trees are large 3D species in forestry sector. The height of the tree is determined by the value of building and its relative value. By Extraction of the 3D wooden texture, the vertical side, and the width of each tree is measured. The following figure shows the vertical and horizontal dimensions of tree and tree size.
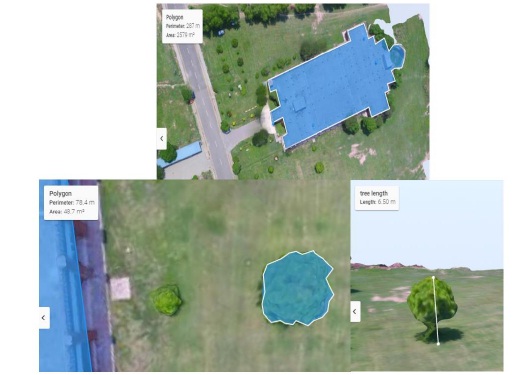
Figure 12: Volume Calculations for 3D Tree.
Representing 3D Buildings and Extracting 3D Roof Tops Previously, the construction of 3D building structures were considered expensive and outside the practical abilities. Detailed 3D information is available by survey of urban areas through high-resolution photogrammetry. The model of building truly displays the geometry of building’s roof. 3D buildings and 3D roofs are displayed in figures given below.
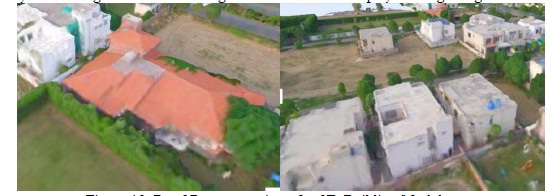
Figure 13: Roof Representations for 3D Building Model Texturing Texturing represents a geometry outlook of reconstruction of a building contains a building sides and rooftop. Tilted and locally street-level images compose the roof geometry. Thus, in texture maps the images are finally repaired, repeated and revised. These textures display a general building style and don’t exactly match to genuine building. This building generation method used to alter the building style and height, and can be utilized in urban planning.

Figure 14 : Texture Representations of Building and Urban Area Reconstructions
Discussions 3D textured model of building of Department of Space Science and Sui northern Gas Society are analyzed geographically and geometrically for building and urban area reconstruction. RMS is the end result produced by bundle adjustment and its value is less than 1 pixel. Reconstruction of urban area and building area by UAV imagery provide a footprint of approximately 1.8 and 3.55cm, both models can be seen with high quality. But 1st model of building reconstruction of Space Science Department has more high resolution than the 2nd model of reconstruction of urban area due to multiple mission design types and low altitude flight. Better image quality is provided by low altitude imagery. Typically, it’s density (per m3) is also more than the 2nd mission design due to more amount of 3D densified points. GCPs can prove useful in improving accuracy of model’s geolocation for better geo-referencing. Conclusions This research shows the design of a UAV designed specifically as databased platform. DSM generation and pre and post processing of UAV imagery is also described in the work plan for flight design. The Phantom 3 Advanced Quadcopter is used to divulge the specifications and flight planning for 3D mapping. In order to obtain uniform and consistence results, required altitude, the direction of flight and patterns of overlapping, GPS sensors and geo referencing methods were applied. The final results of this research display 3D model geographically and geometrically and DSM generation using Phantom 3 Advanced quadcopter imagery for reconstruction of building of Space Science Department and urban area reconstruction of Sui Gas Society at very high resolution of 1.8cm and 3.55cm respectively. Accuracy of geolocation can be improved by taking GCPs. A more highresolution surface model of Space Science Department is obtained because of its low altitude and mission design type required for the acquisition of data through UAV technology. The results of this research shows that 3D roof top of a building and all facades depth and volume calculations and its texture are completely covered by High resolution DSMs and 3D models. UAV technology is cost effective and autonomous and has high potential for the high-resolution DSM generation
References
1. D R, Sowmya & Deepa, P. & K., Venugopal, Remote Sensing Satellite Image Processing Techniques for Image Classification: A Comprehensive Survey. International Journal of Computer Applications, 2017, Vol 161, issue 11, pp: 24-37.
2. Kuenzer, C. and S. Dech: Thermal Infrared Remote Sensing – Sensors, Methods, Applications. Remote Sensing and Digital Image Processing Series, 2013, Vol 17, pp: 572
3. Baumann, p. P. History of remote sensing, satellite imagery, part ii. Retrieved from geo/sat 2, history of remote sensing, (2009)
4. Hassani, Hamid & Mansouri, Anass & Ali, Ahaitouf. Mechanical Modeling, Control and Simulation of a Quadrotor UAV, 2021, pp: 441-449.
5. Harder, C. B. Creating Mirror Worlds; Enabling a new dimension with 3D imagery. In C. B. Harder, The ArcGIS Imagery Book. Redlands, California: Esri Press, 2016.
6. Ajayi, Oluibukun & Salubi, Akporode & Angbas, Alu & Odigure, Mukwedeh.. Generation of accurate digital elevation models from UAV acquired low percentage overlapping images. International Journal of Remote Sensing. 2017, Vol 38, issue 8, pp: 1-22.
7. Lee, Hou-Hsien & Lee, Chang-Jung & Lo, Chih-Ping, Unmanned aerial vehicle and method for controlling the unmanned aerial vehicle, 2013.
8. de Roos, Shannon & Turner, Darren & Lucieer, Arko & Bowman, David. Using Digital Surface Models from UAS Imagery of Fire Damaged Sphagnum Peatlands for Monitoring and Hydrological Restoration. Drones. 2018, Vol 2, issue 4, Pp:45.
9. Greenwood, f. Drones and aerial observation: new technologies for property rights, human rights, and global development a primer. New america: valerie altounian, 2015
10. Lillesand, T. M. REMOTE SENSING AND IMAGE INTERPRET ATION. United States of America: John Wiley & Sons, 2004
11. Leishman, J.G. Principles of Helicopter Aerosynamics. New Yorl, NY: Cambridge University Press, (2000).


