
A Geospatial Analysis of Shishper Glacier Surge-Upper Hunza Gilgit Baltistan
Maham Sajjad1, Faiza Sarwar1*, Sidra-Tul-Ain1
1Department of Geography, University of the Punjab, Lahore, Pakistan
*Corresponding Email: faizasarwar.geog@pu.edu.pk
Citation | Sajjad. M, Sarwar. F, Ain. S. T, “A Geospatial Analysis of Shishper Glacier Surge-Upper Hunza Gilgit Baltistan”. International Journal of Innovations in Science and Technology. Vol 4, Issue 2, 2022, pp:436-449
Received |March 08, 2022; Revised |May 07, 2022; Accepted | May 10, 2022; Published | May 14, 2022.
Glaciers can be an important indicator of climate change. In Pakistan, glaciers are found in the Northern Part of the country. In this study, we have discussed the occurrence of surge velocity, lake formation, and outburst of Shisper Glacier, Hunza, Gilgit, and Baltistan. To conduct this study satellite remote sensing techniques have been used. For this purpose, Sentinel-2 and Landsat 8 have been downloaded for 2015-2019. While to examine the elevation difference ASTER 2000 and SRTM 2014 Digital Elevation Model (DEM) have been downloaded, along with this other remote sensing analyses were applied including temporal change, land cover, and morphometric analysis including indices Normalized Difference Snow Index (NDSI) and Normalized Difference Water Index (NDWI). It has been analyzed that Ice-Dammed Lake formed in November 2018, which is the greatest threat to the study area as it can cause glacial lake outbursts and the volume of the lake is showing a continuous increase from 2018- to 2020. The land cover change indicated that snow area has increased about 35% from 2015 to 2018 along with an increase in debris glacier by about 20%. Whereas, a decrease in vegetation was observed up to 2% in 3 years. This study concludes that snow and clear glacier are enlarged over time. Taking into account our research, our suggestion is obligatory stride should be taken to keep away from the disastrous occurrence in the Shisper glacier.
Keywords: Remote Sensing, Surging, Morphometric Analysis, Ice-Dammed Lake, Normalized Difference Snow Index (NDSI), Normalized difference Water Index (NDWI)
Introduction
The 5th assessment of the IPCC report determines that managing the global climate equipoise glacier plays a decisive part as normal climate meter and also a submissive count of climate change [1]. Since the little ice age ended, the glacier in all parts of the earth has been lessening. [2]. Cause of undefined geographical dissemination 1% of glaciers are cascade type found mostly in polar to the sub-tropical region [3]. These glaciers are also found in continental intramural and highly uplifted mountains for example the high Andes of Argentina and in the Karakoram and Pamir mountain ranges.[4]–[6].
The glacier-like rush type could be in inactive or passive form. An unassertive kind of glacier flows in slow motion during the essential period whereas the erosive form of glacier temporarily flows in the fast movement, while each surging phase extent remains stable.
In the acquiescent phase, the speed of the flow is generally under equal velocity and due to the seasonal changes, variation also occurred. A change in the vertical morphology was detected at the end of the glacier the flow become finite. At the beginning of the main surge, the mini-surge invoke by a wavy surge develops before a year. The surge moved with a high celerity downhill and thickened the ice up the glacier. Between stagnant and flowing ice up and down a vanguard formed because of whole mechanisms. As a result, the main surge of the ice forefront becomes steep from the beginning.
The speed of the glacier may increase by a factor of 10 in the surging period within a year. Due to this movement, the capacity of the storage zone is decreased and then the terrain faces more ice [7]. Crevasse takes place in the ice sheet due to ice flow stress, [8]–[10]. almost six different phases of Surge have been discovered in the Karakoram and other regions. The lower glaciers remain slack in the normal phase, whereas the upper glacier mold forwards. The next one is called pre-surge in which the speed of the glacier increased, while the third phase is called the surge phase in which the cycle of low goes high. In the 4th phase, the surge going thinning and slow down called post-surge. In this phase the level of ice increases and phenomena of crevasses in the ablation zone. Due to supraglacial, the unit of an elixir stays detached in the ablation zone for some drawn-out period [6].
After a heavy flow of ice, the surge creates different features like zigzag esker. In this region, the crevasses are going to squash the ridges, whereas other features are also created in the proglacial settlement when the ice is moved like thrust moraine. When the ice moved, the pressure increased by the thrusting the moraine created. Only 4% of the modern glacier have surged, due to these factors, their distribution is unclear, and not structured[11]. The objective of this study is to compute the surge velocity, lake formation, and outburst of Shisper Glacier, Hunza, Gilgit, Baltistan.
Study Area
Shisper glacier is located near the Hunza valley. The Hassanabad Nala is fed by Mochuhar glacier and Shisper glacier. The location of the study area faces the north edge of Hunza valley and the east side of Butra. The coordinate of the Mochuhar glacier is 36.43°N 74.50°E and 36.40°N 74.61°E of the Shisper glacier. The total area of the study site is 359km2, and the range of the glacier is from 2567m to 7611m above sea level. Since 2018, the glacial mass has been observed increased day by day. Due to this enlargement, the Hassanabad stream is blocked and in the southwest of Hunza district, a lake is formed in Aliabad city [12].
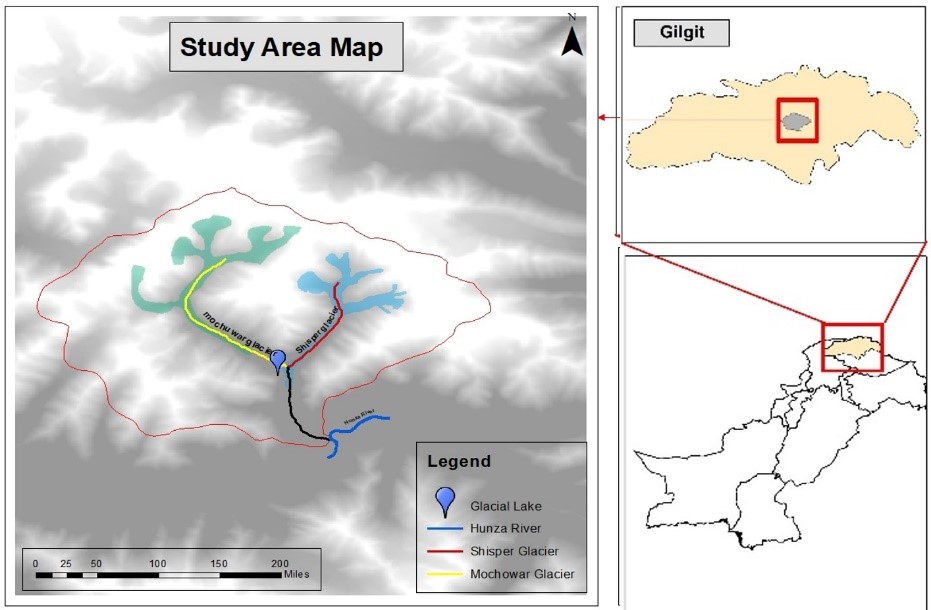
Figure 1. Study Area
Material & Method
To conduct this research, two different satellite imageries have been utilized which include Sentinel-2 and Landsat 8. USGS provides these images freely [12].
.We classified these images into basic two classes including surge and non-surge [13], [14] .
To estimate the volume of glaciers, the following equations were used,
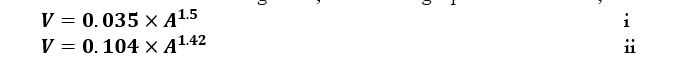
Where A is the area of the lake in m2, and V is the volume of the lake in m3.
The depth of the lake was estimated by using equation iii. By X/N Wang et.al [15] and Lavkush Kumar Patel et al [16] [17] [18], [19].
In equation iv, Qmax indicates the peak discharge of the lake and V indicates the volume of the lake whereas Tw shows the time constant of 1000 s.
The NDSI index was used for the evaluation of the debris cover. OLI/TIRS imagery, NDSI has been calculated by using band 3 and band 6 of Landsat 8.
NDSI=(BAND 3 -BAND 6)/(BAND 3+BAND 6)
Normalized Difference Water Index (NDWI) was used for inspection of the water body
NDWI=(NIR-SWIR)/(NIR+SWIR)
NDWI=(BAND 3-BAND 6)/(BAND 3+BAND 6)
DEM data is used for the analysis of morphometrics. Land cover changes have also been regulated by using the data of 2015 and 2018 Landsat. In this study, the volume of the Shisper glacier and the variation of the different areas are also ascertained.
Results and Discussion:
Elevation difference:
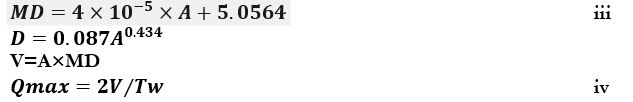
Results show that the elevation of glaciers increased between 2000 and 2014 as in Fig 2. As already noted, the study area is located on the west of the Karakoram where the mass balance budget is negative. To study the elevation difference, two DEMS ASTER DEM (2000) and SRTM DEM (2014) were used due to the inaccessibility of DEM data from different years (figure 2).
The surface of the glacier near the end of its quiescence phase or the starting of the surge was delineated by the ASTER DEM. Whereas a prominent mass loss is portrayed by terminal between 2000 and 2014 indicating the ice of the last surge is expected to remain static. Due to the mass redistribution, the elevation is increased in this area. This distinction is displayed in figure 2. Somewhere in the scope of 10km and 13km, which looks at the lower part of the area where velocities are the fastest, the best ascent increase occurs. The surge stored up to 200 meters of ice in the end part, with somewhere near 100 meters in the last 4 kilometers of the cold mass, explaining the fast turn of events and the way that the end continues to advance long after the surge has wrapped up.
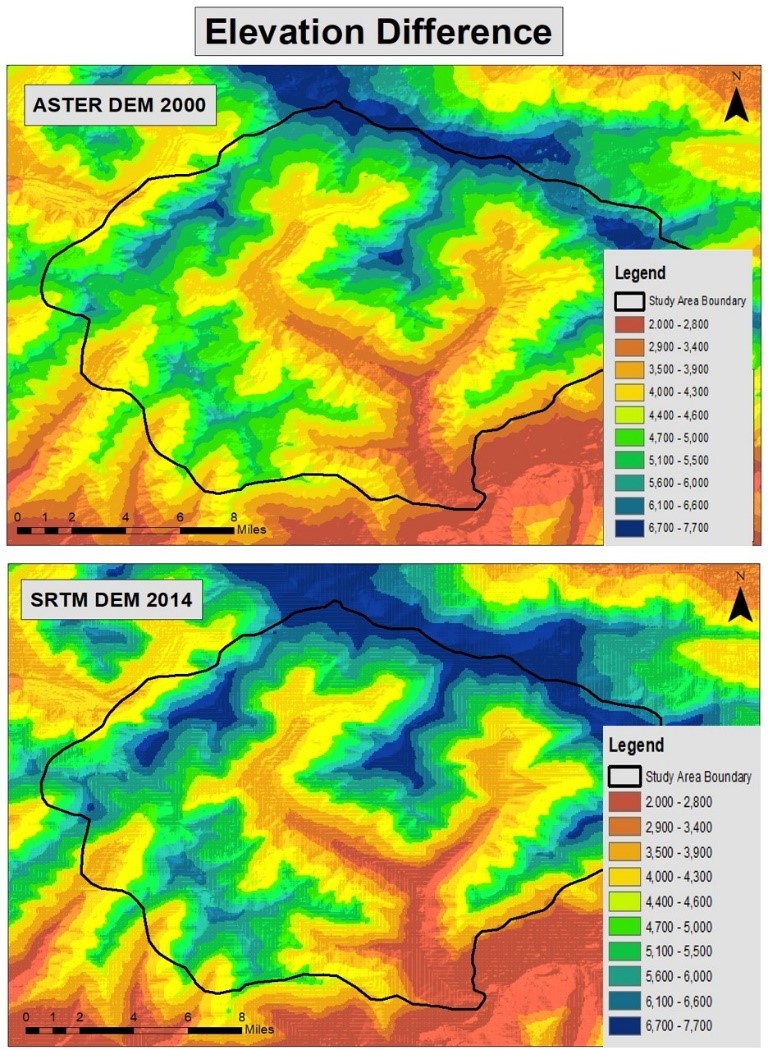
Figure 2. Elevation Difference
Morphometric Analysis:
According to the morphometric analysis, the measurement of the watershed was 359 km2 and the radius was 88 km. the range of the elevation of the watershed was also calculated. The elevation of the south varies from 2000 to 7700 meters above sea level whereas in the north it varies from 4000 to 7700 meters above sea level and covers the area up to 61% (figure 3). Generally, 29% area is covered in the north, northeast, and east, in contrast, 46% area is covered in the south, southeast and southwest, whereas in west, northwest, and north are observed to have 25%. The region of the area from the precarious incline of 48°-78°, 45% of the sharp slant of 28°-47°, and finally 20% of low and normal slant practically 12°-27° is covered 28% watershed.
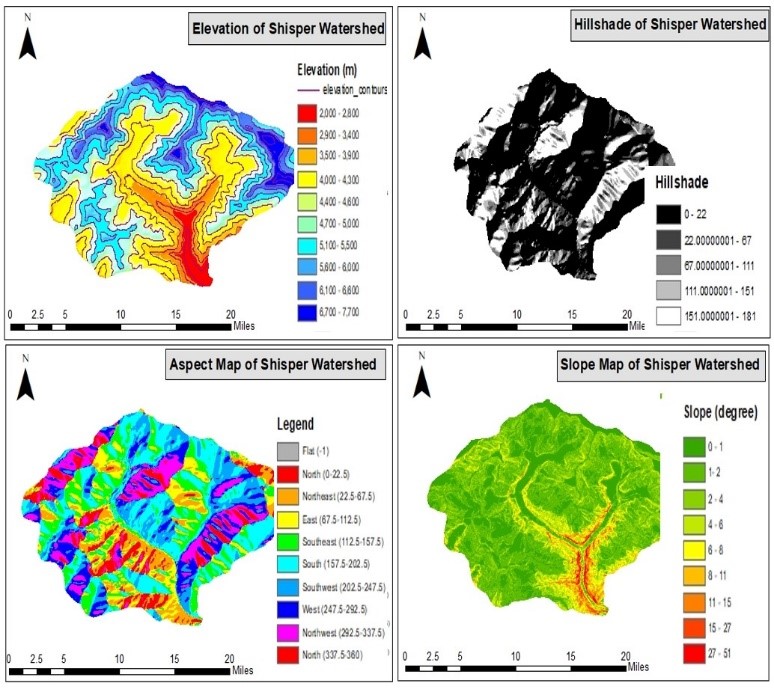
Figure 3. Morphometric Analysis
Land cover change
In figure 4 the land cover has been observed to change between the period 2015 to 2018. About 34% of snow area has been increased, and clear glaciers detect from approximately 97 km2 - 123 km2. The area of debris glaciers is enlarged from 64 km2 to 84 km2 in these 3 years. From 2015 to 2018, the area of vegetation has decreased by 13% to 11% from 44 to 38 km. In July 2018, due to the collision of the shisper glacier with Mochowar Mountain Hassanabad Naalah's faced an entire blockage. A new lake emerged in November 2018, having an area of 0.057 km2. The change is delineated in (figure 4).
|
Land Cover Category |
Land Cover (km2) (2015) |
Land Cover (km2) (2018) |
|
Snow and Clean Glacier |
97 |
123 |
|
Vegetation |
44 |
38 |
|
Barran Land |
144 |
124 |
|
Debris Glacier |
64 |
74 |
|
Total Area |
359 |
359 |
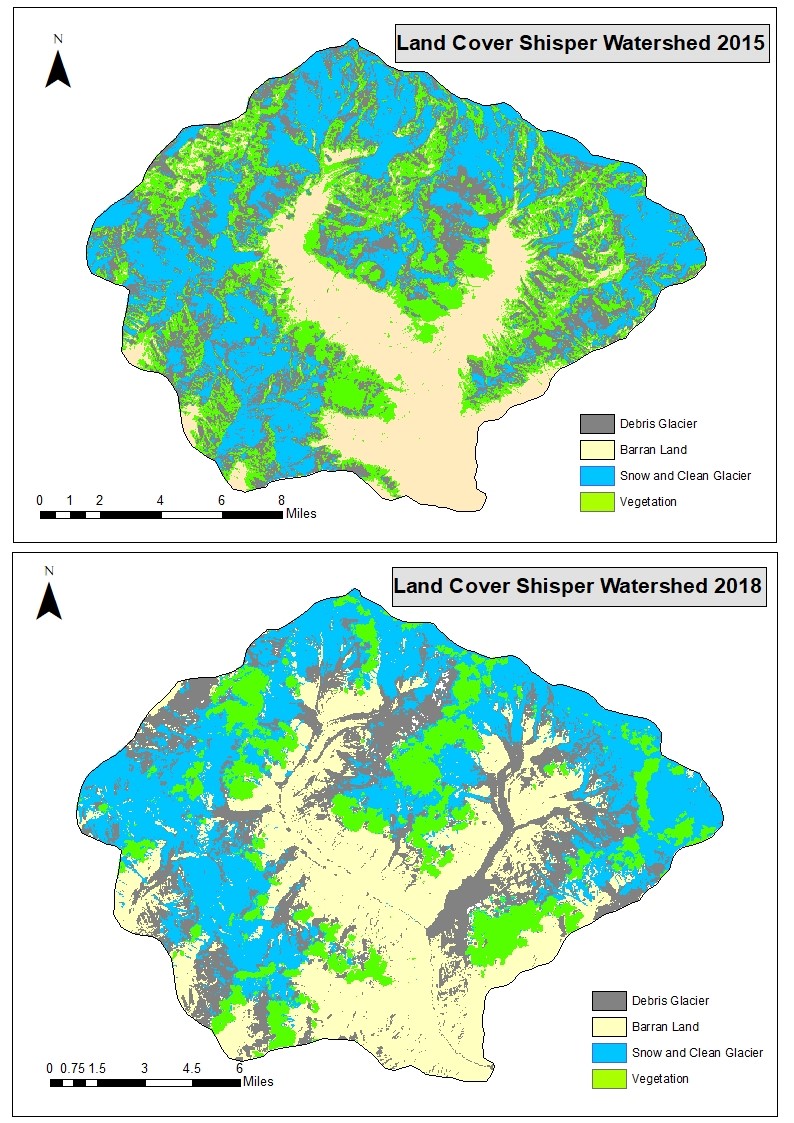
Figure 4 Land cover change
Observed area and volume variations of Shishper Glacier lake:
The lake appeared in the middle of November 2018 and leaked twice in a year, first spelled in June 2019 and second spelled in May 2020. The area of the lake spread was 0.024498 km2, and in June 2019, the spread increased to 0.36 km2. In September 2019 due to the outburst of the flood, the lake began to discharge the water, as a result, the size decreased due to discharge of water to 0.04 km2. The satellite image shows the lake area began to increase in October 2019 and reinstated at a previous maximum size of 0.04 km2 on May 28th, 2020. The volume of the lake was calculated by three equations which are (i), (ii), and (iv), these calculation shows the volume of the lake as 8.9×10⁶ m3, 9.4×10⁶ m3, and approximately 8.5×10⁶ m3, respectively. The volume of the lake and the variations are mapped in figure 6.
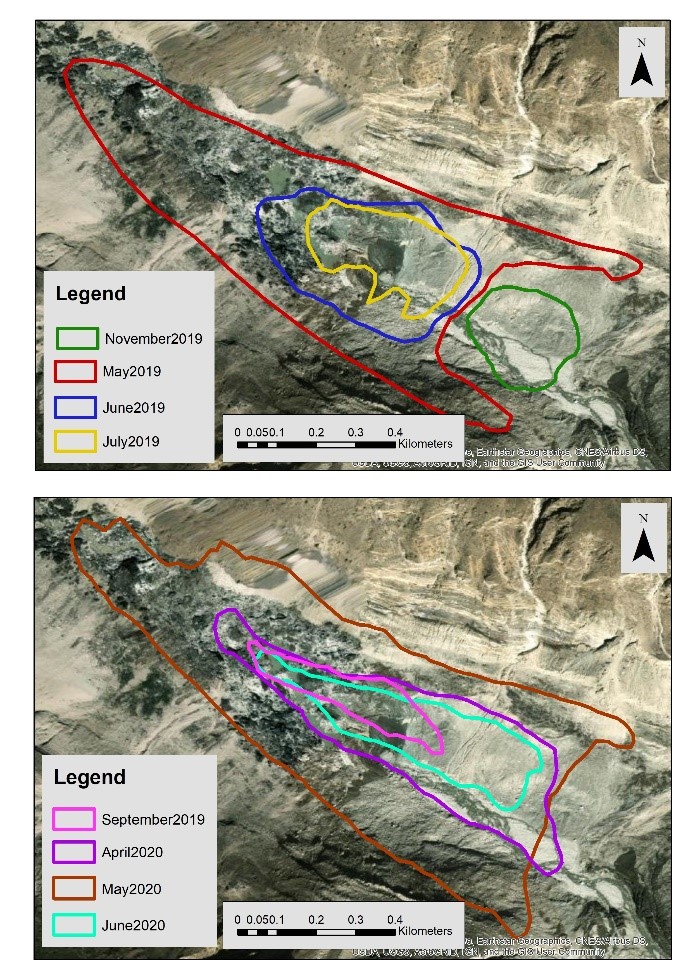
Figure 5. Observed variations in area and volume of Shisper Glacier lake
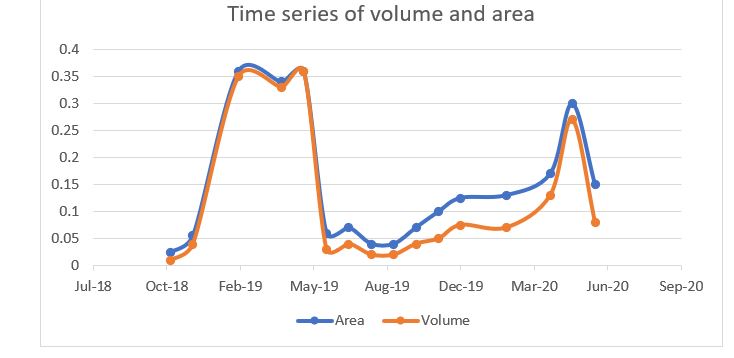
Figure 6. Time series of volume and area
Variations in Shisper Glacier:
In this research, the maneuver of the Shisper and Mochowar glacier is noticed. Both glaciers were in a stable situation in May 2018. Shisper glacier observed considerable gesture in July 2018, due to this fluctuation shisper and Mochowar come into collision and blocked the waterway of Hassanabad Nallah. Until July, the lake has not appeared variation of the Shisper glacier shown in figure 7.
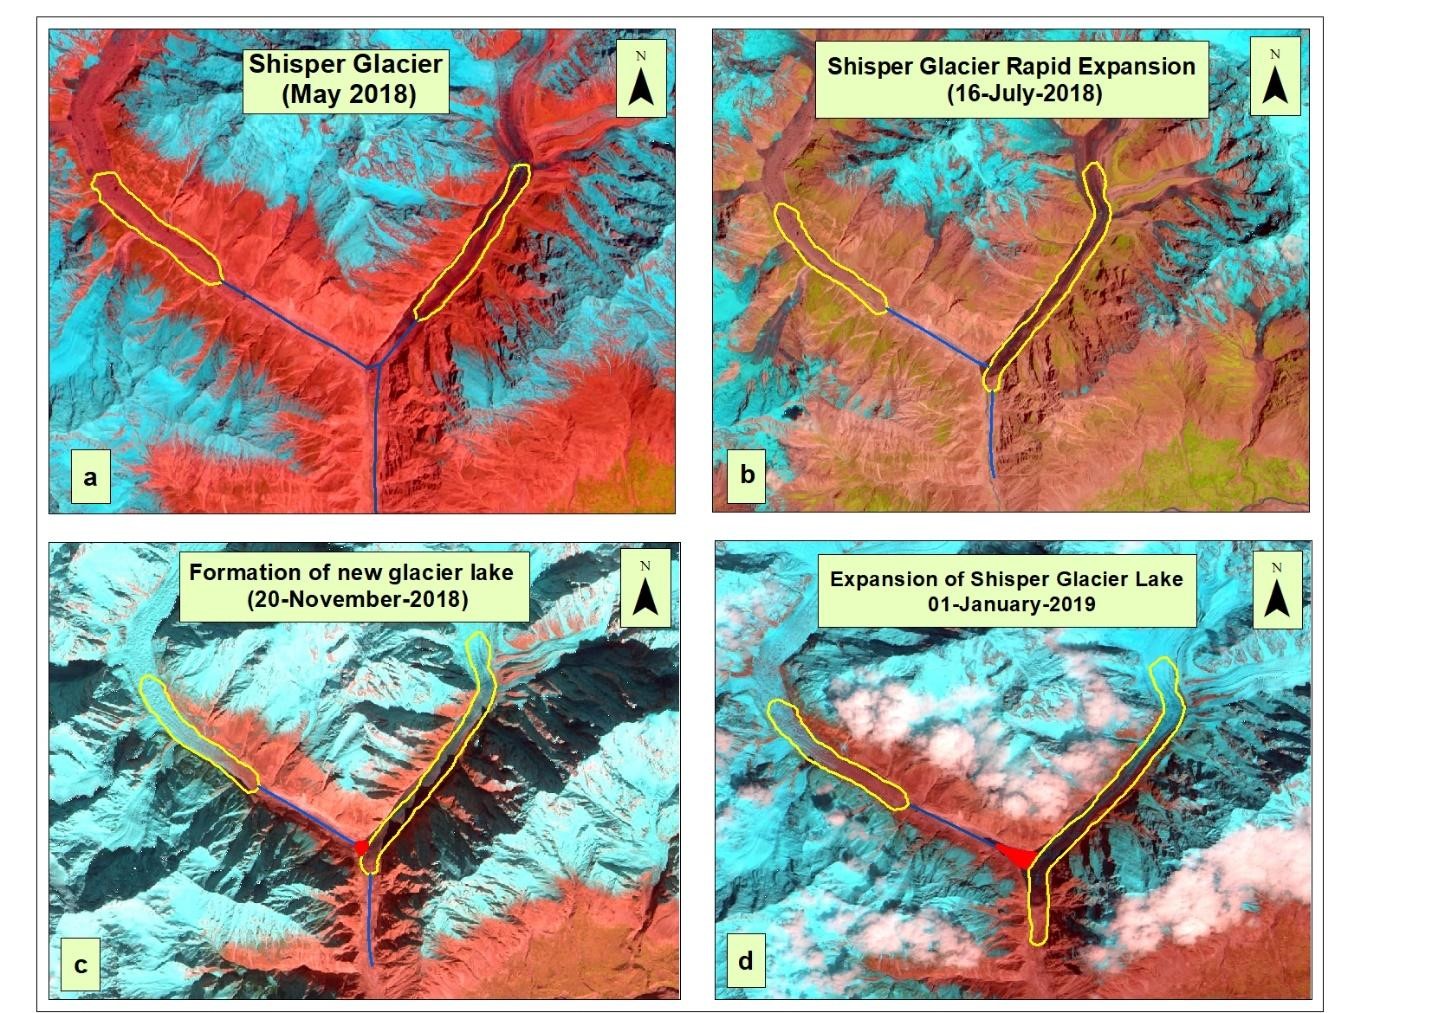
Figure 7 Variations in Shisper Glacier
Ice-dammed Lake depth
By using equation 3,4 the average lake depth was 6.03 m on 24 November 2018. In contrast and the height of 19.5 m and 22.5 m in June. The depth of the lake increased by 8m in September 2018 (Figure 8). Due to the crack, the depth of the lake increased by 15m on 28 May 2020. The flow of the lake was calculated by using this equation.
Qmax=2V/Tw
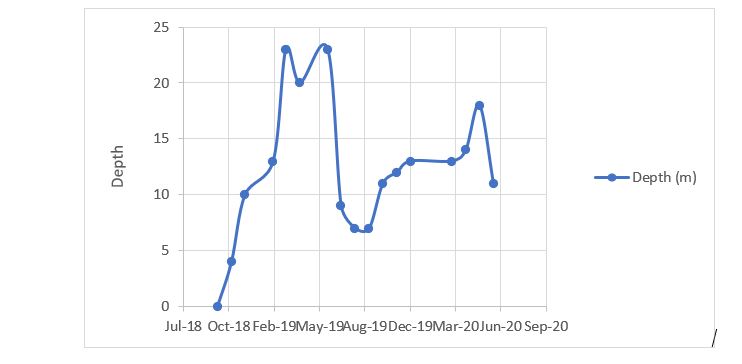
Figure 8. Ice-Dammed Lake Depth
Physical Vulnerabilities
According to analysis, the Shisper Glacial Lake Outburst Flood (GLOF) was receptive by the Hassanabad village. The jeopardy to the area is shown in figure 9.
Results are shows the dangers to regions, settlements, and so forth, This perception shows that the entire town is arranged in a space that may be destroyed by GLOF. Shisper GLOF represents a critical danger to low-lying locales downstream.
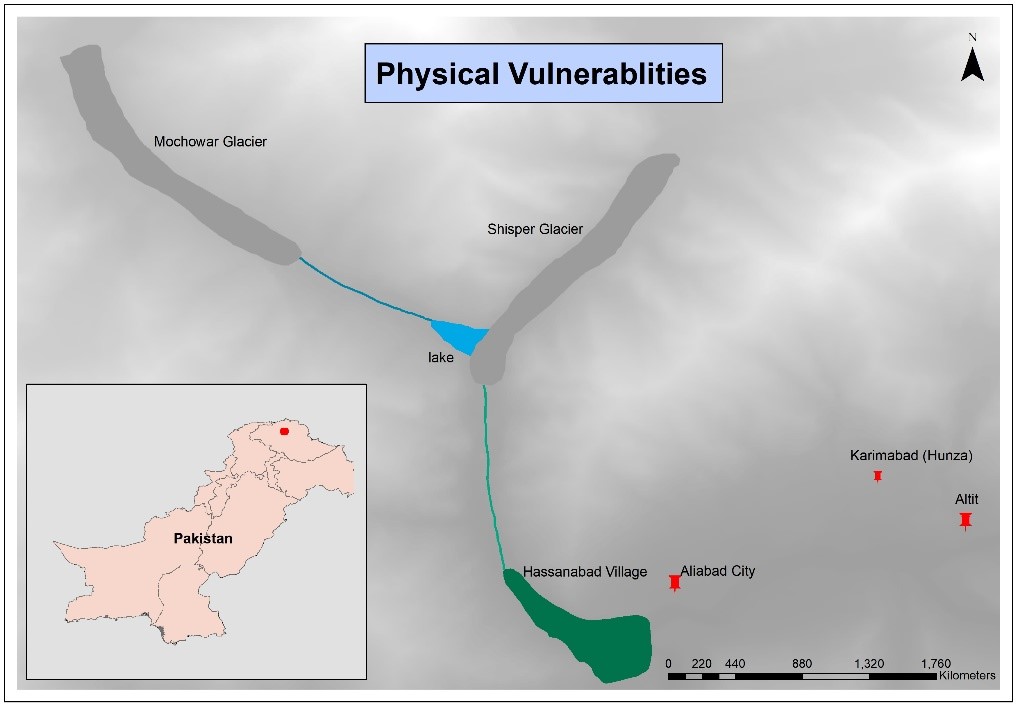
Figure 9. Physical Vulnerabilities
Assessment of Debris Cover
Normalized Difference Snow Index (NDSI) has been performed to monitor snow cover from 2015-to 2018. To estimate snow cover in mountainous river basins NDSI has considered one of the most useful techniques [20]. The globally accepted threshold value of NDSI is 0.4 [21]. Therefore, a clear change has been observed in snow cover in figure 10, where the threshold value showed more snow cover in 2015 as compared to 2018. The NDSI is showing the decline in snow cover in the study area which could be due to an increase in temperature that causes the melting of glaciers.
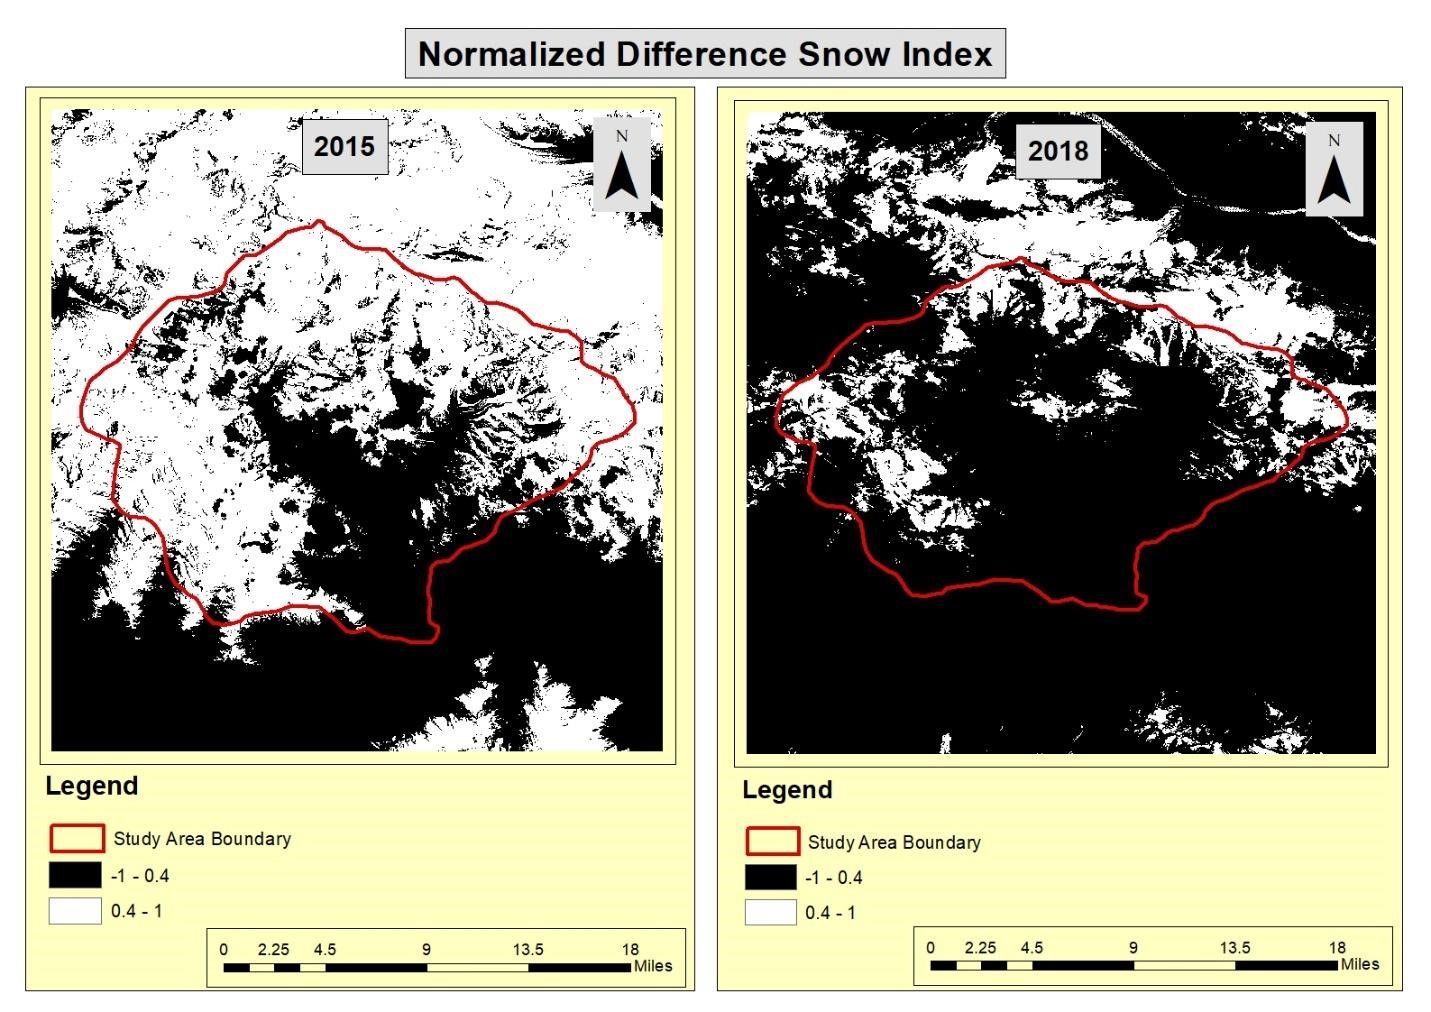
Figure 10. Normalized difference snow index (NDSI)
Waterbody analysis
To delineate water bodies Normalized Difference Water Index has been used. It is considered one of the best indicators to delineate water bodies [20]. For water bodies, NDWI values range from 0.5 and greater than 0.5, while generally, NDWI ranges from 1 to -1[22]. In figure 11, the higher values of NDWI are shown in 2015 than in 2018 in study area.
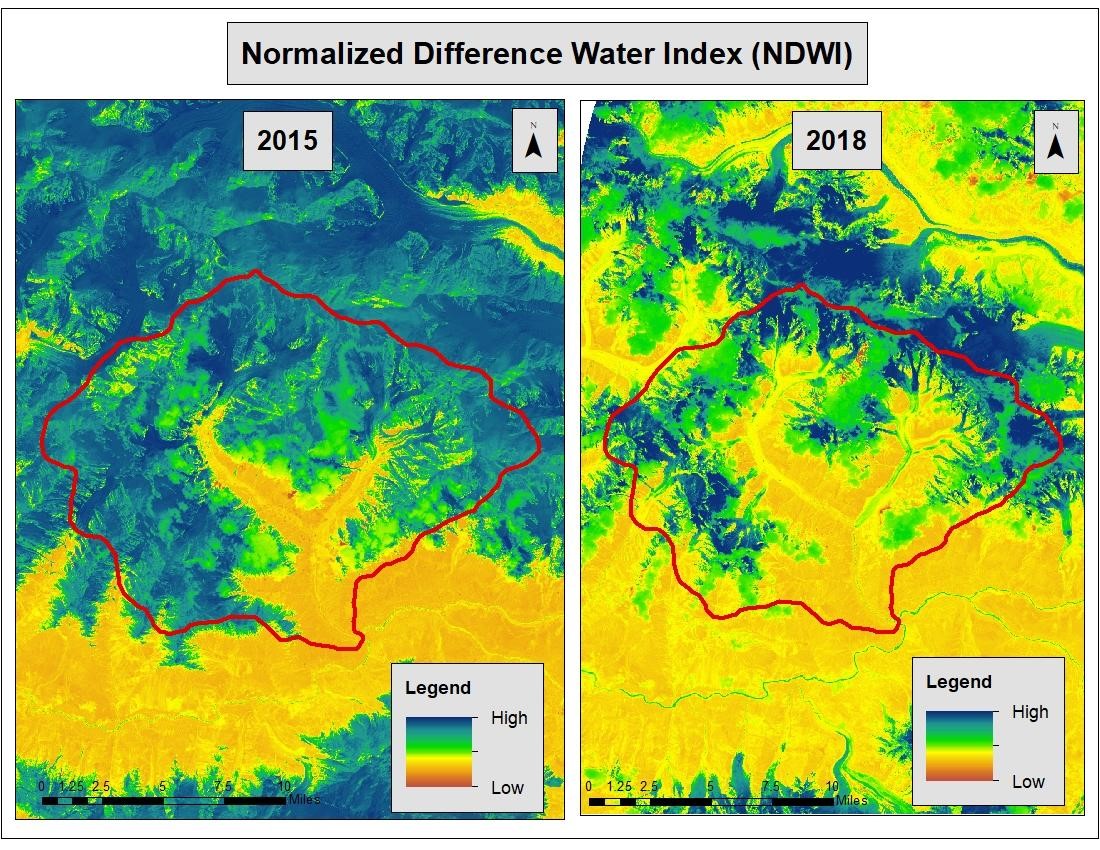
Figure 11. Normalized Difference Water Index (NDWI)
Discussion
The perceptions about the Shisper glacier surge start from the late nineteenth century. As per the literature, Shisper and Mochowar glaciers were feeders of Hassanabad, a solitary previous glacial mass. In 1954, the Hassanabad ice sheet was isolated into two glaciers, Shisper and Mochowar, because of a 7-kilometer retreat [23]. As a result of the flood of the Mochowar glacier in 1972, the glacial masses consolidated [4] Shisper Glacier erupted in 1906, 1972–1976, and 1993–2002, among other times [24]. Whereas in 1972, the Mochuwar Glacier surged [4]. A proglacial stream starting from the Mochuwar glacial mass is impeded by the snout development of Shisper Glacier. This lake arrives at the limit of its area i.e. 0.34 km2 by June 20, 2019. Interestingly on June 22, 2019, this ice-dammed lake depleted. It depleted with a release of 144m3/s. This drainage was a result of the startling abrupt downshift of Shisper Glacier in 2019. The most recent glacier surge started in mid-2018 and proceeds right up to the present day, demonstrating that the glacier has surged at regular intervals since the 1970s [17].
Shisper Glacier's surge shows a colossal terminal development. The end progressed 1.7 kilometers, dislodging up to 200 meters of ice in the end zone and north of 100 meters across a 4-kilometer stretch [25].
The unique development of the glacier might be partitioned into the accompanying examples:
- Until spring 2016, a reliable occasional sign in the two is spring and fall.
- A moderate expansion in the intensity of spring speed-ups in 2016 and 2017.
- In November 2017, the increment started continuously.
- The primary surge's stage 1 is related to the 2018 spring speed-up.
- When a huge lake arises, stage 2 shows an easing back of the surge with a momentary speed increase.
- Phase 3 demonstrates an impressive ascent in speed, which relates to the spring speed-up in 2019.
- The surge stopped toward the finish of June 2019, in time for the lake to exhaust.
The surge ended related to the drainage of the ice sheet dammed lake on June 23, 2019 [17].
A flood is frequently connected with the end of a surge, whether it is brought about by a glacier-dammed lake or sub-glacially put away water [26]-[28]. To support high water pressures during a surge, a broadened seepage framework is required. As a channelized seepage framework creates, it is better prepared to empty the water of the glacier bed, bringing down all out-water pressures and bringing about the end of the surge [29].
The lake drainage that happened on June 23rd, 2019, minorly affected Hassanabad Village, however, it genuinely impacted the Karakoram Highway. The size of anticipated floods can be processed by deciding the relationship between lake drainage and surge-ending flood. Assuming the volume of put away water is added to that of the lake, the peril may be significantly more noteworthy than if just the lake is considered.
As per the morphometric characteristics, the Shisper basin is a high-risk flash flood basin. Shisper watershed has an absolute cover area of approximately 359 km2. Somewhere in the range between 2015 and 2018, there was a significant ascent in snow cover, clean and debris glacial mass, expanding from 161 km2 to 197 km2. The assessment of land cover change shows that the significant ascent in snow and icy mass cover could raise the risk of glacial mass-related calamities. The Shisper glacier flooded in July 2018 and a glacial lake was created, as indicated by remote sensing data. As per the physical vulnerability data, over 80% of residential structures, as well as property, agrarian land, hydroelectric power plant foundation, and the KKH Bridge, are incredibly delicate to GLOF, seriously endangering them.
Conclusion
The study concludes that the glacier elevation increased due to this formation the surge of shisper glaciers creates and generates disturbance for Mochowar glacier water flow. Because of this phenomenon, an ice-dammed lake formed. This mass movement can cause the Karakoram highway and also produce calamity situations for nearby villages or areas. According to the morphometric analysis, the disaster phenomena can occur in the future and can form another lake and produce outburst events, for avoiding these incidents there are some essential recommendations for the solution. We should monitor the natural phenomena which can produce a harmful situation for human beings and infrastructure. An early warning may be alert the people and they can prevent their life and property from damaged.
References
[1] Stocker, T. F., Qin, D., Plattner, G.-K., Tignor, M., Allen, S. K., Boschung, J., Nauels, A., Xia, Y., Bex, V., & Midgley, P. M. (2013) “ Climate Change 2013: The Physical Science Basis — IPCC.” https://www.ipcc.ch/report/ar5/wg1/.
[2] P. W. Leclercq, J. Oerlemans, and J. G. Cogley, “Estimating the Glacier Contribution to Sea-Level Rise for the Period 1800-2005,” Surv. Geophys., vol. 32, no. 4–5, pp. 519–535, Sep. 2011, doi: 10.1007/S10712-011-9121-7/FIGURES/7.
[3] H. Jiskoot, T. Murray, and P. Boyle, “Controls on the distribution of surge-type glaciers in Svalbard,” J. Glaciol., vol. 46, no. 154, pp. 412–422, 2000, doi: 10.3189/172756500781833115.
[4] R. Bhambri, K. Hewitt, P. Kawishwar, and B. Pratap, “Surge-type and surge-modified glaciers in the Karakoram,” Sci. Reports 2017 71, vol. 7, no. 1, pp. 1–14, Nov. 2017, doi: 10.1038/s41598-017-15473-8.
[5] T. Yasuda and M. Furuya, “Dynamics of surge-type glaciers in West Kunlun Shan, Northwestern Tibet,” J. Geophys. Res. Earth Surf., vol. 120, no. 11, pp. 2393–2405, Nov. 2015, doi: 10.1002/2015JF003511.
[6] H. Jiskoot, “Glacier Surging,” Encycl. Earth Sci. Ser., vol. Part 3, pp. 415–428, 2011, doi: 10.1007/978-90-481-2642-2_559.
[7] V. Schytt, “A. [S.] Post and E. R. LaChapelle. Glacier ice. Seattle, The Mountaineers; Seattle and London, University of Washington Press, [c 1971]. [xiv], 110 p., illus. $20, £9.50.,” J. Glaciol., vol. 12, no. 65, pp. 324–325, 1973, doi: 10.3189/S0022143000032147.
[8] J. A. Dowdeswell and T. J. Benham, “A surge of Perseibreen, Svalbard, examined using aerial photography and ASTER high resolution satellite imagery,” Polar Res., vol. 22, no. 2, pp. 373–383, Jan. 2003, doi: 10.3402/POLAR.V22I2.6466.
[9] H. Björnsson, “Hydrological characteristics of the drainage system beneath a surging glacier,” Nat. 1998 3956704, vol. 395, no. 6704, pp. 771–774, Oct. 1998, doi: 10.1038/27384.
[10] C. Rolstad, ] Ostein Amlien, ]on-Ove Hagen, and B. Lunden’, “Visible and near-infrared digital images for determination of ice velocities and surface elevation during a surge on Osbornebreen, a tidewater glacier in Svalbard,” Ann. Glaciol., vol. 24, pp. 255–261, 1997, doi: 10.3189/S026030550001226X.
[11] D. Mansell, A. Luckman, and T. Murray, “Dynamics of tidewater surge-type glaciers in northwest Svalbard,” J. Glaciol., vol. 58, no. 207, pp. 110–118, Feb. 2012, doi: 10.3189/2012JOG11J058.
[12] A. Shah, K. Ali, S. M. Nizami, I. U. Jan, I. Hussain, and F. Begum, “Risk assessment of shishper glacier, hassanabad hunza, north pakistan,” J. Himal. Earth Sci., vol. 52, no. 1, pp. 1–11, 2019.
[13] L. Copland, M. J. Sharp, and J. A. Dowdeswell, “The distribution and flow characteristics of surge-type glaciers in the Canadian High Arctic,” Ann. Glaciol., vol. 36, pp. 73–81, 2003, doi: 10.3189/172756403781816301.
[14] M. J. Roberts, “JÖkulhlaups: A reassessment of floodwater flow through glaciers,” Rev. Geophys., vol. 43, no. 1, pp. 1–21, Mar. 2005, doi: 10.1029/2003RG000147.
[15] X. Wang, S. Liu, W. Guo, X. Yao, Z. Jiang, and Y. Han, “Using Remote Sensing Data to Quantify Changes in Glacial Lakes in the Chinese Himalaya,” https://doi.org/10.1659/MRD-JOURNAL-D-11-00044.1, vol. 32, no. 2, pp. 203–212, May 2012, doi: 10.1659/MRD-JOURNAL-D-11-00044.1.
[16] L. K. Patel, P. Sharma, C. M. Laluraj, M. Thamban, A. Singh, and R. Ravindra, “A geospatial analysis of Samudra Tapu and Gepang Gath glacial lakes in the Chandra Basin, Western Himalaya,” Nat. Hazards, vol. 86, no. 3, pp. 1275–1290, 2017, doi: 10.1007/s11069-017-2743-4.
[17] I. Rashid, U. Majeed, A. Jan, and N. F. Glasser, “The January 2018 to September 2019 surge of Shisper Glacier, Pakistan, detected from remote sensing observations,” Geomorphology, vol. 351, no. January 2018, p. 106957, 2020, doi: 10.1016/j.geomorph.2019.106957.
[18] W. Haeberli, “Frequency and Characteristics of Glacier Floods in the Swiss Alps,” Ann. Glaciol., vol. 4, pp. 85–90, 1983, doi: 10.3189/S0260305500005280.
[19] C. Huggel, A. Kääb, W. Haeberli, P. Teysseire, and F. Paul, “Remote sensing based assessment of hazards from glacier lake outbursts: A case study in the Swiss Alps,” Can. Geotech. J., vol. 39, no. 2, pp. 316–330, 2002, doi: 10.1139/t01-099.
[20] S. Ali, M. J.M. Cheema, M.M. Waqas, M. Waseem, U.K. Awan, and T, Khaliq. Changes in Snow Cover Dynamics over the Indus Basin: Evidences from 2008 to 2018 MODIS NDSI Trend Analysis. Remote Sensing. (12) 2782, 2020, https://doi.org/10.3390/rs12172782.
[21] G. Riggs, D, Hall, and M.O. Roman, VIIRS Snow Cover Algorithm Theoritical Basis document (ATBD), 2015, NASA Goddard Space Flight Center, Greenbelt, Maryland.
[22] D. Yan, C. Huang, N, Ma, and Y. Zhang, Improved Landsat based Water and Snow Indices For extracting Lake and Snow Cover/Glacier in the Tibetan Plateau. Water. 12. 1339, 2020, https://doi.org/10.3390/w12051339.
[23] K.. Paffen, W. Pillewizer, and H . J. Schneider. Forschungen im Hunza-Karakorum: Vorläufiger Bericht über die wissenschaftlichen Arbeiten der Deutsch-Österreichischen Himalaya-Karakorum-Expedition 1954. Erdkunde,1956, https://doi.org/10.3112/erdkunde.1956.01.01
[24] R. Bhambri, C. S. Watson, K. Hewitt, U. K. Haritashya, J. S. Kargel, A. Pratap Shahi, P. Chand, A. Kumar, A. Verma, and H. Govil, The hazardous 2017–2019 surge and river damming by Shispare Glacier, Karakoram. Scientific Reports, 2020, https://doi.org/10.1038/s41598-020-61277-8
[25] T. Murray, T. Strozzi, A. Luckman, H. Jiskoot, and P. Christakos, Is there a single surge mechanism? Contrasts in dynamics between glacier surges in Svalbard and other regions. Journal of Geophysical Research: Solid Earth, 2003, https://doi.org/10.1029/2002jb001906
[26] V. Round, S. Leinss, M. Huss, C. Haemmig, and I. Hajnsek, Surge dynamics and lake outbursts of Kyagar Glacier, Karakoram. The Cryosphere Discussions, 2016, https://doi.org/10.5194/tc-2016-236
[27] J. F. Steiner, P. D. A. Kraaijenbrink, S. G. Jiduc, and W. W. Immerzeel, Brief communication: The Khurdopin glacier surge revisited - Extreme flow velocities and formation of a dammed lake in 2017. In Cryosphere, 2018, https://doi.org/10.5194/tc-12-95-2018
[28] Z. Zhan, Seismic Noise Interferometry Reveals Transverse Drainage Configuration Beneath the Surging Bering Glacier. Geophysical Research Letters, 2019, https://doi.org/10.1029/2019GL082411
[29] D. Mair, Influence of subglacial drainage system evolution on glacier surface motion: Haut Glacier d’Arolla, Switzerland. Journal of Geophysical Research,2002, https://doi.org/10.1029/2001jb000514
|
Copyright © by authors and 50Sea. This work is licensed under Creative Commons Attribution 4.0 International License. |


