
Global temperature variations since pre industrial era
Tariq Noor1, Abdul Baqi, Iqra Nazeer2, Zubair Attique3, Muhammad Shahzad4
1Institute of social and cultural studies, University of Punjab.
2 Department of Zoology, University of Education.
3University of Lahore.
4 Department of Computer Science (PUCIT), University of Punjab
* Correspondence: Tariq Noor1 (noor.tariq36@gmail.com).
Citation | Noor.T, Nazeer.I, Attique. Z, Shahzad. M “Global temperature variations since pre industrial era”. International Journal of Innovations in Science & Technology, Vol 03 Issue 02: pp 67-74, 2021.
Received | April 14, 2021; Revised | May 01, 2021; Accepted | May 06, 2021; Published | May 10, 2021.
Abstract
The global temperature trends are being changed due to anthropogenic activities. The natural ecosystems and human societies are affected by this rapid climate change. These changes are caused by the increasing concentration of carbon dioxide and other green house gases including methane and oxides of nitrogen and sulphur. These changes can be identified using accurate data related to variations in temperature and precipitation. We used MODIS GLOVIS LST V6 global datasets to compute pixel-based temperature and mapped the trends. The considerable warming trends are exhibited by Arctic regions which are warming twice as compared to other parts of world. The largest increase in precipitation occurred in Northern Europe at rate of 12.9mm per decade. The concentration of carbon dioxide has been raised up to 4.14 ppm in atmosphere by December 2020. This increased concentration has raised the global temperature up to 1.2°C since pre industrial era. Remotely sensed datasets provided promising results.
Keywords: Global temperature, Green house gases, pre industrial era, warming trends, carbon dioxide.
Introduction
Globally, it has been observed that the climate change due to anthropogenic activities caused an increase in concentration of atmospheric carbon dioxide (CO2) and other gases. Earth’s climate dramatically since 19th century [1]. This climate change contributed to variations in solar energy patterns received and reflected by earth, temperature trends and glacial ice melting. The global mean surface temperature has been increased up to 1.18°C since 19th centaury estimated by linear trend according to the Fourth Assessment Report of the Intergovernmental Panelon Climate Change (IPCC-AR4) [2,3].
Wave transform method and Mann–Kendall rescaled range method for analysis of periodic properties and global trends of precipitation and air temperature from 1948 to 2010. The results show that about 65.34% of total area exhibits warming trend while 3.18%ofthearea show cooling trends [4]. The considerable warming trends are exhibited by Antarctica and Middle Africa which are 0.32 °C per decade and 0.21°C per decade respectively. The dry and wet trends are shown by 22.01% and 62.26 % respectively. The largest increase in precipitation occurred in Northern Europe at rate of 12.9mm per decade [5].
Various nonparametric and parametric techniques have been devised during past decade in order to detect long term trends of temperature and precipitation in time series. Parametric factors show the probability distribution of random variables while nonparametric tests do not exhibit probability distribution. For the hydro meteorological time series analysis the nonparametric tests are usually encountered [6].
According to global temperature indicator, rise in surface temperature caused the evaporation which triggers rise in precipitation [7]. The precipitation rate changes the climatic conditions by effecting rainfall, timing of snow melt and by shifting wind patterns. Moreover, higher the temperature, greater will be the evaporation which can lead to droughts by decreasing the amount of water on the surface of earth. Precipitation has also increased since 1900 to 2005 over 30° N while precipitation level is decreased in tropics since 1970s [8].
This alarming change in temperature occurred due to increased concentration of Carbon dioxide and other green house gases in atmosphere. These gases include methane, oxides of nitrogen and sulphur which have the ability to trap heat thus raise the temperature of atmosphere [9]. The concentration of these gases is rising 250 times faster due to anthropogenic activities rather than their natural resources. The concentration of carbon dioxide increased up to 40% after the evolution of industries. The concentration increased from 280 to 415 ppm from 1850 to 2019 [10].
Natural ecosystems as well as human localities have been affected considerably by climate change. The climate change detection requires accurate information regarding the space-time distribution of temperature and precipitation. Global increase in temperature triggers expansion of forest fires, deserts and heat waves [11]. The warming of Arctic region resulted in the loss of Arctic ice, glacial retreat and rise of sea level. Global rise in temperature also triggered extreme weather conditions and storms due to increased rate of precipitation [12].
During the year 2018, nearly 52 billion tons of green house gases has been added to atmosphere via anthropogenic activities. Among these gases, 72% carbon dioxide was emitted, methane contributed 19%, nitrous oxide was addedup to 6% while fluorinated gases contributed 3%. Burning of fossil fuels, industrial processes, electricity production and deforestation contributed to the concentration of carbon dioxide in atmosphere [13].
Global variation in temperature has affected the environment adversely, for increasing wind speed, rainfall and typhoons in Asian regions. In Antarctica, the sea level is rising due to melting of glaciers and ice caps leading to temperature expansion [14].
The main purpose of this research was to examine the temporal expansion of heat island with respect to equator. It also aims at appraising the aftermath of dramatic increase of atmospheric gases globally.
Material and Methods
The datasets used in this research include MODIS GLOVIS LST V6, downloaded from earth explorer website (https://earthexplorer.usgs.gov/) for the years from 2000 to 2020. Each dataset is comprised of pixel-based temperature values. The reflectance of each pixel was converted to temperature using the following formula,
Temperature = (Irradiance * 0.02)-273
We obtained the concentration of various gases including (CO2, NO2 and CH4) from GIOVAANI for the years from 2000 to 2020. These concentrations are helpful to understand, how atmospheric gases contribute in trapping of reflected heat which caused global warming.
Results and Discussions.
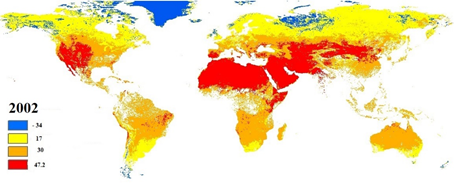
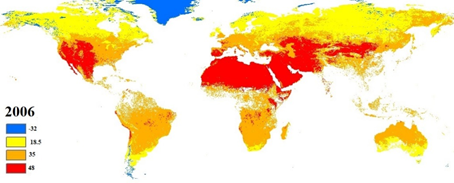
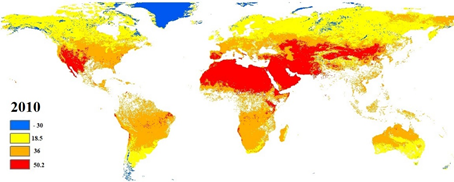
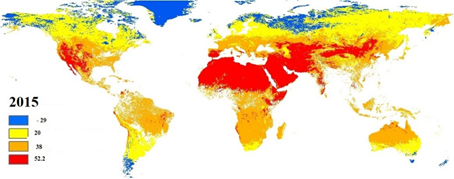
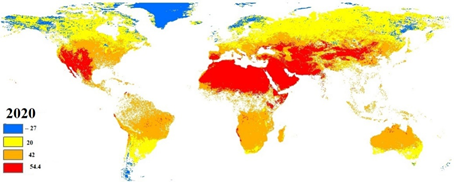
The temporal change in temperature from 2000 to 2020 is mapped in Figure 1 as below,
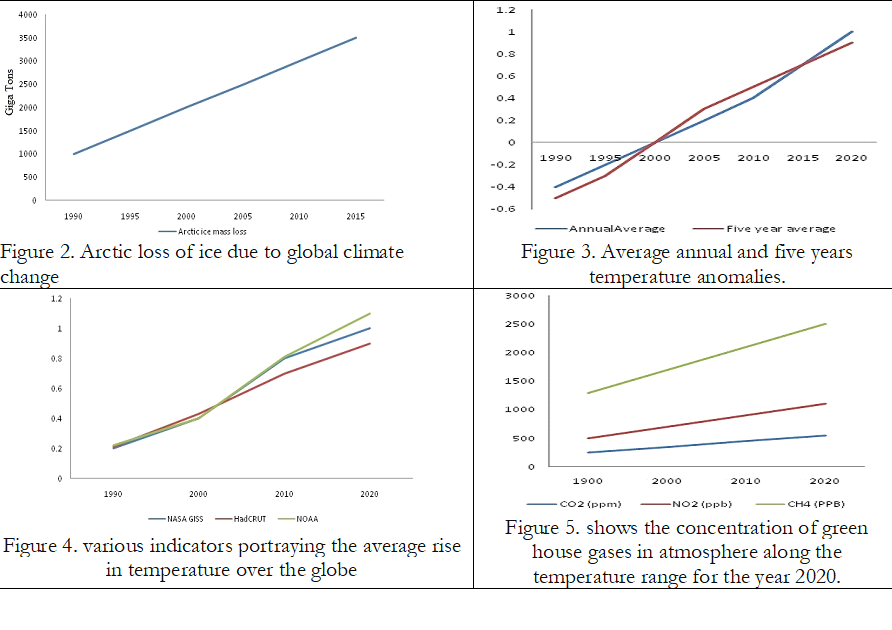
The temperature rise is not uniform globally but according to Annual Climate Report of NOAA, since 1880 the temperature has been increased at the rate of 0.08°C per decade. The temperature in Arctic regions of world has increased three times faster than other parts of the world. Due to this warming trend, the Arctic ice is decreasing at the rate of 13% per decade. The Arctic region has been warmed twice as compared to other parts of word over last 30 years in a process of Arctic amplification. Arctic oceans absorb more heat leading to more warming of the region. Figure 2 shows the loss of ice mass due to global warming.
Global temperature has been increasing for decades but the years 2014-2018 were considered the hottest years of decade since 1980. Annual and five-year temperature anomalies are shown in Figure 3. These years face 1°C rise in temperature as compared to the previous years. According to NASA, the year 2018 was the fourth warmest year since 1980. The average global temperature rose up to 0.83°C higher than the mean temperature in the year 1980. This warming caused melting of glaciers and polar snow which raised water level in sea which contributed to floods, droughts and long-lasting forest fires.
According to the NASA, HadCRUT and NOAA, the temperature of the year 2020 raised up to 1.2°C as compared to the temperature of pre-industrial area (1880). Figure 5 shows the global temperature range for the year 2020. This alarming rise in temperature is due to increase in concentration of carbon dioxide in atmosphere.
The concentration of carbon dioxide has been raised up to 4.14 ppm in atmosphere by December 2020. The increase in concentration of CO2 is a leading cause of global warming. The Figure 5 shows the rise in concentration of greenhouse gases in atmosphere.
The figure 5 shows that the concentration of CO2, NO2 and CH4 has increased significantly since evolution of industries, where the concentration of CO2 increased from 280ppm to 415 ppm by the year 2020, while the concentration of methane has increased up to 2000ppb by the year 2020. For instance, methane and oxides of nitrogen and Sulphur have been increased to an alarming level since the evolution of industries in the world. The more the concentration of greenhouse gases, more heat will be trapped causing a global rise in temperature and increasing the precipitation and trends of evaporation. Figure 6 shows the global trend of precipitation globally.
Figure 6: Global precipitation trend (mm)
Figure 1. shows that the fluctuations in global temperature are 0.93 ± 0.07 °C from the years 2009-2020. The temperature of surface of Earth is rising nearly 0.2 °C per decade. The temperature of the year 2020 has increased up to 1.2°C as compared to the temperature of pre industrial area (1880). Thus, due to larger heat capacity of water oceans has trapped 90% of the solar energy. However, the oceanic circulation in Arctic region has been disrupted due to the rapid ice and glacier melting.
Conclusion
The climate is affected by both natural and anthropogenic factors but since 19th centaury human activities have affected the temperature trend over a global scale. During the year 2018 nearly 52 billion tons of green house gases has been added to atmosphere via anthropogenic activities. The concentration of carbon dioxide has been raised up to 4.14 ppm in atmosphere by December 2020. Thus, the increased concentration of carbon dioxide and other green house gases have raised the temperature of earth to an alarming level.Temperature rise has resulted in melting of glaciers, increased sea level, flood outbursts and longer wild fires.
References
- Abghari,H.,Tabari,,&Talaee, P.H.(2013).Riverflowtrends in the west of Iran during the past 40 years: impact of precipitation variability. Global and Planetary Change, 101, 52–60.
- Alexander,V.,Zhang,X.,Peterson,T.C.,Caesar,J.,Gleason, B.,Tank,A.M.G.K.,etal.(2006).Globalobservedchanges in daily climate extremes of temperature andprecipitation. JournalofGeophysicalResearch,111,D05109.
- Ambenje,,etal.(2007).InS.Solomon,D.Qin,M.Manning,Z. Chen,M.Marquis,K.B.Averyt, M.Tignor,&H.L.Miller (Eds.), IPCC, 2007: climate change 2007: the scientific basis.ContributionofworkinggroupItothefourthassess- ment report of the inter-governmental panel on climate change(p.243).Cambridge:CambridgeUniversityPress.
- Westerhold et. al., "An astronomically dated record of Earth’s climate and its predictability over the last 66 million years," Science vol. 369 (11 Sept. 2020), 1383-1387.
- "Scientific Consensus: Earth's Climate is Warming". Climate Change: Vital Signs of the Planet. NASA JPL. Archivedfrom the original on 28 March 2020. Retrieved 29 March 2020.; Gleick, 7 January 2017.
- "The State of the Global Climate 2020". World Meteorological Organization. 14 January 2021. Retrieved 3 March 2021.
- PCC, 2013b: Summary for Policymakers. In: Climate Change 2013: The Physical Science Basis. Contribution of Working Group I to the Fifth Assessment Report of the Intergovernmental Panel on Climate Change [Stocker, T.F., D. Qin, G.K. Plattner, M. Tignor, S.K. Allen, J. Boschung, A. Nauels, Y. Xia, V. Bex, and P.M. Midgley (eds.)]. Cambridge University Press, Cambridge, United Kingdom and New York, NY, USA, pp. 3–29.
- IPCC, 2012a: Summary for Policymakers. In: Managing the Risks of Extreme Events and Disasters to Advance Climate Change Adaptation [Field, C.B., V.R. Barros, T.F. Stocker, D. Qin, D.J. Dokken, K.L. Ebi, M.D. Mastrandrea, K.J. Mach, G.-K. Plattner, S.K. Allen, M. Tignor, and P.M. Midgley (eds.)]. Cambridge University Press, Cambridge, United Kingdom and New York, NY, USA, pp. 3–21.
- IPCC, 2014a: Summary for Policymakers. In: Climate Change 2014: Impacts, Adaptation, and Vulnerability. Part A: Global and Sectoral Aspects. Contribution of Working Group II to the Fifth Assessment Report of the Intergovernmental Panel on Climate Change [Field, C.B., V.R. Barros, D.J. Dokken, K.J. Mach, M.D. Mastrandrea, T.E. Bilir, M. Chatterjee, K.L. Ebi, Y.O. Estrada, R.C. Genova, B. Girma, E.S. Kissel, A.N. Levy, S. MacCracken, P.R. Mastrandrea, and L.L. White (eds.)]. Cambridge University Press, Cambridge, United Kingdom and New York, NY, USA, pp. 1–32.
- Mysiak, J., S. Surminski, A. Thieken, R. Mechler, and J. Aerts, 2016: Brief communication: Sendai framework for disaster risk reduction – Success or warning sign for Paris? Natural Hazards and Earth System Sciences, 16(10), 2189–2193, doi:5194/nhess-16-2189-2016.
- IPCC, 2012a: Summary for Policymakers. In: Managing the Risks of Extreme Events and Disasters to Advance Climate Change Adaptation [Field, C.B., V.R. Barros, T.F. Stocker, D. Qin, D.J. Dokken, K.L. Ebi, M.D. Mastrandrea, K.J. Mach, G.-K. Plattner, S.K. Allen, M. Tignor, and P.M. Midgley (eds.)]. Cambridge University Press, Cambridge, United Kingdom and New York, NY, USA, pp. 3–21.
- Albert, S. et al., 2017: Heading for the hills: climate-driven community relocations in the Solomon Islands and Alaska provide insight for a 1.5°C future. Regional Environmental Change, 1–12,
- IPCC, 2014a: Summary for Policymakers. In: Climate Change 2014: Impacts, Adaptation, and Vulnerability. Part A: Global and Sectoral Aspects. Contribution of Working Group II to the Fifth Assessment Report of the Intergovernmental Panel on Climate Change [Field, C.B., V.R. Barros, D.J. Dokken, K.J. Mach, M.D. Mastrandrea, T.E. Bilir, M. Chatterjee, K.L. Ebi, Y.O. Estrada, R.C. Genova, B. Girma, E.S. Kissel, A.N. Levy, S. MacCracken, P.R. Mastrandrea, and L.L. White (eds.)]. Cambridge University Press, Cambridge, United Kingdom and New York, NY, USA, pp. 1–32.
- Dryzek, J.S., 2016: Institutions for the Anthropocene: Governance in a Changing Earth System. British Journal of Political Science, 46(04), 937–956.
- Pattberg, P. and F. Zelli (eds.), 2016: Environmental politics and governance in the Anthropocene: Institutions andlegitimacy in a complex world. Routledge, London, UK, 268 pp


