
Health Implications of Arsenic and Qualitative Deterioration of drinking Water from Underground Water Supply Lines of Lahore, Pakistan
Hammad Mehmood1, Rana Waqar Aslam2*, Allauddin Kakar3, Waqas Abbas5, Kanwal Javid4, Muhammad Burhan Khalid5, Muhammad Hussain Tahir6
1 NIPCONS, National University of Science and Technology, Islamabad. Pakistan
2 State Key Laboratory of Information Engineering in Surveying, Mapping and Remote Sensing (LIESMARS), Wuhan University, Wuhan 430079, China.
3 COMSATS University, Islamabad (Abbottabad Campus), Pakistan.
4 Department of Geography, Government College University, Lahore 54000. Pakistan.
5 Punjab University College of Information & Technology, University of the Punjab, Lahore.
6 Department of Geography, University of the Punjab, Lahore 54000. Pakistan.
* Corresponding Author’s Rana Waqar Aslam Email: ranawaqaraslam@whu.edu.cn).
Citation | Mehmood. H, Aslam. R. W, Kakar. A, Abbas. W, Javid. K, Khalid. M. B, Tahir. M. H, Health Implications of Arsenic and Qualitative Deterioration of drinking Water from Underground Water Supply Lines of Lahore, Pakistan. International Journal of Innovations in Science and Technology, Vol 4, Issue 1, pp: 78-93, 2022.
Received | Dec 13, 2021; Revised | Jan 24, 2022; Accepted | Jan 26, 2022; Published | Feb 4, 2022.
Abstract.
The study is a comparative analysis of water quality among two variant areas of Lahore. There are several problems regarding drinking water facilities. Drinkable water can be contaminated due to various reasons. Thus, the study highlights infrastructural causes (material of pipes and outdated pipes) of water contamination. Wall City and Gulberg are the study areas of this research. Gulberg area is far much better in various terms as compared to the wall city. Under this study, four parameters were selected for water quality pH, Total dissolved solids, E.coli and Arsenic. There were 13 water samples collected from each study area by random sampling. Samples were tested on the latest footing in this field. All results validate the problematic statement and highlight severe health effects. The results of these four parameters were far above the water quality standards declared by World Health Organization. Causes of these severe results include the outdated water pipes that are being laid down for the past several decades, for example Wall City area, etc. Results also depict low values in the Gulberg area which is recently developed as compared to the wall city. The comparative study also attests problem statement of the study.
Keywords: Water Quality, Water Contamination, pH, Total Dissolved Solids, E. coli, Arsenic, Wall City, Gulberg, Lahore, GIS.
INTRODUCTION
Human need for water is inevitable for life and social prosperity. Safe water supply is the prime priority for the health security of the population [1]. Clean drinking water, and the adequate supplies are important to reduce mortality, morbidity and to improve the economic development in developing countries [2, 3]. Therefore, the risk to human health through drinking water consumption is an important aspect to investigate [4]. Despite the country's status as a developing nation, population of Pakistan is experiencing water shortages due to mismanagement in water supply. By natural or man-made means, the presence of heavy metals and arsenic in water have devastating effects on human health. As a major natural pollutant, arsenic is now a constant threat to millions of people throughout the world.
Arsenic is a carcinogenic pollutant, and its toxicity depends upon the amount of ingestion, the body's immunity, and the duration of exposure [5]. Arsenic enters the human body through multiple paths. However, oral ingestion, especially by drinking water, is a pioneer source of human exposure [6]. International Agency for Research on Cancer (IARC) declared arsenic a cause of lung, bladder and urinary caver and 20 % of population in Punjab Pakistan is exposed to arsenic through drinking water. According to a recent estimate, about 748 million people have lacked access to better drinking water since 2012. Diarrheal disorders (such as cholera), and liver damage are the result of high amount of exposure to microbes [7]. Rural areas account for the majority of those without access to any type of sanitary facility [8].
In recent years, E.coli O157:H7 has emerged as a new pathogen associated with food- and water-borne illness. In contrast to the vast majority of strains of E. coli, this one produces toxins that can cause serious diseases and even death. Severe bloody diarrhea, non-bloody diarrhea, and stomach cramps are all common symptoms of infection [9].
Pakistan Council of Research in Water Resources (PCRWR) launched National Water Quality Monitoring Program (NWQMP) to monitor the water quality [10][11], analyzed the water quality of different areas in Lahore and identified that the water was highly contaminated. The study associated this contamination with the industrial waste discharge and leakage of old supply pipes. Another study in Lahore analyzed the physiochemical and biological characteristics of water and found the drinking water unsafe [12, 13].
Mild steel, cast ductile iron, concrete asbestos cement, polyvinyl chloride (PVC) and high-density polyethylene (HDPE), pipes used in distribution networks of water. In Lahore, the Water and Sanitation Agency (WASA) is the only provider of the water supply and managing sewerage. After 1976, Lahore Development Authority (LDA) formed a permanent water supply and sanitation division. Water supply lines in two Lahore neighborhoods, Wall City and Gulberg, were examined for their possible impact on the quality of drinking water and human exposure [14].
Research measured the effects of drinking water and studied cases of breast cancer in Cape Cod, Massachusetts due to the consumption of polluted water. The data from the study indicates that water contamination poses a health risk over 50 years. In this analysis, GIS modeling methods were employed to classify and highlight the risk regions. The study concluded that women are at high risk because of the ingestion of polluted water [15].
A new study addresses the quality of groundwater based on the quality of the recharged water, inland water and atmospheric precipitation. Groundwater quality is just as critical as that of the water quantity. The quality of groundwater is therefore very necessary to be regulated and to ensure that these resources are used for various purposes in a reliable, sustainable and healthier manners. Suitable management strategies to protect groundwater resources are developed [16].
There are many issues in the developing countries, and one of them is the health crisis. Waterborne pathogens have been addressed in this article [17]. The paper focused mainly on the issue in developing areas all around the world. The most significant feature of this study was that it emphasizes water-related diseases and various methods of therapy from Greek to modern times. Many diseases such as diarrhea and hepatitis are discussed in this article [18].
Another study was conducted in Lahore to investigate the water quality in Lahore. Around 33 samples from different parts of Lahore were used for this analysis. A few samples from the source (tube wells) and four samples from the Lahore Canal were collected. The results of this study indicate that the shallow aquifer of Lahore city has become highly polluted due to the intrusion of sewage water [19].
This study highlights the efficiency of groundwater in Lahore, Pakistan, and the suitability for the domestic applications to access groundwater. Six parameters were considered to conduct this study. The pH, hardness, and conductivity were analyzed before and after the monsoon period to check the quality of various parameters for each collected sample [20, 21, 22].
The water quality in and around Lahore Metropolitan region [23] was assessed using three different areas used for different purposes, namely, residential, commercial, and industrial land. By using a basic random sampling method, 29 sites were chosen for this study. WASA tube wells were used during collection of samples [24]. The sample locations were based on ensuring that the selected land has dense population [25]. The objectives of this study are as below,
- Mapping the parameters that influence drinking water quality.
- Statistical analysis of drinking water quality impact on health
- To determine the physiochemical conduct of drinking water quality in Lahore.
Material and Methods
Investigation site. The targeted area for the study site was the Walled City and the Gulberg. Both study areas reflect different histories, cultures, social, economic and life patterns. Ground surveys were conducted for collection of samples and GPS points for the location site.
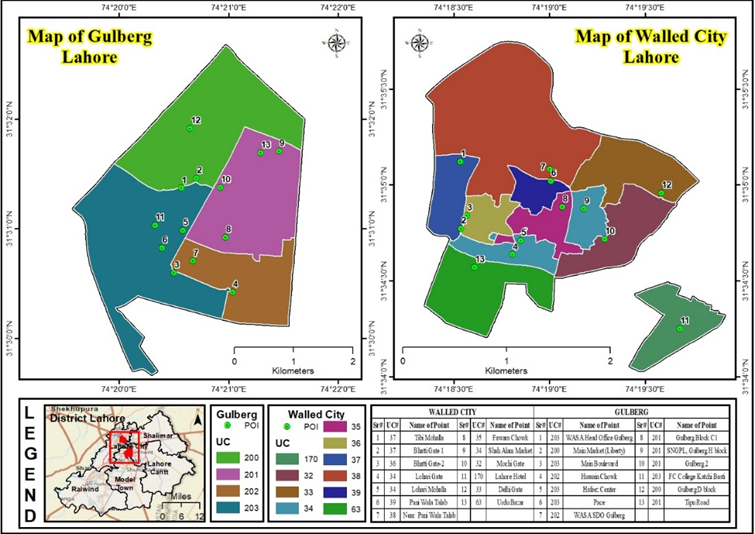
Figure 1. Union council boundary of study area.
Sample Collection.
Field survey was conducted for collection of water samples in both areas. Sterilized blue caped 0.5-liter bottles were used to collect samples, then the samples were sent to laboratory. Overall, 26 samples were collected 13 from each area. All samples were collected for pH, Total Dissolved Solids (TDS), E.coli and Arsenic among water samples. GPS (Garmin nuvi 205 3.5-Inch Portable GPS Navigator) survey was also organized to locate the sample site and Arc GIS was used to prepare maps of pipe networking. Figure1: Shows sampling locations.
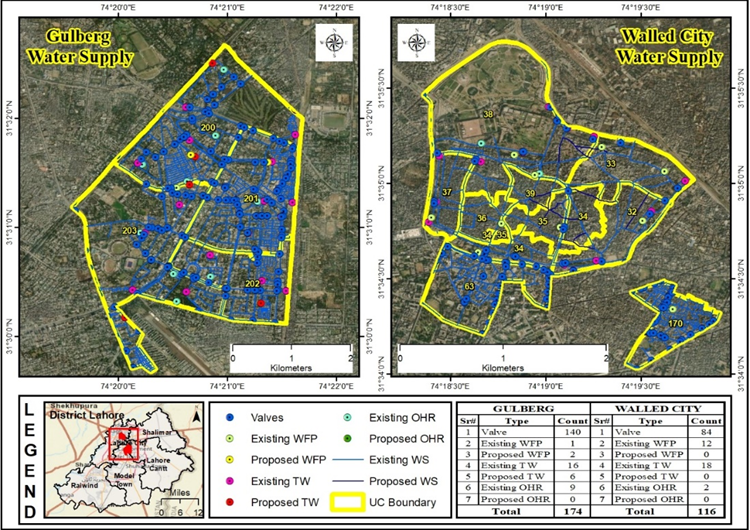
Figure 2. Water supply lines in study area.
Sample Treatment and instrumentation.
The first step was to immerse the glassware in 5 percent nitric acid for 24 hours. Using Whatmann No. 1 filter paper, the samples of water were filtered and subsequently stored at a temperature of 0 to 4°C. A digital pH meter was used to measure the pH of the samples (Hanna Instruments, USA). Samples of drinking water were analyzed using a TB1000 digital turbid metre from the United States. Samples of water were tested for arsenic using an Atomic Absorption Spectrophotometer (Shimadzu Corporation AA 7000). To ensure precision, the calibration line method was used in conjunction with the best possible analytical conditions [26][45][46].
Digitizing of Water Supply Lines. Water supply lines were digitized using Arc GIS 10.5 The total length of water supply pipes in Data Ganj Baksh town was calculated 1303.7 km. In this town, 78% of pipes were made of asbestos cement, 18.9 % of iron, 2.1 % of PVC and 0.8 % HDPE pipes. This information was collected from WASA Lahore then georeferenced and Digitized as shown in figure 2.
Exposure Assessment. Exposure assessment method is appended below: -
Ingestion Parameters
The ingestion parameters were reviewed in the EPA Exposure Factors Handbook [27][47]. The book mentioned the ingestion rate of 1.5 l/day.
Body Weight
The average body weight of 60kg was taken just like in other surveys.
Toxicity Parameters
There is an Arsenic toxicity reference dose for dermatological (hyperpigmentation and keratosis), which is 0.0003 mg/kg/day RfD [28][48]. A standard reference level of 10 g/L of arsenic in drinking water was used to evaluate the levels of arsenic in water [29][35].
Chronic Daily Intake
For the determination of chronic daily intake at first stage beverages consumption rate was found by dietary intake questionnaire. The data of beverages consumption was then combined with average concentration of benzene in beverages. Then it was divided by average body weight. The following equation best illustrates the daily exposure. This equation was modified from [30] [31] [32].
ADD = C × IR × ED × EF / BW × AT ---------------------------------------------------- (1)
ADD = average daily dose was expressed in mg/kg/day. Where C is the expected concentration as in water (mg/L), IR = water ingestion rate of 1.5 L/day on average and ED = daily exposure duration (42 years) and EF = exposure frequency (365 days/year), BW = body weight (60 kg) [33] and AT = average age time (21,900 days) [34][36].
Average lifetime Cancer Risk
Lifetime cancer risk associated with ingestion exposure is calculated using the following equation [35].
CR = ADD × CSF ------------------------------------------------------------------------------- (2)
Where, R is the probability of excess lifetime cancer (or simply risk), ADD is the average daily dose (mg/kg/d), and where CSF is the cancer slope factor as of 1.5 mg/kg/day [35][37].
Margin of Exposure (MoE) Calculation
A “margin of exposure” is the reciprocal of Hazard Quotient. It was calculated by dividing, the Point of Departure (PoD), already found out from animal NTP bioassays to the human exposure estimate. This result in a margin between these two doses and that margin facilitate the decision maker. A MoE was calculated by dividing POD, HB, RfD, or LED10 or some other toxicological point of departure by the average chronic daily intake.
MoE = RfD /ADD ------------------------------------------------------------------------------ (3)
Health benchmarks (HB) and ADD are the most important factors in calculating the MoE. For the most part, RfDs are established by regulatory authorities or international organizations. At 0.0003 mg/kg/day, Arsenic's RfD is used as hyperpigmentation and keratosis in the skin, respectively [28]. It is common to develop a second measure like the ADD for each assessment individually [31]. Using this method, risk assessors can see how far actual or predicted exposures are close or away from the levels that are thought to cause harm. The bigger the MoE, the less will be the concern regarding the exposure to that particular chemical.
Results. Table 1 and 2 are showing sampling areas, EC, pH, TDS and concentration of arsenic in Wall City and Gulberg area of Lahore.
Table 1. Samples of EC, pH, TDS & Arsenic in Wall City.
|
Sr#. |
Area |
Parameter E.C (umho/cm) |
pH |
Parameter TDS (mg/l) |
Arsenic Concentration (µg/L) |
|
International Standard (Values) |
150 -500 (umho/cm) |
6.5 to 8.5 |
500 (mg/l) |
10 (µg/L) |
|
|
1 |
Tibi Mohalla |
666 |
7.6 |
745 |
18.0731 |
|
2 |
Bhatti Gate 1 |
671 |
7 |
730 |
23.1631 |
|
3 |
Bhatti Gate-2 |
507 |
7.7 |
712 |
15.5231 |
|
4 |
Lohari Gate |
513 |
7.3 |
723 |
12.6137 |
|
5 |
Lohari Mohalla |
603 |
7.8 |
2260 |
13.0731 |
|
6 |
Pani Wala Talab |
521 |
7.7 |
2130 |
13.8321 |
|
7 |
Near Pani Wala Talab |
692 |
7.9 |
2110 |
14.3712 |
|
8 |
Fawara Chowk |
682 |
7.4 |
790 |
15.3121 |
|
9 |
Shah Alam Market |
538 |
7.2 |
925 |
14.9738 |
|
10 |
Mochi Gate |
645 |
7.8 |
756 |
24.7596 |
|
11 |
Lahore Hotel |
686 |
7.8 |
815 |
23.1742 |
|
12 |
Delhi Gate |
575 |
7.5 |
2120 |
25.7565 |
|
13 |
Urdu Bazar |
547 |
7.9 |
841 |
15.9885 |
Table 2. Samples of EC, pH, TDS & Arsenic in Gulberg.
|
Sr# |
Area |
Parameter E.C (umho/cm) |
pH |
Parameter TDS (mg/l) |
Arsenic Concentration (µg/L) |
|
International Standard (Values) |
150 -500 (umho/cm) |
6.5 to 8.5 |
500 (mg/l) |
10 (µg/L) |
|
|
1 |
WASA Head Office Gulberg |
538 |
7.1 |
665 |
14.7321 |
|
2 |
Main Market (Liberty) |
502 |
7.5 |
670 |
8.0714 |
|
3 |
Main Boulevard |
612 |
7.2 |
630 |
16.712 |
|
4 |
Hussain Chowk |
714 |
7.1 |
870 |
14.8121 |
|
5 |
Hafeez Center |
703 |
7 |
810 |
16.4121 |
|
6 |
Pace |
618 |
7.3 |
865 |
14.9758 |
|
7 |
Wasa SDO Gulberg |
536 |
7 |
918 |
14.4521 |
|
8 |
Gulberg Block C1 |
699 |
7 |
841 |
13.6521 |
|
9 |
SNGPL, Gulberg H block |
712 |
7.3 |
725 |
12.8921 |
|
10 |
Gulberg 2 |
547 |
7.9 |
841 |
15.9885 |
|
11 |
FC College Katchi Basti |
602 |
7.2 |
912 |
14.2121 |
|
12 |
Gulberg D block |
701 |
7.5 |
789 |
15.1012 |
|
13 |
Tipu Road |
703 |
7.3 |
815 |
13.101 |
EC Concentration.
Electrolyte ions concentration in the water is determined by electrical conductivity. Although, it doesn't determine the concentration of specific ions but the more the EC, the more will be the ionic concentration. The result of EC Concentration is shown on the map given below.
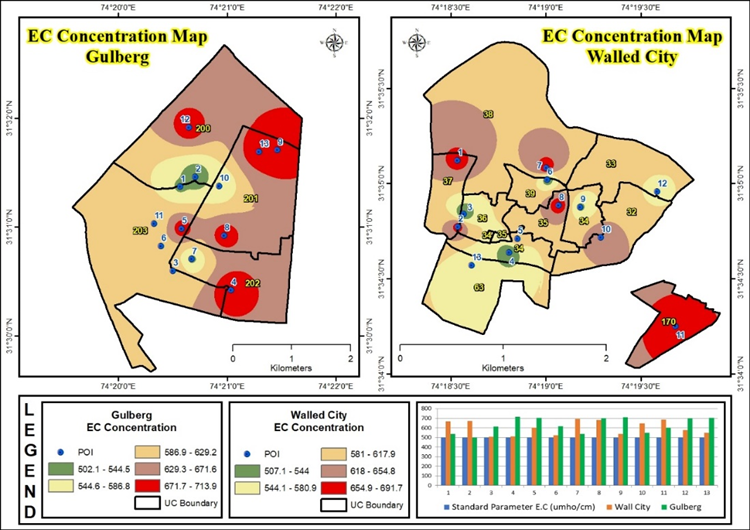
Figure 3. EC Concentration Map.
pH Concentration.
According to WHO, the pH of drinking water should be in the range of 6.5 to 8.5. pH Concentration of the study is exposed on the map appended below.
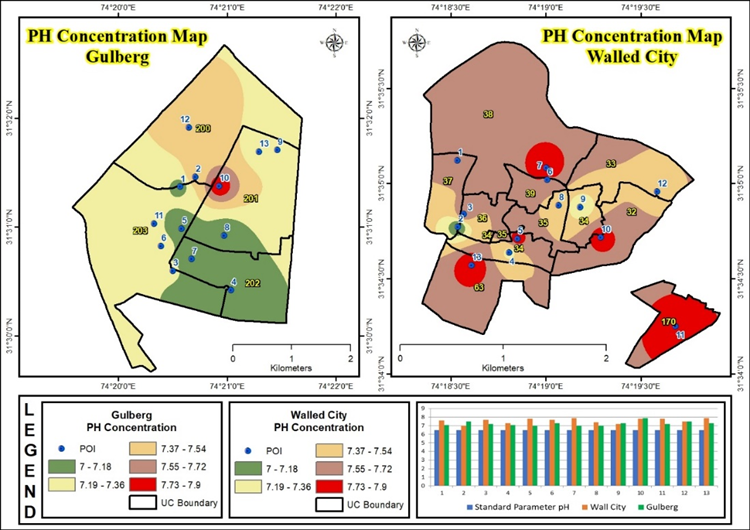
Figure 4. pH Concentration Map.
TDS Concentration.
Total Dissolved Substances comprising of organic and inorganic matter which can enter into water through water source point, which may be a tube well or water tape. Sources of TDS in water are natural or due to the materials of pipe. TDS Concentration of this study is highlighted on the map.
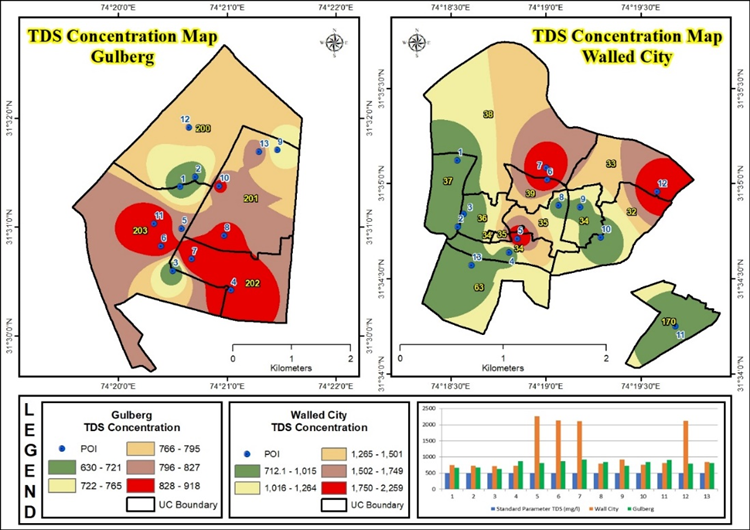
Figure 5. TDS Concentration Map.
Arsenic Concentration.
The Arsenic concentration in the Wall City and Gulberg area are represented in tables. Arsenic is a fatal contaminant in drinking water. It causes severe health problems from skin diseases to cancer. Arsenic in drinking water may come from natural and anthropogenic activities. Arsenic Concentration of the study clarified the map.

Figure 6. Arsenic Concentration Map.
Dietary Exposure Assessment.
The food and water is a major source of exposure with a minor contribution from inhaling in the contaminated air [36]. As entrance in the human body is subjected to several pathways but oral intake is the main source of exposure [37] [38]. To construct a preliminary exposure assessment, we coupled the arsenic levels found here with data on water usage. Using this procedure, a point estimate can be calculated. [49]. Estimated dietary exposure to 0.000315 and 0.000245 mg/kg BW-day for average and high Wall City and Gulberg consumers was 0.000315 and 0.000245.
Table 3. Dietary Exposure Estimation.
|
Area |
C (mg/L)/L) |
IR (L/day) |
EF Days/ Year |
ED Years |
BW (Kg) |
AT Days |
Average Daily Dose (mg/kg-bw/day) |
|
|
Wall City |
0.018 |
1.5 |
365 |
42 |
60 |
21900 |
0.000315 |
|
|
Gulberg |
0.014 |
1.5 |
365 |
42 |
60 |
21900 |
0.000245 |
|
Table 4. Life Time Average Risk.
|
Substance Arsenic |
Dietary Exposure (ADD) |
Slope factor |
|
Wall City |
0.018 |
1.5 |
|
Gulberg |
0.014 |
1.5 |
Discussion.
EC Concentration. Freshwater should have a conductivity value from 150 to 500 (umho/cm). The EC values were recorded to be minimum 513 and maximum 692 in the Wall City and 502 to 714 in Gulberg area, respectively. So, the E.C values were significantly high. This shows that the water quality is highly deteriorated by the outdated supply lines. This significant increase is an indicator that pollutants are being discharged in the water.
pH Concentration. The results showed that maximum pH 7.9 was recorded at Urdu Bazar (Wall City) and the minimum pH 7.0 was noted near Bhatti Gate (Wall City). In Gulberg, the maximum pH 7.9 was noted in Gulberg-II and minimum pH 7 in some other areas. Though small variations in pH are not harmful to health but it affects the taste and odor of drinking water. This study shows that the pH is in a normal range in some particular areas.
TDS Concentration. According to WHO, TDS standard is 500 mg/liter. In Wall City, the recorded TDS values ranged from 2000 to 2260 mg/ liter. The TDS ranging from 630 to 918 mg/liter were noted at Gulberg. This variation was because of the old supply lines of Wall City and comparatively newly laid supply lines of Gulberg.
Arsenic Concentration. The WHO standard for arsenic is 10µg/L. The arsenic concentration was highest at Delhi Gate (25.756) and minimum at Lahori Gate (12.613) of the Wall City Area. In Gulberg, the arsenic concentration was highest at Mian Boulevard (16.712) and lowest at Mian Market (8.071). The arsenic concentration reported in this study is more than the threshold value. The results of this study suggest that the water of supply lines is polluted low to high by arsenic contamination.
Dietary Exposure Assessment. This study calculated the ADD of arsenic exposure from tainted water. Climate, body size, and working conditions all play a role in how much water a person consumes. In the summer, temperatures in Lahore can soar above 45 degrees Celsius. To cut the long story short, the IR was set at 1.5 L/day to account for the typical age group (25years). The computation of the average daily dose was also influenced by other factors (Table 3). People and laboratory animals have developed cancer as a result of arsenic exposure. Whether or not drinking water containing this sort of material that poses a health risk is a question yet to be answered. A risk of one in a million (10-6) is regarded as unacceptable by the organization [30]. However, depending on national norms and environmental policies, the allowable amount may be as high as 10-4 (Superscript) in other places [40, 41].
MoE Calculation. The oral reference dose for arsenic was 3×10‾4 mg/kg-bw/day and Dietary exposure data was approximately 0.0004725 and 0.0003675 mg/kg-bw/day for Wall city and Gulberg respectively [42][43][44].
Conclusion. The potential risks to human health were next assessed using the margin of exposure (MoE) technique, which determines the difference between an animal study dose that caused cancer and the predicted human exposure to the drugs. We found MoEs as 0.952 for Wall City and 1.224 for Gulberg based on average and high consumption, respectively, in this study. Arsenic exposure in Lahore's population can be deemed a significant risk because the EFSA has recommended that an MoE of 10,000 or greater is considered to be of low concern from a public health perspective. As some international regulatory authorities have found, other countries have seen similar and consistent results.
Recommendations. As far as recommendations for this study are concerned so the very first recommendation is to change the water pipes that are too old and causing damage a lot. Concerned authorities must have to pay attention in wall city reading this issue and provide them safe and healthy water.
Relevant authorities should use the modern term water pipes that are far better as far as health and quality of water are concerned. For this purpose, high density pole ethane pipes should be used.
Acknowledgement. Author would like to acknowledge the Water and Sanitation Authority Lahore (WASA) and The Urban Unit for providing the research related data.
Author’s Contribution. H.M. and R.W.A. determined the main goal of the study. H.M. carried it out and analyzed the data, with contributions from all the co-authors: and R.W.A. provided help in writing and editing. All authors have read and agreed to the published version of the manuscript. All authors contributed equally.
Conflict of interest. Authors declared that there is no conflict of interest for publishing this manuscript in IJIST journal.
REFRENCES
- Ochuko U, T. O. (2014). A comparative assessment of water quality index (WQI) and suitability of river use for domestic water supply in urban and rural communities in Southern Nigeria. Int J Human Soc Sci., 234–45.
- Akter T, A. A. (2014). Factors influencing knowledge and practice of hygiene in Water, Sanitation and Hygiene (WASH) programme areas of Bangladesh Rural Advancement Committee. Bangladesh: Rural Remote Health.
- I, Iqbal.M.S, Naveed.N.H, and Iqbal.M.J “Efficient Strategy to Remove
Potable Water Scarcity in Lahore”. International Journal of Innovations in Science &
Technology, Vol 02 Issue 04: pp 137-149, 2020. - Tyagi S, S. B. (2013). Water quality assessment in terms of Water Quality Index. Am J Water Resour, 34–8.
- Chowdhury RM, M. S. (2012). Water Quality Index of water bodies along Faridpur-Barisal Road in Bangladesh. Glob Eng Tech Rev, 1-8.
- Dey NC, R. S. (2013). Studies on the impact of BRAC WASH-1 interventions: an overview. Dhaka: In: achievements of BRAC Water, Sanitation and Hygiene programme towards Millennium Development Goals and beyond.
- Ali .S, Hussain.J, Ali.S, Aslam.S, Khan.N, Din.S, “Bioaccumulation Efficacy of Heavy Metals In Body Organs of Rainbow (Oncorhynchus Mykiss) And Brown (Salmo Trutta Fairo) Trouts of Gilgit-Baltistan” International Journal of Innovations in Science and Technology Vol 3 Issue 3 PP 126-141, 2021.
- World health organization (WHO). (2015). world health statistics report.
- M.T, Aslam.R.W, Asad.M, Khalid.M.B, Arshad.S, Mirza.A.I, Tahir.M.H,
Ullah.H “Hazardous Effluents and their Impacts on Human Health: Future of Industrial
Boom”. International Journal of Innovations in Science & Technology, Vol 02 Issue 04: pp
150-161, 2020. - Pakistan Council of Research in Water Resources (PCRWR). (2013). Report on water quality.
- George CM, Z. Y. (2012). Evaluation of an arsenic test kit for rapid well screening in Bangladesh. Environ Sci Technol, 11213-9.
- Mirza, S. S. (2016). Distribution and Prevalence of Drinkable Water Contamination and Significance of Water Quality in Lahore. Pakistan Journal of Urban Affairs, 03-22.
- S.S, Abbas.A, Hussain.I, Zaheer.M1. “Bacteriological and Physicochemical Analysis of Groundwater of Kasur”. International Journal of Innovations in Science & Technology, Vol 01 Issue 04: pp 151-167, 2019.
- Gallagher, L. G. (2010). Using Residential History and Groundwater Modeling to Examine Drinking Water Exposure and Breast Cancer. Environmental Health Perspectives.
- Danee, J., & Helen, S. (2015, May). Spatial Mapping of Groundwater Quality using GIS. International Journal of Emerging Technology and Advanced Engineering, 5(5), 265-270.
- Ashbolt, N. J. (2004). Microbial contamination of drinking water and disease outcomes in developing regions. Elsevier, 229–238.
- Ahmad, S. R., Khan, A. Q., Ghazi, S., Ali, S., & Khan, M. S. (2012). Sewage water intrusion in the groundwater of Lahore, its causes and protections. Pakistan Journal of Nutrition, 11(5), 484-488.
- Tahir, Muhammad & Ahmad, Sajid & Aslam, Rana & Ahmad, Israr & Ullah, Hameed & Aziz, Aqsa & Zubair, Muhammad Hamza & Mirza, Ali & Hassan Raza, Dr-Syed. Critical study of groundwater quality of metropolitan lahore using geo-spatial techniques. Vol 2: pp 89-105, 2020
- Rashid, M. T., Aslam, R. W., Abbas, W., Ullah, H., Khalid, M. B., Arshad, S., . . . Tahir, M. H. (2020). Hazardous Effluents and their Impacts on Human Health: Future of Industrial Boom. International Journal of Innovations in Science & Technology, 114-125.
- Aslam, R. W., Saeed, U., Mehmood, H., Ullah, H., & Younas, I. (2017). Impure Water, a Future Disaster: A Case Study of Lahore Ground WaterQuality with GIS Techniques. ICGISGDM 2017 : International Conference on GIS and Geomatics for Disaster Management. Dubai: World Academy of Science, Engineering and TechnologyInternational Journal of Civil and Architectural Engineering.
- Ateeq Z, Arslan M, Baig Z, Ahmad A, Tanveer M.U, Akhtar A, Sohail. A, Naeem K and Mahmood S.A, “Dam Site Identification Using Remote Sensing and GIS (A case study Diamer Basha Dam Site)”. International Journal of Innovations in Science and Technology, Vol 01 Issue 04: pp 168-178.
- R. M. S, Mayo. S. M, Ahmad. I, Ahmad. N and Arif. H, “Riverbank Erosion & Consequent Land Settlement Issues: A Case of River Chenab, District Hafizabad”. International Journal of Innovations in Science and Technology, Vol 3, Issue 4, pp: 152-165, 2021.
- K, Mirza.A.I, Khalid.A and Rehman.S “How to deal with Multidimensional
Urban Poverty in South Asian Cities: A Case of Lahore Metropolitan Area”. International
Journal of Innovations in Science & Technology, Vol 02 Issue 04: pp 162-180, 2020. - Gallagher, L. G., Webster, T. F., Aschengrau, A., & Vieira, V. M. (2010). Using residential history and groundwater modeling to examine drinking water exposure and breast cancer. Environmental health perspectives, 118(6), 749–755. https://doi.org/10.1289/ehp.0901547
- Parameters of water quality interpretation and standards. (1997). United States Environmental protection agency (USEPA).
- Parameters of water quality interpretation and standards. (1998). United States Environmental protection agency (USEPA).
- World health organization (WHO). (2012). world health statistics report.
- Parameters of water quality interpretation and standards. (1992). United States Environmental protection agency (USEPA).
- (2013). Food Standards Australia New Zealand. Australia: Food Standards Australia New Zealand.
- Reza, R. &. (2010). Assessment of Groundwater Quality Status by Using Water Quality Index Method in Orissa, India. World Applied Sciences Journal, 1392-1397.
- World health organization (WHO). (2006). world health statistics report.
- Parameters of water quality interpretation and standards. (1999). United States Environmental protection agency (USEPA).
- Dianne M. Meacher, D. B. (2002). Estimation of Multimedia Inorganic Arsenic Intake in the U.S. Population, Human and Ecological Risk Assessment. An International Journal, 1697-1721.
- Yannis Manios, J. M. (2002). Health and nutrition education in primary schools of Crete: changes in chronic disease risk factors following a 6-year intervention programme. British Journal of Nutrition, 315-324.
- (2000). Toxicological Profile for Polychlorinated Biphenyls (PCBs). Center for Disease Control (CDC), Agency for Toxic Substances and Disease Registry.
- Kroes, P. (2002). Design methodology and the nature of technical artefacts. Design Studies, 287-302.
- Parameters of water quality interpretation and standards. (2000). United States Environmental protection agency (USEPA).
- Habib.W, Aslam,R.W, Akram M.A.N, Khalid M.B, Abbas.W, TaM.H, Ullah.H, Mehmood.H, Mirza.A.I “Assessment of Temporal Changes in Landuse Patterns by Incorporating Topographical Parameters”. International Journal of Agriculture & Sustainable Development, Vol 02 Issue 04: pp 99-113, 2020.
- Parameters of water quality interpretation and standards. (2011). United States Environmental protection agency (USEPA).
- (2005). Annual Report on risk assessment of food and feed. European Food Safety Authority.
- M, Ahmed.S.R, Aslam.R.W, Khalid.B.M, Ullah.H, Aziz.A, Waqas.A, Mirza.A.I, “Assessment of irrigated land transformations”. International Journal of Agriculture & Sustainable Development, Vol 02 Issue 04: pp 114-126, 2020.
- Ahmad, A.; Ahmad, S.R.; Gilani, H.; Tariq, A.; Zhao, N.; Aslam, R.W.; Mumtaz, F. A Synthesis of Spatial Forest Assessment Studies Using Remote Sensing Data and Techniques in Pakistan. Forests 2021, 12, 1211. https://doi.org/10.3390/f12091211
- Amjad, Dania & Kausar, Sumaira & Aslam, Rana & Sarwar, Faiza. (2019). Land cover change analysis and impacts of deforestation on the climate of District Mansehra, Pakistan. Journal of Biodiversity and Environmental Sciences. 14 (6). 103-113. 10.6084/m9.figshare.13352873.v1.
- Mustafa, F.; Wang, H.; Bu, L.; Wang, Q.; Shahzaman, M.; Bilal, M.; Zhou, M.; Iqbal, R.; Aslam, R.W.; Ali, M.A.; Qiu, Z. Validation of GOSAT and OCO-2 against In Situ Aircraft Measurements and Comparison with CarbonTracker and GEOS-Chem over Qinhuangdao, China. Remote Sens. 2021, 13, 899. https://doi.org/10.3390/rs13050899
- Rafique, Rizwana & Din, Zaheer & Ilat, Sundas & Aslam, Rana & Habib, Arslan. (2021). IN VITRO Antiviral Activity of Stem and Leaf Extract of Olea Ferruginea Royle Against Foot and Mouth Disease Virus. Pakistan Journal of Science. 73. 364-377.
- Shahzaman, M.; Zhu, W.; Ullah, I.; Mustafa, F.; Bilal, M.; Ishfaq, S.; Nisar, S.; Arshad, M.; Iqbal, R.; Aslam, R.W. Comparison of Multi-Year Reanalysis, Models, and Satellite Remote Sensing Products for Agricultural Drought Monitoring Over South Asian Countries. Remote Sens. 2021, 13, 3294. https://doi.org/10.3390/rs13163294
- Mustafa, F., Bu, L., Wang, Q., Yao, N., Shahzaman, M., Bilal, M., Aslam, R. W., and Iqbal, R.: Neural-network-based estimation of regional-scale anthropogenic CO2 emissions using an Orbiting Carbon Observatory-2 (OCO-2) dataset over East and West Asia, Atmos. Meas. Tech., 14, 7277–7290, https://doi.org/10.5194/amt-14-7277-2021, 2021.
- Hameed Ullah, Rana Waqar Aslam, Sajid Rashid Ahmad, Muhammad Ameer Nawaz Akram, Muhammad Burhan Khalid, Kanwal Javid, Aqsa Aziz, Danish Raza. Geo-spatial analysis and modelling of water borne diseases in District Multan. J. Bio. Env. Sci. 19(3), 23-35, September 2021. https://innspub.net/jbes/geo-spatial-analysis-and-modelling-of-water-borne-diseases-in-district-multan/


