
Heart Attack Risk Prediction with Duke Treadmill Score with Symptoms using Data Mining
Muhammad Shoaib Anjum1, Dr. Shahzad Mumtaz2, Dr. Omer Riaz3, Waqas Sharif1
1 Department of Computer Science, The Islamia University of Bahawalpur
2 Department of Data Science, The Islamia University of Bahawalpur.
3 Department of Information Technology, The Islamia University of Bahawalpur.
* Correspondence: Muhammad Shoaib Anjum Email ID: Shoaib.anjum@hotmail.com
Citation | Anjum. M. S, Mumtaz. S, Riaz. O and Sharif. W, “Heart Attack Risk Prediction with Duke Treadmill Score with Symptoms using Data Mining”. International Journal of Innovations in Science and Technology. Vol 3, Issue 4, pp: 174-185, 2021
Received | Dec 9, 2021; Revised | Dec 20, 2021 Accepted | Dec 22, 2021; Published | Dec 29, 2021.
Abstract.
The healthcare industry has a huge volume of patients’ health records but the discovery of hidden information using data mining techniques is missing. Data mining and its algorithm can help in this situation. This study aims to discover the hidden pattern from symptoms to detect early Stress Echocardiography before using Exercise Tolerance Test (ETT). During this study, raw ETT data of 776 patients are obtained from private heart clinic “The Heart Center Bahawalpur”, Bahawalpur, South Punjab, Pakistan. Duke treadmill score (DTS) is an output of ETT which classifies a patient’s heart is working normally or abnormally. In this work multiple machine learning algorithms like Support Vector Machine (SVM), Logistic Regression (LR), J.48, and Random Forest (RF) are used to classify patients’ hearts working normally or not using general information about a patient like a gender, age, body surface area (BSA), body mass index (BMI), blood pressure (BP) Systolic, BP Diastolic, etc. along with risk factors information like Diabetes Mellitus, Family History, Hypertension, Obesity, Old Age, Post-Menopausal, Smoker, Chest Pain and Shortness Of Breath (SOB). During this study, it is observed that the best accuracy of 85.16% is achieved using the Logistic Regression algorithm using the split percentage of 60-40.
Keywords: Duke Treadmill Score, Data Mining, ETT, Support Vector Machine, Logistic Regression, J.48, Random Forest, WEKA
1. INTRODUCTION
The Healthcare industry collects a large volume of data that needs to be mined to discover useful information for better decision making. Heart Disease is the major cause of mortality worldwide. Symptoms have a huge impact on heart disease. Some are more important and some are less. It is very important to detect the weightage of each attribute. More weighted symptoms have a high impact on disease prediction. For these reasons we are using data mining to check which attribute has more weightage to detect the duke treadmill score which is directly associated with heart attack chances [1]
Data mining helps to reduce the number of tests and early prediction of disease and avoid highly charged test costs and time to start treatment of a patient. Heart disease early prediction system is useful for medical experts and policymakers to avoid mortality with early treatment start based on symptoms. This paper presents the model and symptoms that help diagnose the patient's condition.
Site Map
This study was conducted in Bahawalpur, Southern Punjab, Pakistan in the Faculty of Computing, The Islamia University of Bahawalpur, Bahawalpur.

Figure 1. Study Site
LITERATURE REVIEW
Data mining and algorithms used in medical domain
Data mining was helpful in previous heart disease prediction systems [2, 3]. Logistic Regression, Support Vector Machine, J.48, KNN, K-Nearest, and Decision Table are powerful classification algorithms used to classify heart disease [4]. These algorithms are used to process the raw data and make some useful relationships between different attributes in data.
Early study on Prediction of Duke Treadmill score
Duke Treadmill Score (DTS) is a value that calculates from the exercise time, Angina Score, and ST Deviation [5]. DTS calculate with the following formula: exercise time − (5 × maximum ST deviation) − (4 × angina index). This formula generates an integer number that is further divided into categories. If the DTS value is greater than or equal to 5 then it considers as normal and if the value is less than 5 and greater than or equal to -10 then it considers as Moderate Risk for the patient and if the DTS value is below then -10 then it considers as High Risk for the patient. These exercise values come from exercises that are based on some protocol like Bruce, Modified Bruce or Naugton, etc. Some previous studies were done using DTS and other medical test results with data mining [6] which is used to predict different coronary arteries disease.
In this study, the duke treadmill score was categorized into two categories either normal or abnormal as shown in Table 1.
Table 1. Duke Treadmill Score Categories
|
Sr. |
Duke Treadmill Score |
Category |
|
1 |
>=5 |
Normal |
|
2 |
<5 |
Abnormal |
PROBLEM STATEMENT
Previously there are many reported research is presented on Duke Treadmill Score (DTS) but this test is difficult for everyone to achieve the standard of its protocol. Old age patients and kids who are not able to walk on the treadmill at a specific time to achieve targeted heart rate. In this work we are predicting patients’ heart condition as normal or abnormal without performing ETT and calculating DTS.
MATERIAL AND METHODS
Data Set
Dataset used in this study is constructed from patients' ETT data provided by Dr. Zafar Iqbal Jam (Cardiologist), The Heart Center Bahawalpur, Punjab, Pakistan. There were 776 patients’ data from the year 2016 to 2021. In this dataset, there are 15 attributes and each patient is classified as having normal or abnormal heart activity based on duke score. This data set contains 157 females and 619 male patients while their male patients’ age is from 18 to 75 years and female patients’ age is 26 to 72 years. Male patient’s BSA has range from 1.13 to 2.92 and in female patients’ BSA is from 1.29 to 2.49. Male patient’s BMI has ranged from 16.30 to 341.16 and in female patients it is 15.22 to 206.59. Two attributes are Blood Pressure Systolic from 90 to 180 and Blood Pressure Diastolic from 52 to 110. After these attributes of our dataset, nine attributes are risk factors in patients. Their statistics are as follows: Diabetes Mellitus is one of the major issues these days [7].
A total of 144 patients has this risk factor where 104 are male patients and 40 are female patients. Family history is another risk factor in patients which indicates that other family members have heart problems. In this dataset, 136 patients have a family history of CHD where 105 are male patients and 31 female patients. Next, the Hypertension risk factor has in 335 patients where 239 patients are male and 96 patients are female. Hypertension is more common in old age people. Mortality in heart patients has increased due to hypertension [8]. The next risk factor of this dataset is obesity. There are 169 obese patients in a dataset where 116 are male and 53 are female. The next risk factor in this dataset is Old Age. Patients with an old age risk factor are 74 where 56 are male patients and 18 are female patients. Attribute Old age decided by the doctor.
A patient has any heart problem due to age factor considered as an Old Age risk factor. The next risk factor is Smoking. Smoking has dangerous side effects on heart patients. There are a lot of previous researches that prove that smoking is a serious cause and risk factor for heart patients [9]. 152 patients are smokers where 151 patients are male patients and only one patient is a female smoker. The next risk factor is Post-menopausal. There is 19 patient with this risk factor all are females. The next attribute is Chest pain, a total of 708 patients have a primary indication of chest pain where 566 are male patients and 142 are female patients. Chest pain is the primary indication of CHD. A lot of studies have been conducted to prove the chest pain is an indication of CHD [10, 11]. Shortness of Breath (SOB) is a condition of the patient when he/she run or even walks sometimes and starts a problem in breathing. But some are severe cases where patients start shortness of breath by just walking some steps and sitting up and down [12]. 13 patients have SOB where 9 are male patients and 4 are female patients.
Table 2. Data Set Attributes
|
Sr. |
Attribute |
Description |
Total |
Division |
|
1 |
Gender |
Gender attribute represent the Sex either male or female 1=Male 0=Female |
776 |
619-Male, 157-Female |
|
2 |
Age |
Age is number in years |
776 |
Male(18-75), Female (26-72) |
|
3 |
BSA |
BSA is Body surface area.[13] |
776 |
Male (1.13-2.92), Female (1.29-2.49) |
|
4 |
BMI |
Body mass Index [14] |
776 |
Male (16.30-341.16), Female (15.22-206.59) |
|
5 |
BP Systolic |
Blood pressure systolic. |
776 |
Male (90-179), Female (92-180) |
|
6 |
BP Diastolic |
Blood pressure Diastolic. |
776 |
Male (52-110), Female (53-108) |
|
7 |
Diabetes Mellitus |
Diabetes Mellitus normaly called diabeted. 1= Diabetes Mellitus 0= No DM |
144 |
Male=104, Female=40 |
|
8 |
Family History |
Family history means any heart disease patients in parents or grandparents. 1= Family Has History 0=No Risk of family. |
136 |
Male=105, Female=31 |
|
9 |
Hypertension |
Hypertension means high blood pressure. 1=Patient has hypertension 0= patient does not have hypertension |
335 |
Male=239, Female=96 |
|
10 |
Obesity |
Obesity means patient has more weight then normal 1=Patient has obesity RF 0=Patient does not have RF of obesity |
169 |
Male=116, Female=53 |
|
11 |
Old Age |
Patient’s age is above 50-years consider as an old age patient. 1= Patient is old age. 0= Patient is not old age. |
74 |
Male=56, Female=18 |
|
12 |
Post-menopausal |
Post-menopausal is a risk factor for females 1=Patient has PM risk factor. 0=Patient has not risk factor of PM. |
19 |
Male=0, Female=19 |
|
13 |
Smoker |
Patient has smoking habit is called smoker. 1= Smoker 0= Not Smoker |
152 |
Male=151, Female=1 |
|
14 |
Cheast Pain |
Cheast pain has all type of cheast pain either cardic or non cardic. 1= Patient has Cheast pain. 0= Patient doest not have Cheast pain. |
708 |
Male=566, Female=142 |
|
15 |
SOB |
Shortness of breath. 1= Shortness in breath 0= Patient has no shortness in breath. |
13 |
Male=9, Female=4 |
Data Preparation
In this study, for experiments purpose WEKA version 3.8.2 is used. Duke score for each patient is shown in histogram Figure 2. Duke Score already discussed in Early Study on Prediction of Duke Treadmill score
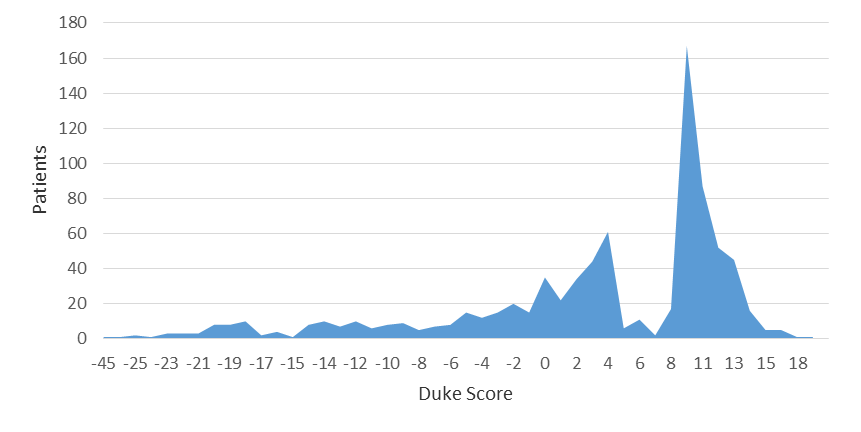
Figure 2. Distribution of patients by DTS
The patients’ data were collected by the Doctor mentioned in Data Set section in his medical clinic. Each patient is classified as having a normal or abnormal heart condition based on the Duke results obtained by ETT examination. During ETT a patient has to walk on the treadmill using according to certain protocols as discussed in Early Study on Prediction of Duke Treadmill score.
During ETT a patient is required to achieve some specific heart rates, blood pressures, etc. are monitored. Initially, the provided data was in SQL format where a few columns contain multi-value attributes like risk factors and primary indications. These columns are normalized by spreading these into multiple columns. Furthermore, the data is manually observed and a few columns with less than 15 occurrences in a complete column are removed. All the columns for risk factors and primary indicators are in binary form. The data is labeled manually into two classes which are normal and abnormal based on samples’ duke score. The samples having equal or more than 5 duke scores are labeled normal else labeled abnormal.
By using the above mansion risk factors and primary indications we want to predict patients’ heart condition before performing ETT. In terms of this prediction, we are using WEKA’s Algorithms.
- Logistic Regression Algorithm, Logistic regression is a classifier with binary classification technique. Logistic Regression is a formula that came from statistics. It is like linear regression. It works with binary values based on some specified set of dependent or independent variables[15, 16].
- Random Forest Algorithm, Random forest is rapidly used and helpful in previous studies for decision making. Yeshvendra K. Singh uses this algorithm to predict Heart Disease with 85% correct prediction [17, 18].
- J.48 Algorithm, J.48 is a famous classifier for data mining. J.48 used in many previous studies to predict heart disease and some other diseases using symptoms of data[19, 20].
- SVM, a Support vector machine (SVM) is another powerful tool for using classification and regression. This algorithm is also used to analyze data and pattern recognition. SVM is a mathematical function for creating a model for real-world data. This is already proved by Mythili T. in [21] and Chandra Babu Gokulnath in [22] with the highest accuracy of SVM being 83% in his study.
RESULTS
Results are prepared in this section with the above-mentioned algorithms with two different strategies all results are compared at the end. Cross-Validation and Percentage Split was used for each algorithm. Each algorithm is discussed separately with these strategies.
LOGISTIC REGRESSION
Firstly Logistic regression was used to analyze and classify algorithms using WEKA. Initially, Logistic regression was applied with no filter with split data of 60% as training data and 40% as test data. With this algorithm total, 129 patients were correctly identified as normal while 20 patients were normal but identified as abnormal patients. Same as with abnormal patients, 135 patients were correctly identified as abnormal similarly, 26 patients were abnormal but identified as normal patients. With this algorithm, 264 patients were correctly identified out of 310 patients which were tested. The overall accuracy for this algorithm is 85.16%. Detail about the algorithm classification is given below in Table 3.
This classifier showed the accuracy of both classes’ values Normal and Abnormal. Normal Accuracy was 86.6% and abnormal accuracy was 83.9%. Detail accuracy of this algorithm is shown in the below Table 3.
Table 3. Logistic Results of Percentage Split
|
Detailed Accuracy By Class |
|||||
|
|
Precision |
Recall |
F-Measure |
MCC |
ROC Area |
|
Normal |
83.20% |
86.60% |
84.90% |
70.40% |
89.70% |
|
Abnormal |
87.10% |
83.90% |
85.40% |
70.40% |
89.70% |
The logistic algorithm was again applied with cross-validation with 10-Fold. With this algorithm total, 306 patients were correctly identified as normal but 73 patients were normal but identified as abnormal patients. Same as with abnormal patients, 320 patients were correctly identified as abnormal but actually 77 patients were abnormal but identified as normal patients. With this algorithm, 626 patients were correctly identified out of 776 patients' data. The overall accuracy for this algorithm is 80.67%. Detail about the algorithm classification in below Table 4.
This classifier showed the accuracy of both class values Normal and Abnormal. Normal Accuracy is 80.70% and abnormal accuracy is 80.60%. Detail accuracy of this algorithm is shown in the below Table 4.
Table 4. Logistic Results Of Cross Validation
|
Detailed Accuracy By Class |
|||||
|
|
Precision |
Recall |
F-Measure |
MCC |
ROC Area |
|
Normal |
79.90% |
80.70% |
80.30% |
61.30% |
89.30% |
|
Abnormal |
81.40% |
80.60% |
81.00% |
61.30% |
89.30% |
RANDOM FOREST
The second algorithm used for classification is Random Forest. Initially, Random Forest was applied with no filter and split data of 60% as training data and 40% as test data. With this algorithm total of 122 patients were correctly identified as normal but 27 patients were normal but identified as abnormal patients. Similarly, 137 patients were correctly identified as abnormal but 24 patients were identified as normal patients which were actually abnormal. With this algorithm, 259 patients were correctly identified out of 310 patients' test data. The overall accuracy for this algorithm was up to 83.55%. Detail about the algorithm classification is Table 5 .
This classifier shows the accuracy of both classes’ values Normal and Abnormal. Normal Accuracy was 81.90% and abnormal accuracy was 85.10%. Detail accuracy of this algorithm is shown in the below Table 5
Table 5. Random Forest Results of Split Percentage
|
Detailed Accuracy By Class |
|||||
|
|
Precision |
Recall |
F-Measure |
MCC |
ROC Area |
|
Normal |
83.60% |
81.90% |
82.70% |
67.00% |
89.20% |
|
Abnormal |
83.50% |
85.10% |
84.30% |
67.00% |
89.20% |
Random Forest algorithm was again applied with cross-validation with 10-Fold. With this algorithm total of 296 patients were correctly identified as normal but 83 patients were normal which were identified as abnormal patients. Same as with abnormal patients, 331 patients were correctly identified as abnormal indeed 66 patients were abnormal but identified as normal patients. With this algorithm, 627 patients were correctly identified out of 776 patients' data. The overall accuracy for this algorithm was obtained up to 80.80%. Detail about the algorithm classification is in Table 6.
This classifier showed the accuracy of both classes’ values Normal and Abnormal. Normal Accuracy was 78.10% and abnormal accuracy was 83.40%. Detail accuracy of this algorithm is shown in the Table 6.
Table 6. Random Forest Results With Cross Validation
|
Detailed Accuracy By Class |
|||||
|
|
Precision |
Recall |
F-Measure |
MCC |
ROC Area |
|
Normal |
81.80% |
78.10% |
79.90% |
61.60% |
89.00% |
|
Abnormal |
80.00% |
83.40% |
81.60% |
61.60% |
89.00% |
J.48
The third algorithm used for classification was J.48. Initially, J.48 was applied with no filter and split data of 40% as training data and 60% as test data. With this algorithm total of 189 patients were correctly identified as normal but 46 patients were normal but identified as abnormal patients. Similarly, 175 patients were correctly identified as abnormal but 56 patients were abnormal but identified as normal patients. With this algorithm, 364 patients were correctly identified out of 466 patients' test data. The overall accuracy for this algorithm was 78.11%. Detail about the algorithm classification in below Table 7.
This classifier showed the accuracy of both classes’ values Normal and Abnormal. Normal Accuracy was 80.40% and abnormal accuracy was 75.80%. Detailed accuracy of this algorithm is shown in the below Table 7.
Table 7. J.48 Results with Split Percentage
|
Detailed Accuracy By Class |
|||||
|
|
Precision |
Recall |
F-Measure |
MCC |
ROC Area |
|
Normal |
77.10% |
80.40% |
78.80% |
56.30% |
79.90% |
|
Abnormal |
79.20% |
75.80% |
77.40% |
56.30% |
79.90% |
J.48 algorithm was again applied with cross-validation 15-Folds. With this algorithm total, 295 patients were correctly identified as normal but 84 patients were normal but identified as abnormal patients. Same as with abnormal patients, 315 patients were correctly identified as abnormal but 82 patients were abnormal but identified as normal patients. With this algorithm, 610 patients were correctly identified out of 776 patients' data. The overall accuracy for this algorithm is 78.61%. Detail about the algorithm classification in below Table 8.
This classifier shows the accuracy of both class values Normal and Abnormal. Normal Accuracy is 77.80% and abnormal accuracy is 79.30%. Detail accuracy of this algorithm is shown in the below Table 8
Table 8. J.48 Results With Cross Validation
|
Detailed Accuracy By Class |
|||||
|
|
Precision |
Recall |
F-Measure |
MCC |
ROC Area |
|
Normal |
78.20% |
77.80% |
78.00% |
57.20% |
79.90% |
|
Abnormal |
78.90% |
79.30% |
79.10% |
57.20% |
79.90% |
SUPPORT VECTOR MACHINE
The last algorithm used for classification was SVM. Initially, SVM was applied with no filter and split data of 40% as training data and 60% as test data. With this algorithm total, 127 patients were correctly identified as normal but 22 patients were normal but identified as an abnormal patient. Same as with abnormal patients, 128 patients were correctly identified as abnormal but 33 patients were abnormal but identified as normal patients. With this algorithm, 255 patients were correctly identified out of 310 patients' data. The overall accuracy for this algorithm was up to 82.26%. Detail about the algorithm classification in below Table 9.
This classifier shows the accuracy of both class values Normal and Abnormal. Normal Accuracy was 85.20% and abnormal accuracy was 79.50%. Detail accuracy of this algorithm is shown in the Table 9
Table 9. SVM Result with Split Percentage
|
Detailed Accuracy By Class |
|||||
|
|
Precision |
Recall |
F-Measure |
MCC |
ROC Area |
|
Normal |
79.40% |
85.20% |
82.20% |
64.70% |
82.40% |
|
Abnormal |
85.30% |
79.50% |
82.30% |
64.70% |
82.40% |
SVM algorithm was again applied with cross-validation 5-Folds and random seed 2 from detail settings. With this algorithm total of 310 patients were correctly identified as normal but 69 patients were normal but identified as abnormal patients. Same as with abnormal patients, 314 patients were correctly identified as abnormal but 83 patients were abnormal but identified as normal patients. With this algorithm, 624 patients were correctly identified out of 776 patients' data. The overall accuracy for this algorithm is up to 80.41%. Detail about the algorithm classification is given in Table 10
This classifier shows the accuracy of both class values Normal and Abnormal. Normal Accuracy abnormal accuracy was 81.80% and 79.10% respectively. Detail accuracy of this algorithm was shown in the below Table 10
Table 10. SVM Results with Cross Validation
|
Detailed Accuracy By Class |
|||||
|
|
Precision |
Recall |
F-Measure |
MCC |
ROC Area |
|
Normal |
78.90% |
81.80% |
80.30% |
60.90% |
80.40% |
|
Abnormal |
82.00% |
79.10% |
80.50% |
60.90% |
80.40% |
DISCUSSIONS
After applying all the algorithms one by one with both Split Percentage in Table 11 and Cross-validation in Table 12, we had the best performance of each algorithm. The highest performance originated from Logistic Regression Algorithm with a split percentage, which was 85.16% overall. We compared all results into summarized form.
Table 11. Split Percentage of Each Algorithm
|
Detailed Accuracy By Algorithm (All values are in %) |
||||||
|
|
Overall Accuracy |
Precision |
Recall |
F-Measure |
MCC |
ROC Area |
|
LR |
85.16 |
85.20 |
85.20 |
85.20 |
70.40 |
89.70 |
|
RF |
83.55 |
83.50 |
83.50 |
83.50 |
67.00 |
89.20 |
|
J.48 |
78.11 |
78.20 |
78.10 |
78.10 |
56.30 |
79.90 |
|
SVM |
82.26 |
82.50 |
82.30 |
82.30 |
64.70 |
82.40 |
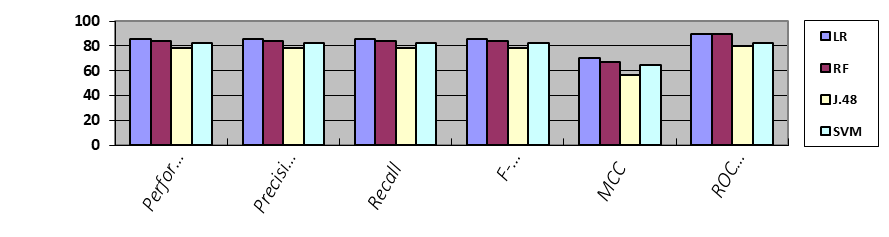
Figure 3. Results accuracy of each algorithm with split percentage
Table 12. Cross Validation of Each Algorithm
|
Detailed Accuracy By Algorithm (All values are in %) |
||||||
|
|
Overall Accuracy |
Precision |
Recall |
F-Measure |
MCC |
ROC Area |
|
LR |
80.67 |
80.70 |
80.70 |
80.70 |
61.30 |
89.30 |
|
RF |
80.80 |
80.80 |
80.80 |
80.80 |
61.60 |
89.00 |
|
J.48 |
78.61 |
78.60 |
78.60 |
78.60 |
57.20 |
79.90 |
|
SVM |
80.41 |
80.50 |
80.40 |
80.40 |
60.90 |
80.40 |
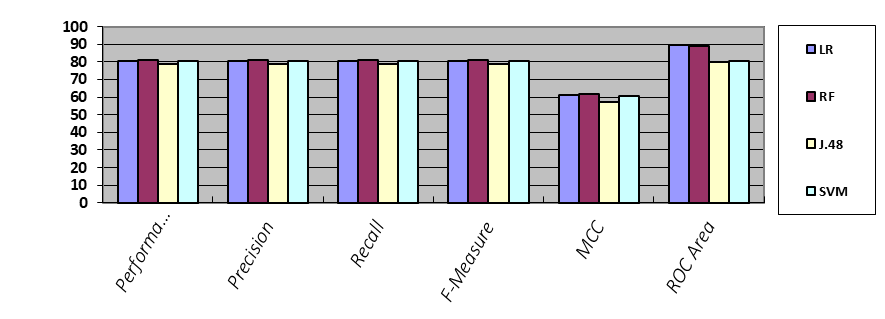
Figure 4. Results accuracy of each algorithm with cross validation
Table 13 and Table 14 shows statistical results of used algorithms. According to these LR with split percentage showed maximum agreement of 0.7. The results were in accordance with the previous results.
Table 13. Algorithm results with split percentage results
|
Algorithm Stats With Split Percentage Results |
||
|
|
Kappa Statistic |
Mean Absolute Error |
|
LR |
0.7032 |
0.2501 |
|
RF |
0.6702 |
0.2778 |
|
J.48 |
0.562 |
0.2627 |
|
SVM |
0.6456 |
0.1774 |
Table 14. Algorithm results with cross validation results
|
Algorithm Stats With Cross Validation Results |
||
|
|
Kappa Statistic |
Mean Absolute Error |
|
LR |
0.6133 |
0.2594 |
|
RF |
0.6154 |
0.2732 |
|
J.48 |
0.5719 |
0.2647 |
|
SVM |
0.6084 |
0.1959 |
CONCLUSION & FUTURE WORK
Results showed that LR Algorithm can correctly predict the patient condition up to 85% accuracy. To date, this is the first study to predict patients’ heart condition using their general condition and symptoms without performing ETT and calculating DTS. In future work, we will try to improve accuracy by adding more features to the dataset. Patients with an abnormal heart condition can be further classified into moderate and high-risk patients.
ACKNOWLEDGMENT
The authors would like to thank "The Heart Center Bahawalpur" clinic for provide the data for scientific research.
Author’s Contribution. All the authors contributed equally.
Project details. NIL
Conflict of interest. We declare no conflict of interest for publishing this manuscript in IJIST.
REFERENCES
- Günaydın, Z.Y., Bektaş, O., Gürel, Y.E., Karagöz, A., Kaya, A., Kırış, T., and Zeren, G.: ‘The value of the Duke treadmill score in predicting the presence and severity of coronary artery disease’, Kardiologia Polska (Polish Heart Journal), 2016, 74, (2), pp. 127-134
- Bhatla, N., and Jyoti, K.: ‘An analysis of heart disease prediction using different data mining techniques’, International Journal of Engineering, 2012, 1, (8), pp. 1-4
- Thomas, J., and Princy, R.T.: ‘Human heart disease prediction system using data mining techniques’, in Editor (Ed.)^(Eds.): ‘Book Human heart disease prediction system using data mining techniques’ (IEEE, 2016, edn.), pp. 1-5
- Tougui, I., Jilbab, A., and El Mhamdi, J.: ‘Heart disease classification using data mining tools and machine learning techniques’, Health and Technology, 2020, 10, pp. 1137-1144
- Kwok, J.M., Miller, T.D., Hodge, D.O., and Gibbons, R.J.: ‘Prognostic value of the Duke treadmill score in the elderly’, Journal of the American College of Cardiology, 2002, 39, (9), pp. 1475-1481
- Verma, L., Srivastava, S., and Negi, P.: ‘An intelligent noninvasive model for coronary artery disease detection’, Complex & Intelligent Systems, 2018, 4, (1), pp. 11-18
- Liu, G., Li, Y., Hu, Y., Zong, G., Li, S., Rimm, E.B., Hu, F.B., Manson, J.E., Rexrode, K.M., and Shin, H.J.: ‘Influence of lifestyle on incident cardiovascular disease and mortality in patients with diabetes mellitus’, Journal of the American College of Cardiology, 2018, 71, (25), pp. 2867-2876
- Messerli, F.H., Rimoldi, S.F., and Bangalore, S.: ‘The transition from hypertension to heart failure: contemporary update’, JACC: Heart Failure, 2017, 5, (8), pp. 543-551
- Critchley, J.A., and Capewell, S.: ‘Mortality risk reduction associated with smoking cessation in patients with coronary heart disease: a systematic review’, Jama, 2003, 290, (1), pp. 86-97
- Nilsson, S., Scheike, M., Engblom, D., Karlsson, L.-G., Mölstad, S., Akerlind, I., Ortoft, K., and Nylander, E.: ‘Chest pain and ischaemic heart disease in primary care’, British Journal of General Practice, 2003, 53, (490), pp. 378-382
- Douglas, P.S., and Ginsburg, G.S.: ‘The evaluation of chest pain in women’, New England Journal of Medicine, 1996, 334, (20), pp. 1311-1315
- Barnett, L.A., Prior, J.A., Kadam, U.T., and Jordan, K.P.: ‘Chest pain and shortness of breath in cardiovascular disease: a prospective cohort study in UK primary care’, BMJ open, 2017, 7, (5), pp. e015857
- Wang, Y., Moss, J., and Thisted, R.: ‘Predictors of body surface area’, Journal of clinical anesthesia, 1992, 4, (1), pp. 4-10
- Lamon-Fava, S., Wilson, P.W., and Schaefer, E.J.: ‘Impact of body mass index on coronary heart disease risk factors in men and women: the Framingham Offspring Study’, Arteriosclerosis, thrombosis, and vascular biology, 1996, 16, (12), pp. 1509-1515
- Amen, K., Zohdy, M., and Mahmoud, M.: ‘Machine Learning for Multiple Stage Heart Disease Prediction’, in Editor (Ed.)^(Eds.): ‘Book Machine Learning for Multiple Stage Heart Disease Prediction’ (2020, edn.), pp. 205-223
- Dwivedi, A.K.: ‘Analysis of computational intelligence techniques for diabetes mellitus prediction’, Neural Computing and Applications, 2018, 30, (12), pp. 3837-3845
- Singh, Y.K., Sinha, N., and Singh, S.K.: ‘Heart disease prediction system using random forest’, in Editor (Ed.)^(Eds.): ‘Book Heart disease prediction system using random forest’ (Springer, 2016, edn.), pp. 613-623
- Jabbar, M.A., Deekshatulu, B.L., and Chandra, P.: ‘Prediction of heart disease using random forest and feature subset selection’: ‘Innovations in bio-inspired computing and applications’ (Springer, 2016), pp. 187-196
- Iliyas, M.M.K., Shaikh, M.I.S., and Student, M.: ‘Prediction of Heart Disease Using Decision Tree’, Allana Inst of Management Sciences, Pune, 2019, 9, pp. 1-5
- Huang, F., Wang, S., and Chan, C.-C.: ‘Predicting disease by using data mining based on healthcare information system’, in Editor (Ed.)^(Eds.): ‘Book Predicting disease by using data mining based on healthcare information system’ (IEEE, 2012, edn.), pp. 191-194
- Mythili, T., Mukherji, D., Padalia, N., and Naidu, A.: ‘A heart disease prediction model using SVM-Decision Trees-Logistic Regression (SDL)’, International Journal of Computer Applications, 2013, 68, (16)
- Gokulnath, C.B., and Shantharajah, S.: ‘An optimized feature selection based on genetic approach and support vector machine for heart disease’, Cluster Computing, 2019, 22, (6), pp. 14777-14787


