
Impact of Land-use Change on Agricultural Production & Accuracy Assessment through Confusion Matrix
Muhammad Sajid1, Muhammad Mohsin2, Tabasam Jamal3, Muhammad Mobeen4, Abdur Rehman4, Anum Rafique5
1Department of Geography, Govt. Graduate College Chowk Azam, Layyah
2Department of Geography, Govt. Sadiq Egerton Graduate College, Bahawalpur
3Department of Geography, University of Punjab.
4Department of Earth Sciences, University of Sargodha, Sargodha
5Department of Geography, Govt. Associate College for Women, Mela Mandi,
Sargodha
* Correspondence: Abdur Rehman(abdurrehmanuospk@gmail.com)
Citation | Sajid. M, Mohsin. M, Jamal. T, Mobeen. M, Rehman. A, Rafique A, “Impact of Land-use Change on Agricultural Production & Accuracy Assessment through Confusion Matrix”. International Journal of Innovations in Science & Technology, Vol 04, Issue 01: pp; 233-245, 2022.
Received | Jan 18, 2021; Revised | Feb 27, 2021 Accepted | March 02, 2022; Published | March 03, 2022.
________________________________________________________________________
Land modification and its allied resources have progressively become a severe problem presently pulling the worldwide attention and now it rests at the central point of the conservation of the environment and sustainability. The present research aimed to examine the land-use changes and their impact on agricultural production using remote sensing and GIS techniques over the study area that comprised of Tehsil Shorkot, District Jhang, Punjab, Pakistan. Images were pre-processed by using the Arc GIS and ERDAS Imagine 15 software for stacking of the layers, sub-setting, and mosaicking of the satellite bands. After the pre-processing of the images, supervised image classification scheme was applied by employing a maximum likelihood algorithm to recognize the land-use changes which have been observed in the area under study. The area under water was occupied 9.6 km2 in 2010 that increased to 21.04 km2 in 2015 and decreased to 19.4 km2in 2020. Built-up land was 16.6 km2 in 2010 that increased to 19.4 km2 in 2015 and 26.8 km2 in 2020. The total area under vegetation was computed as 513.2 km2 in 2010 that increased to 601.6km2 in 2015 and further increased to 717.7 km2in 2020. Forest land use showed decreasing trend as the covered area in 2010 was occupied 90.8 km2 that decreased to 86.7 km2 in 2015 and further decreased to 61.84 km2 in 2020. In 2010, barren land use was occupied 528.54 km2 that considerably decreased to 429.64 km2 in 2015 further decreased to 333.1 km2 in 2020. Barren land drastically decreased into watered, built-up, and vegetation land uses. The findings of this study will be helpful for the future conservation of various land-use types, urban and regional planning, and an increase in agricultural production of various crops in the study area.
Keywords: Landuse; GIS; RS; agricultural production; Shorkot.
Introduction
Land modification and its allied resources have progressively become a severe problem presently pulling worldwide attention and now it rests at the central point of the conservation of the environment and sustainability [1]. It is perhaps due to the growing landuse manifestation and change consequences [2, 3]. The resulting impacts have been more emphasized by the enhanced land-use changes as a result of increased growth in population and the associated development in the socio-economic aspects from the different perspectives [4, 5, 6]. It is a general perception that nations attain economic prosperity having an increased population growth and affect the patterns of the consumption of many people, thus the increased needs by the well-off urban residents for the meat, nutrients, food, and dairy products have left untold negative impacts on the natural resources and also on the land and agricultural production [7]. A large number of models are in use for predicting the land-use changes for example CLUE [8], cellular automata (CA) [9], and Markov chain [10]. Land-use change concerning agricultural land is not only a role of the conditions [11] related to biophysical that makes a parcel of the land viable for agricultural production of various types [12]. Planning for urban land-use has especially attained much consideration in many studies and less attention has been paid towards the planning of agricultural land use [13]. Agricultural land is highly at the risk of conversion to non-agricultural undesired uses (housing colonies, roads, etc.) in many cities of the developed world as it has been witnessed in Bahawalpur city of Pakistan [14,15,16,17,18]. So, it is highly desired for efficient and more effective planning for the use of the agricultural lands in future. The basic motivation behind conducting this research was to formulate a network that permits the exploration of the substitute ways for the development of agricultural land use and its production in the future. Land-use changes play an important role in maintaining a global ecosystem balance [19], the human variables for example government policies and the environment largely impacts the land-use changes [20, 21]. A better understanding of the land-use changes can be acquired from the past practices, present patterns of the land use, and the future land use trajectory [22, 23, 24].
Based on the pixel, the change detection technique has been categorized into three stages [25], its features and the levels of the objects for processing of images and offers a classification of land use by using various techniques to detect the change [26,27,28]. It has been revealed from the past studies that the land-use changes pose a prospective to possess an important natural impact that changes the agricultural landuse [29]. Various studies have also endorsed the effects of the environment on land-use changes [30, 31, 32, 33]. Remote sensing (RS) and Geographic information system (GIS) have been very beneficial and important for evaluating and examining land-use changes [34, 35]. Remote sensing based on the satellite has the capability to offer synoptic land-use changes for a particular location and time period [36, 37, 38, 39]. Since the past few years, the studies have been largely dependent upon spatial remote sensing images data for mapping the individual species of the vegetation [40, 41, 42, 43, 44, 45].
The significant objective of the current research was to examine the agricultural production impacted by land-use changes for the years 2010, 2015 and 2020 in the study area, with major classifications were incorporated i.e. water, built-up, vegetation, forest and barren land. Besides, the rice, wheat and sugarcane crops were incorporated to know the impact of temporal changes from 2010 to 2020. It was revealed that the water, forest and barren landuse area was decreased; in contrast, the built-up area was increased.
Material and Methods.
Investigation site.
The word of the Shorkot has been derived from the word Shor, in Urdu, the significance of the word lies with the water logging and saltiness. This is the capital city of the Tehsil Shorkot, District Jhang, Punjab, Pakistan. Shorkot is situated between the 30° 30' N to 72° 24' E. This city is located on the Jhang-Multan road at an approximate distance of 56 km from the district Jhang. Toba Tek Singh is situated in the NE with an approximate distance of 35 km. The elevation of the Shorkot from the sea level is about 131 meters (433ft). Shorkot occupied the status of Town Council before the year 2001. But later on, the city enjoyed the status of the Tehsil Municipal Administration (TMA). The area of tehsil Shorkot is approximately 1,158 square kilometers with an overall population of 670,255 according to the 2017 census. Wheat, sugar cane and rice are the major crops sown in this area. The map of the study area is shown in figure 1.
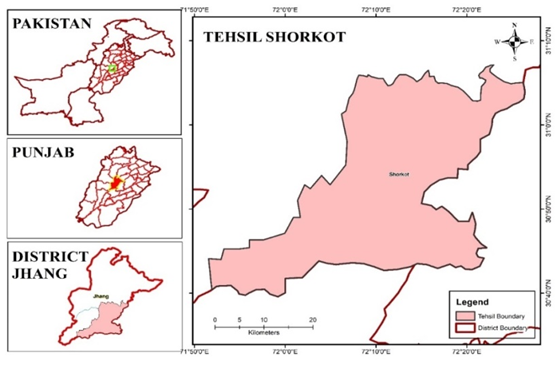
Figure 1. Study Site
Material and method.
The landsat satellite images were acquired for the years 2010, 2015 and 2020 as mentioned in Table 1 from the website of United States Geological Survey (www.usgs.gov) and www.glovis.usgs.gov) and classified it into major land use classes. The crops data was collected from Punjab Agriculture Department, TehsilShorkot, District Jhang Office for the years 2010 to 2020.
Image processing and classification (Maximum Likelihood)
Landsat/Sentinel-2 images comprising of different bands were passed through various processes e.g., layer stacking in software ERDAS imagine 15 (stacking is a technique to generate the multiband image from a distinct band) mosaicking (to combine the two discrete images) and sub setting (study area was extracted after stacking of the image) [46]. These composites were utilized to run the maximum likelihood classification algorithm to classify the land use and to demarcate major changes in the study area. Training samples were chosen by delineating the polygons for each land-use type by using the Arc GIS 10.8 [47, 48]. Spectral signatures along with ground validation through Differential GPS were performed to apply training samples in supervised classifications. A supervised classification method was used to classify the land use images, the characters of these remote sensing images have been provided in Table 1. Pairs of geostatistical modeling and multivariate techniques were used to predict and examine the Spatio-temporal tendency of land-use change impact on agricultural production.
Table 1. Characteristics of acquired remote sensing images
|
Sr No |
Satellite |
Pixel-Size |
Year |
|
1 |
Landsat 4-5 |
30 m |
2010 |
|
2 |
Landsat 8 |
15 m (Pan-sharpened) |
2018 |
|
3 |
Sentinel-2 |
10 m |
2020 |
Classification Accuracy Assessment
The overall accuracy for a particular image or a classified map can be obtained by calculating the classification agreement of the Cohen’s Kappa coefficient [49]. Kappa statistics was used to assess and evaluate the overall classification accuracy. Kappa index was prepared to evaluate the classified maps to find out the accuracy of the results for each image. It is used to tolerate the change effects in the accuracy, its value should not fall below 0.85.
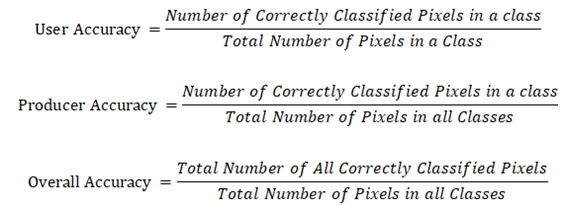
Classification accuracy assessment
For classification accuracy, 100 reference points were generated. Each point had a pixel value, which was automatically identified by the software. Randomly generated points were then identified, and the corresponding class was assigned by the user manually. The error matrix and kappa statistics for the classified images were generated. The error matrix indicates the accuracy of classification [50] where rows represent the classes resulting from the classified image, whereas the columns represent the classes identified by the user from the reference values. The diagonal cells of the error matrix indicate the total number of correctly identified pixels for each class of the reference and classified data. The off-diagonal cells represent incorrectly identified pixels, which indicate the error between reference data and classified data. There are two types of errors, namely omission and commission error, are occurred during the classification process.
Errors of commission occurred when a classification process assigns pixels to a specific class that doesn't belong to it. The number of pixels that were mistakenly assigned to a class was found in column cells of the class above and below the main diagonal. The Producer’s accuracy also described the number of errors of commission. For every class, errors of omission occurred when pixels that belong to one class, are included in other classes. In the confusion matrix, the number of omitted pixels was found in the row cells to the left and the right from the main diagonal. The user's accuracy is another indicator characterizing the errors of omission.
Results and discussion
The land-use changes are very critical in the study area due to unintentional and unplanned built-up areas. Such changes in land use resulted in decreased forest and vanishing barren land and an increase in the built-up area. The change in study sites from 2010, 2015, and 2020 are mapped in Figure 2.
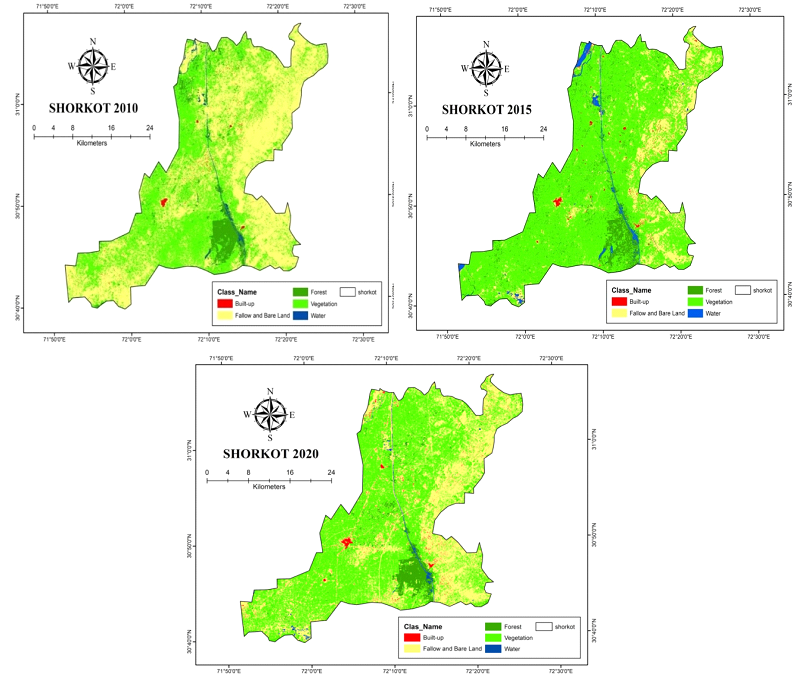
Figure 2. Land-use Change Analysis for the years 2010, 2015, 2020.
Table 2 reveals that the area under water was occupied 9.6 km2 in 2010 that increased to 21.04 km2in 2015and decreased to 19.4 km2in 2020. Built-up land was 16.6 km2 in 2010 that increased to 19.4 km2 in 2015 and 26.8 km2 in 2020. The total area under vegetation was computed as 513.2 km2 in 2010 that increased to 601.6km2 in 2015 and further increased to 717.7 km2in 2020. Forest land use showed decreasing trend as the covered area in 2010 was occupied 90.8 km2 that decreased to 86.7 km2 in 2015 and further decreased to 61.84 km2 in 2020. In 2010, barren land use was occupied 528.54 km2 that considerably decreased to 429.64 km2in 2015 further decreased to 333.1 km2in 2020. Barren land drastically decreased into watered, built-up, and vegetation land uses. The findings of this study will be helpful for the future conservation of various land-use types, urban and regional planning, and an increase in agricultural production of various crops in the study area.
Table 2. Landuse change analysis of the study area for the Landsat images for the year 2010 to 2020
|
Landuse Class |
Area 2010 km2 |
Area 2015 km2 |
Area 2020 km2 |
|
Water |
9.6 |
21.4 |
19.4 |
|
Built-up |
16.6 |
19.4 |
26.8 |
|
Vegetation |
513.2 |
601.6 |
717.6 |
|
Forest |
90.8 |
86.7 |
61.84 |
|
Fallow and Bare Land |
528.54 |
429.64 |
333.1 |
|
Total |
1158.74 |
1158.74 |
1158.74 |
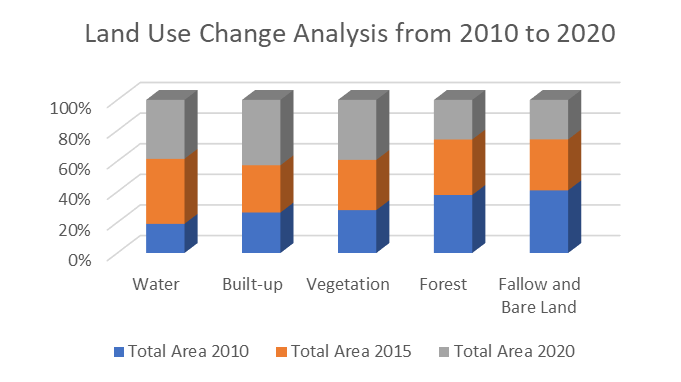
Figure 3. Landuse change analysis of the study area for the year 2010 to 2020
The analysis of the study area revealed that the land-use changes were the major driving factors behind influencing the agricultural production of the area. Figure 3 provides analysis of Landuse change in the study area for the year 2010 to 2020. The rapid reduction in the forest, vegetation, and barren land provides a clear signal for the increase in the built-up and vegetation area. Another important objective of the present was to assess the impact of the land-use changes on agricultural production. Results showed that agricultural production of wheat, sugarcane and rice in the year 2010 was 34, 575 and 33 mounds (1 mound= 40 kg) per acre respectively. Agricultural production of wheat, sugarcane and rice in the year 2020 was declined to 27, 900 and 36 mounds per acre respectively. The production and cultivable area of wheat crop decreased while the production and cultivable area of rice and sugarcane increased from 2010 to 2020 along with its cultivable area (Table 3).
Table 3. The production of wheat, sugarcane and rice crops in the years 2010 to 2020
|
S. No |
Year |
Wheat Per Acre Production (mounds) |
Cultivable Land (acres) |
Sugar cane Per Acre Production(mounds) |
Cultivable Land (acres) |
RicePer Acre Production (mounds) |
Cultivable Land (acres) |
|
1 |
2010 |
34 |
184,580 |
575 |
49,270 |
33 |
54,940 |
|
2 |
2011 |
34 |
185,980 |
600 |
50,240 |
34 |
56,350 |
|
3 |
2012 |
33 |
182,350 |
600 |
49,550 |
34 |
56,900 |
|
4 |
2013 |
34 |
179,990 |
650 |
51,600 |
35 |
57,200 |
|
5 |
2014 |
34 |
175,250 |
700 |
52,250 |
35 |
57,730 |
|
6 |
2015 |
31 |
175,550 |
700 |
52,503 |
34 |
59,195 |
|
7 |
2016 |
35 |
167,340 |
650 |
52,350 |
32 |
60,250 |
|
8 |
2017 |
31 |
168,250 |
800 |
53,450 |
33 |
59,540 |
|
9 |
2018 |
29 |
166,500 |
900 |
61,350 |
35 |
60,450 |
|
10 |
2019 |
26 |
163,460 |
900 |
53,500 |
35 |
68,500 |
|
11 |
2020 |
27 |
160,215 |
900 |
52,400 |
36 |
68,800 |
Source: Agriculture Department, Tehsil Shorkot (2020)
The confusion matrix were drawn to compute accuracy of classification that was 81%, 80% and 83% for the years 2010, 2015 and 2020,
|
Table 4. Confusion matrix indicating the producer's accuracy, user accuracy, and overall accuracy 2010 LULC map of the study area. |
|||||||||||||||||||||||||||
|
Reference Data |
|||||||||||||||||||||||||||
|
Classified Data |
Built-up |
Soil |
Crop |
Vegetation |
Water |
Row Total |
User Accuracy (%) |
||||||||||||||||||||
|
Built up |
29 |
6 |
0 |
0 |
0 |
35 |
82.86 |
||||||||||||||||||||
|
Soil |
1 |
12 |
2 |
0 |
0 |
15 |
80.00 |
||||||||||||||||||||
|
Crop |
0 |
1 |
19 |
3 |
0 |
23 |
82.61 |
||||||||||||||||||||
|
Vegetation |
0 |
1 |
3 |
14 |
0 |
18 |
77.78 |
||||||||||||||||||||
|
Water |
0 |
1 |
1 |
0 |
7 |
9 |
77.78 |
||||||||||||||||||||
|
Column Total |
30 |
21 |
25 |
17 |
7 |
||||||||||||||||||||||
|
Producer's Accuracy (%) |
96.67 |
57.14 |
76.00 |
82.35 |
100.00 |
||||||||||||||||||||||
|
Overall Classification Accuracy (%) |
81 |
|
|
|
|
|
|||||||||||||||||||||
|
Table 5. Confusion matrix indicating the producer's accuracy, user accuracy, and overall accuracy 2015 LULC map of the study area. |
|||||||||||||||||||||||||||
|
Reference Data |
|||||||||||||||||||||||||||
|
Classified Data |
Built-up |
Soil |
Crop |
Vegetation |
Water |
Row Total |
User Accuracy (%) |
||||||||||||||||||||
|
Built up |
27 |
3 |
0 |
0 |
0 |
30 |
90.00 |
||||||||||||||||||||
|
Soil |
2 |
7 |
1 |
0 |
0 |
10 |
70.00 |
||||||||||||||||||||
|
Crop |
0 |
2 |
18 |
5 |
0 |
25 |
72.00 |
||||||||||||||||||||
|
Vegetation |
0 |
0 |
4 |
15 |
1 |
20 |
75.00 |
||||||||||||||||||||
|
Water |
0 |
1 |
1 |
0 |
13 |
15 |
86.67 |
||||||||||||||||||||
|
Column Total |
29 |
13 |
24 |
20 |
14 |
||||||||||||||||||||||
|
Producer's Accuracy (%) |
93.10 |
53.85 |
75.00 |
75.00 |
92.86 |
||||||||||||||||||||||
|
Overall Classification Accuracy (%) |
80 |
||||||||||||||||||||||||||
|
|
Table 6. Confusion matrix indicating the producer's accuracy, user accuracy, and overall accuracy 2020 LULC map of the study area. |
||||||||||||||||||||||||||
|
|
Reference Data |
||||||||||||||||||||||||||
|
|
Classified Data |
Built-up |
Soil |
Crop |
Vegetation |
Water |
Row Total |
User Accuracy (%) |
|||||||||||||||||||
|
|
Built up |
28 |
2 |
0 |
0 |
0 |
30 |
93.33 |
|||||||||||||||||||
|
|
Soil |
3 |
17 |
0 |
0 |
0 |
20 |
85.00 |
|||||||||||||||||||
|
|
Crop |
0 |
2 |
19 |
4 |
0 |
25 |
76.00 |
|||||||||||||||||||
|
|
Vegetation |
0 |
0 |
4 |
10 |
1 |
15 |
66.67 |
|||||||||||||||||||
|
|
Water |
0 |
1 |
0 |
0 |
9 |
10 |
90.00 |
|||||||||||||||||||
|
|
Column Total |
31 |
22 |
23 |
14 |
10 |
|||||||||||||||||||||
|
|
Producer's Accuracy (%) |
90.32 |
77.27 |
82.61 |
71.43 |
90.00 |
|||||||||||||||||||||
|
|
Overall Classification Accuracy (%) |
83 |
|||||||||||||||||||||||||
The scatterplots of results of classification are mapped in Figure 4. Confusion matrix indicating the producer's accuracy, user accuracy, and overall accuracy for LULC map of the study area is presented in Table 3, 4, 5 and 6.
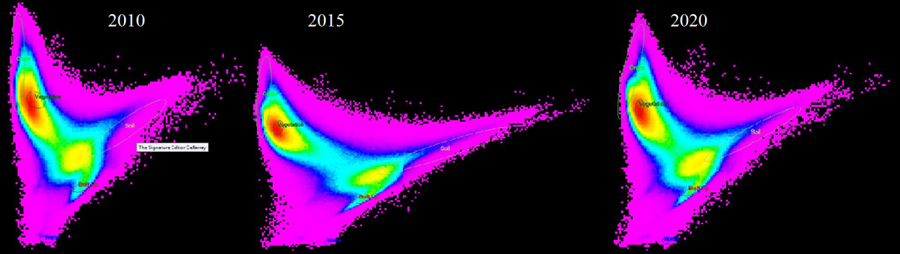
Figure 4. Scatter plots.
Conclusion.
The study showcased that there was a rapid and unprecedented change in the barren, forest and water land-use class to built-up area and vegetation land-use. The decrease in the forest and barren land use classes were one of the main reasons for the reduction in agricultural production and increase in built-up area. The findings showed that historic conversion took place in the study area due to a decrease in the forest and barren land due to an accelerated increase in the density of population, development in infrastructure and urban advancements. Moreover, there had been a continuous change in barren and forest land-use class to built-up and vegetation land-use class. In order to increase the agricultural production and economy of the country, a balanced check on the land-use changes is highly crucial. Hence, the present research will help in improving the capability of the government to suggest the various remedial measures for decreasing the impact of the land-use change conversion from agricultural/ forest land use to built-up area for sustainable management of land use. It will be also helpful in land use planning and in estimation of agricultural production in the future.
Acknowledgment. We acknowledge this work to our supervisors.
Author’s Contribution. All the authors contributed equally.
Conflict of interest. The authors declare no conflict of the interest for publishing.
Project details. Nil
REFERENCES
[1] A. R. Bock, W. H. Farmer, and L. E. Hay, “Quantifying uncertainty in simulated streamflow and runoff from a continental-scale monthly water balance model,” Adv. Water Resour., vol. 122, pp. 166–175, Dec. 2018, doi: 10.1016/J.ADVWATRES.2018.10.005.
[2] Z. Jiang, A. Sharma, F. Johnson, Z. Jiang, A. Sharma, and F. Johnson, “Assessing the sensitivity of hydro-climatological change detection methods to model uncertainty and bias,” AdWR, vol. 134, p. 103430, Dec. 2019, doi: 10.1016/J.ADVWATRES.2019.103430.
[3] R. John and M. John, “Adaptation of the visibility graph algorithm for detecting time lag between rainfall and water level fluctuations in Lake Okeechobee,” Adv. Water Resour., vol. 134, p. 103429, 2019, doi: 10.1016/j.advwatres.2019.103429.
[4] D. J. Guan, H. F. Li, T. Inohae, W. Su, T. Nagaie, and K. Hokao, “Modeling urban land use change by the integration of cellular automaton and Markov model,” Ecol. Modell., vol. 222, no. 20–22, pp. 3761–3772, Oct. 2011, doi: 10.1016/J.ECOLMODEL.2011.09.009.
[5] M. W. A. Halmy, P. E. Gessler, J. A. Hicke, and B. B. Salem, “Land use/land cover change detection and prediction in the north-western coastal desert of Egypt using Markov-CA,” Appl. Geogr., vol. 63, pp. 101–112, Sep. 2015, doi: 10.1016/J.APGEOG.2015.06.015.
[6] H. W. Zheng, G. Q. Shen, H. Wang, and J. Hong, “Simulating land use change in urban renewal areas: A case study in Hong Kong,” Habitat Int., vol. 46, pp. 23–34, 2015, doi: 10.1016/j.habitatint.2014.10.008.
[7] F. Sedano, V. Molini, and M. A. K. Azad, “A Mapping Framework to Characterize Land Use in the Sudan-Sahel Region from Dense Stacks of Landsat Data,” Remote Sens. 2019, Vol. 11, Page 648, vol. 11, no. 6, p. 648, Mar. 2019, doi: 10.3390/RS11060648.
[8] H. Han, C. Yang, and J. Song, “Scenario Simulation and the Prediction of Land Use and Land Cover Change in Beijing, China,” Sustain. 2015, Vol. 7, Pages 4260-4279, vol. 7, no. 4, pp. 4260–4279, Apr. 2015, doi: 10.3390/SU7044260.
[9] J. Anand, A. K. Gosain, and R. Khosa, “Prediction of land use changes based on Land Change Modeler and attribution of changes in the water balance of Ganga basin to land use change using the SWAT model,” Sci. Total Environ., vol. 644, pp. 503–519, Dec. 2018, doi: 10.1016/J.SCITOTENV.2018.07.017.
[10] D. Guan, X. Lin, W. Gao, W. Su, and K. Hokao, “DYNAMIC EVOLVEMENT ASSESSMENT AND FORECAST OF LAND USE BASED ON GEOGRAPHIC INFORMATION SYSTEM,” Lowl. Technol. Int., vol. 16, no. 1, pp. 36–44, Jun. 2014, doi: 10.14247/LTI.16.1_36.
[11] C. K. M. Ho, T. Jackson, M. T. Harrison, and R. J. Eckard, “Increasing ewe genetic fecundity improves whole-farm production and reduces greenhouse gas emissions intensities: 2. Economic performance,” Anim. Prod. Sci., vol. 54, no. 9, pp. 1248–1253, 2014, doi: 10.1071/AN14309.
[12] M. T. Harrison, J. R. Evans, H. Dove, and A. D. Moore, “Recovery dynamics of rainfed winter wheat after livestock grazing 2. Light interception, radiation-use efficiency and dry-matter partitioning,” Crop Pasture Sci., vol. 62, no. 11, pp. 960–971, 2011, doi: 10.1071/CP11235.
[13] “Simulating Emergent Urban Form Using Agent-Based Modeling: Desakota in the Suzhou-Wuxian Region in China on JSTOR.” https://www.jstor.org/stable/4620285 (accessed Mar. 02, 2022).
[14] M. Mohsin, “Urban Growth and Conversion of Farmland in Bahawalpur City, Pakistan Causes, Rates and Remedies.”
[15] “(PDF) Sprawling Housing Schemes and Loss of Farmland: A Case of Bahawalpur City, Pakistan.” https://www.researchgate.net/publication/284186910_Sprawling_Housing_Schemes_and_Loss_of_Farmland_A_Case_of_Bahawalpur_City_Pakistan (accessed Mar. 02, 2022).
[16] M. Minallah, M. Mohsin, and A. Khan, “Expansion of Residential Colonies and Conversion of Farmland in Bahawalpur City, Pakistan: A Temporal View,” J. Basic Appl. Sci., vol. 12, no. February, pp. 124–134, 2016, doi: 10.6000/1927-5129.2016.12.19.
[17] M. Mohsin and A. A. Khan, “Analysis of the determinants of agricultural land conversion (ALC) into housing colonies in Bahawalpur city, Pakistan,” Pakistan J. Agric. Sci., vol. 54, no. 3, pp. 725–730, Sep. 2017, doi: 10.21162/PAKJAS/17.2643.
[18] “(PDF) Impact of Land Use Change on Land Values: A Case of Jhangiwala, Bahawalpur City, Pakistan.” https://www.researchgate.net/publication/336056901_Impact_of_Land_Use_Change_on_Land_Values_A_Case_of_Jhangiwala_Bahawalpur_City_Pakistan (accessed Mar. 02, 2022).
[19] M. Sahana, R. Ahmed, and H. Sajjad, “Analyzing land surface temperature distribution in response to land use/land cover change using split window algorithm and spectral radiance model in Sundarban Biosphere Reserve, India,” Model. Earth Syst. Environ., vol. 2, no. 2, Jun. 2016, doi: 10.1007/S40808-016-0135-5.
[20] A. S. M. Abdul Athick, K. Shankar, and H. R. Naqvi, “Data on time series analysis of land surface temperature variation in response to vegetation indices in twelve Wereda of Ethiopia using mono window, split window algorithm and spectral radiance model,” Data Br., vol. 27, p. 104773, Dec. 2019, doi: 10.1016/J.DIB.2019.104773.
[21] P. Sinha, L. Kumar, and N. Reid, “Three-date landsat thematic mapper composite in seasonal land-cover change identification in a mid-latitudinal region of diverse climate and land use,” J. Appl. Remote Sens., vol. 6, no. 1, p. 063595, Oct. 2012, doi: 10.1117/1.JRS.6.063595.
[22] M. Almazroui, A. Mashat, M. E. Assiri, and M. J. Butt, “Application of Landsat Data for Urban Growth Monitoring in Jeddah,” Earth Syst. Environ., vol. 1, no. 2, Dec. 2017, doi: 10.1007/S41748-017-0028-4.
[23] R. Bhagyanagar, B. M. Kawal, G. S. Dwarakish, and S. Surathkal, “Land use/land cover change and urban expansion during 1983–2008 in the coastal area of Dakshina Kannada district, South India,” J. Appl. Remote Sens., vol. 6, no. 1, pp. 063576–1, Sep. 2012, doi: 10.1117/1.JRS.6.063576.
[24] Z. Zhang et al., “Mass Change of Glaciers in Muztag Ata–Kongur Tagh, Eastern Pamir, China from 1971/76 to 2013/14 as Derived from Remote Sensing Data,” PLoS One, vol. 11, no. 1, p. e0147327, Jan. 2016, doi: 10.1371/JOURNAL.PONE.0147327.
[25] “(PDF) GIS-Based Change Detection of Coastal Features along Karachi Coast, Pakistan.” https://www.researchgate.net/publication/342624631_GIS-Based_Change_Detection_of_Coastal_Features_along_Karachi_Coast_Pakistan (accessed Mar. 02, 2022).
[26] F. Akhtar, U. K. Awan, B. Tischbein, and U. W. Liaqat, “A phenology based geo-informatics approach to map land use and land cover (2003–2013) by spatial segregation of large heterogenic river basins,” Appl. Geogr., vol. 88, pp. 48–61, Nov. 2017, doi: 10.1016/J.APGEOG.2017.09.003.
[27] A. Y. M. Abdullah, A. Masrur, M. S. Gani Adnan, M. A. Al Baky, Q. K. Hassan, and A. Dewan, “Spatio-Temporal Patterns of Land Use/Land Cover Change in the Heterogeneous Coastal Region of Bangladesh between 1990 and 2017,” Remote Sens. 2019, Vol. 11, Page 790, vol. 11, no. 7, p. 790, Apr. 2019, doi: 10.3390/RS11070790.
[28] S. Hussain et al., “Using GIS tools to detect the land use/land cover changes during forty years in Lodhran District of Pakistan,” Environ. Sci. Pollut. Res. Int., vol. 27, no. 32, pp. 39676–39692, Nov. 2020, doi: 10.1007/S11356-019-06072-3.
[29] M. Hasanuzzaman, “Agronomic crops: Volume 2: Management practices,” Agron. Crop. Vol. 2 Manag. Pract., pp. 1–652, Jan. 2019, doi: 10.1007/978-981-32-9783-8.
[30] M. J. M. Cheema and W. G. M. Bastiaanssen, “Land use and land cover classification in the irrigated Indus Basin using growth phenology information from satellite data to support water management analysis,” Agric. Water Manag., vol. 97, no. 10, pp. 1541–1552, Oct. 2010, doi: 10.1016/J.AGWAT.2010.05.009.
[31] S. Das and R. Sarkar, “Predicting the land use and land cover change using Markov model: A catchment level analysis of the Bhagirathi-Hugli River,” Spat. Inf. Res., vol. 27, no. 4, pp. 439–452, Aug. 2019, doi: 10.1007/S41324-019-00251-7.
[32] J. Tan, D. Yu, Q. Li, X. Tan, and W. Zhou, “Spatial relationship between land-use/land-cover change and land surface temperature in the Dongting Lake area, China,” Sci. Reports 2020 101, vol. 10, no. 1, pp. 1–9, Jun. 2020, doi: 10.1038/s41598-020-66168-6.
[33] B. J. B. Zoungrana et al., “Multi-Temporal Landsat Images and Ancillary Data for Land Use/Cover Change (LULCC) Detection in the Southwest of Burkina Faso, West Africa,” Remote Sens. 2015, Vol. 7, Pages 12076-12102, vol. 7, no. 9, pp. 12076–12102, Sep. 2015, doi: 10.3390/RS70912076.
[34] G. T. Ayele et al., “Time Series Land Cover Mapping and Change Detection Analysis Using Geographic Information System and Remote Sensing, Northern Ethiopia:,” https://doi.org/10.1177/1178622117751603, vol. 11, Jan. 2018, doi: 10.1177/1178622117751603.
[35] H. hc, G. S, L. Srikanth, and H. J. Surendra, “Prioritization of sub-watersheds of the Kanakapura Watershed in the Arkavathi River Basin, Karnataka, India- using Remote sensing and GIS,” https://doi.org/10.1080/24749508.2020.1846841, vol. 5, no. 2, pp. 149–160, 2020, doi: 10.1080/24749508.2020.1846841.
[36] C. Chew, R. Shah, C. Zuffada, G. Hajj, D. Masters, and A. J. Mannucci, “Demonstrating soil moisture remote sensing with observations from the UK TechDemoSat-1 satellite mission,” Geophys. Res. Lett., vol. 43, no. 7, pp. 3317–3324, Apr. 2016, doi: 10.1002/2016GL068189.
[37] M. S. Saleem, S. R. Ahmad, Shafiq-Ur-Rehman, and M. A. Javed, “Impact assessment of urban development patterns on land surface temperature by using remote sensing techniques: a case study of Lahore, Faisalabad and Multan district,” Environ. Sci. Pollut. Res., vol. 27, no. 32, pp. 39865–39878, Nov. 2020, doi: 10.1007/S11356-020-10050-5.
[38] M. Aboelnour, B. A. Engel, M. Aboelnour, and B. A. Engel, “Application of Remote Sensing Techniques and Geographic Information Systems to Analyze Land Surface Temperature in Response to Land Use/Land Cover Change in Greater Cairo Region, Egypt,” J. Geogr. Inf. Syst., vol. 10, no. 1, pp. 57–88, Jan. 2018, doi: 10.4236/JGIS.2018.101003.
[39] “Monitoring urban growth and land use changes using GIS and remote sensing: A case study of Tehsil Burewala. - Free Online Library.” https://www.thefreelibrary.com/Monitoring+urban+growth+and+land+use+changes+using+GIS+and+remote...-a0631021796 (accessed Mar. 02, 2022).
[40] N. T. Huyen, L. H. Tu, V. N. Q. Tram, D. N. Minh, N. D. Liem, and N. K. Loi, “Assessing the impacts of climate change on water resources in the srepok watershed, central highland of Vietnam,” J. Water Clim. Chang., vol. 8, no. 3, pp. 524–534, Sep. 2017, doi: 10.2166/WCC.2017.135.
[41] R. Kharazmi, A. Tavili, M. R. Rahdari, L. Chaban, E. Panidi, and J. Rodrigo-Comino, “Monitoring and assessment of seasonal land cover changes using remote sensing: a 30-year (1987–2016) case study of Hamoun Wetland, Iran,” Environ. Monit. Assess., vol. 190, no. 6, Jun. 2018, doi: 10.1007/S10661-018-6726-Z.
[42] M. Romaguera, R. G. Vaughan, J. Ettema, E. Izquierdo-Verdiguier, C. A. Hecker, and F. D. van der Meer, “Detecting geothermal anomalies and evaluating LST geothermal component by combining thermal remote sensing time series and land surface model data,” Remote Sens. Environ., vol. 204, pp. 534–552, Jan. 2018, doi: 10.1016/J.RSE.2017.10.003.
[43] S. Pal and S. Ziaul, “Detection of land use and land cover change and land surface temperature in English Bazar urban centre,” Egypt. J. Remote Sens. Sp. Sci., vol. 20, no. 1, pp. 125–145, Jun. 2017, doi: 10.1016/J.EJRS.2016.11.003.
[44] “(PDF) Impact of land use change on water quality of Jhang District Punjab, Pakistan.” https://www.researchgate.net/publication/334251012_Impact_of_land_use_change_on_water_quality_of_Jhang_District_Punjab_Pakistan (accessed Mar. 02, 2022).
[45] M. Rani et al., “Multi-temporal NDVI and surface temperature analysis for Urban Heat Island inbuilt surrounding of sub-humid region: A case study of two geographical regions,” Remote Sens. Appl. Soc. Environ., vol. 10, pp. 163–172, Apr. 2018, doi: 10.1016/J.RSASE.2018.03.007.
[46] M. T. U. Rahman et al., “Temporal dynamics of land use/land cover change and its prediction using CA-ANN model for southwestern coastal Bangladesh,” Environ. Monit. Assess., vol. 11, no. 189, pp. 1–18, Oct. 2017, doi: 10.1007/S10661-017-6272-0.
[47] D. P. Nayak and M. H. Fulekar, “Coastal Geomorphological and Land Use and Land Cover Study on Some Sites of Gulf of Kachchh, Gujarat, West Coast of India using Multi-Temporal Remote Sensing Data,” Int. J. Adv. Remote Sens. GIS, vol. 6, no. 1, pp. 2192–2203, Jun. 2017, doi: 10.23953/CLOUD.IJARSG.273.
[48] D. Wang, X. Yu, G. Jia, and H. Wang, “Sensitivity analysis of runoff to climate variability and land-use changes in the Haihe Basin mountainous area of north China,” Agric. Ecosyst. Environ., vol. 269, pp. 193–203, Jan. 2019, doi: 10.1016/J.AGEE.2018.09.025.
[49] W. Y. Yan, A. Shaker, and N. El-Ashmawy, “Urban land cover classification using airborne LiDAR data: A review,” Remote Sens. Environ., vol. 158, pp. 295–310, Mar. 2015, doi: 10.1016/J.RSE.2014.11.001.
[50] M. Sajid, M. Mobeen, T. Aziz, N. Kanwal, A. Rehman, and M. Rauf, “IMPACT OF LAND USE CHANGE ON AGRICULTURE PRODUCTION OF MULTAN DISTRICT. (A CASE STUDY),” Sci.Int.(Lahore), vol. 32, no. 6, pp. 705–710, 2020, Accessed: Mar. 02, 2022. [Online]. Available: http://glovis.usgs.gov/.


